Opening the book…
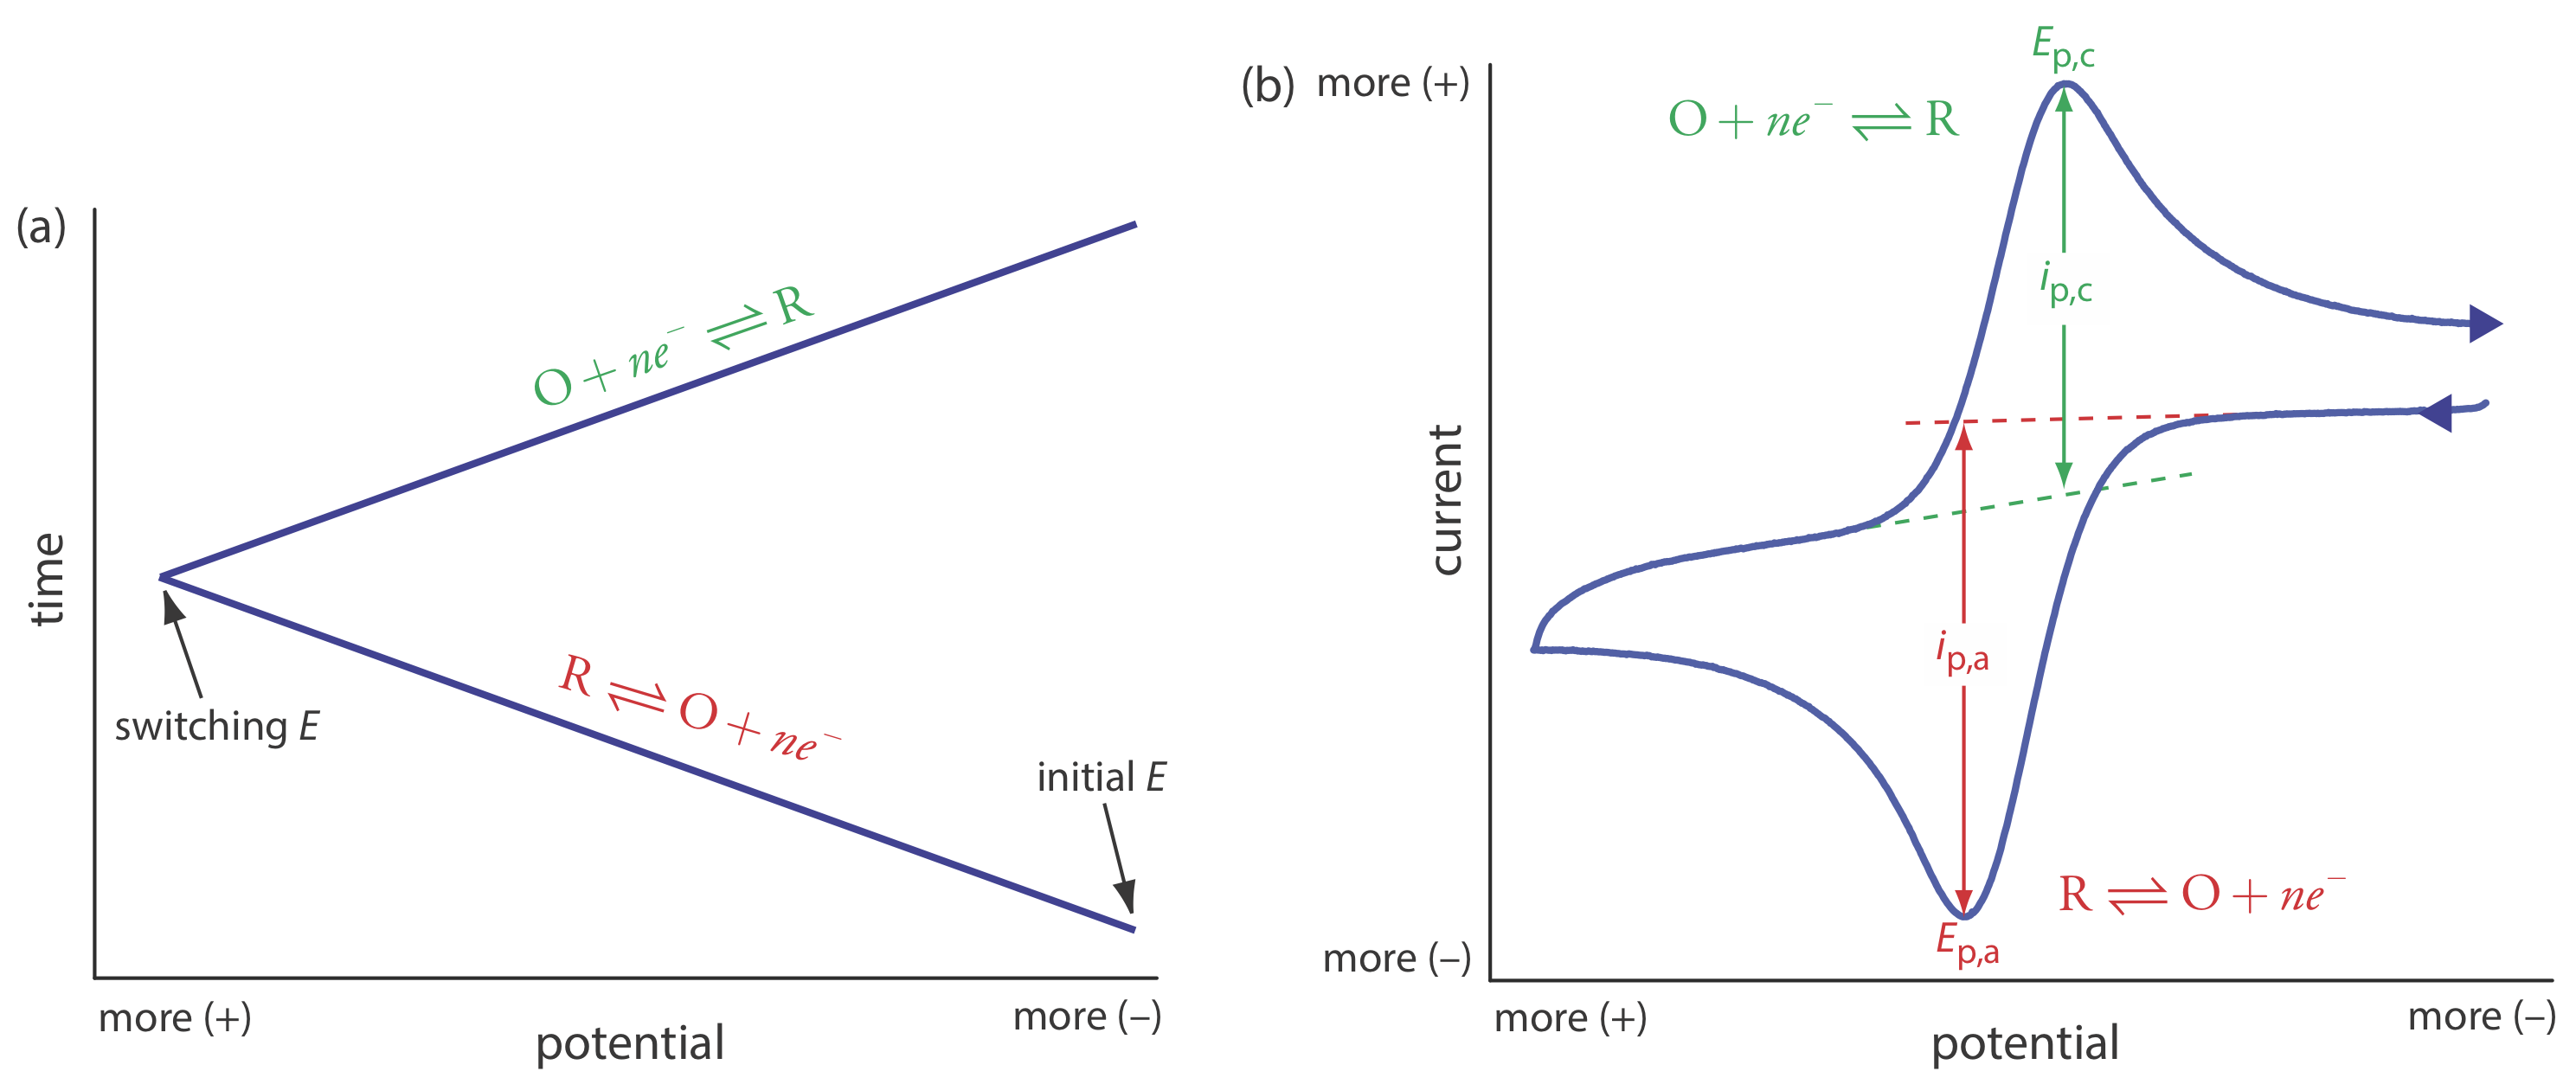
In linear sweep voltammetry we scan the potential in one direction, either to more positive potentials or to more negative potentials. In cyclic voltammetry we complete a scan in both directions. Figure \(\PageIndex{1}\)a shows a typical potential-excitation signal. In this example, we first scan the potential to more positive values, resulting in the following oxidation reaction for the species R.
\[R \rightleftharpoons O+n e^{-} \label{cv1} \]
When the potential reaches a predetermined switching potential, we reverse the direction of the scan toward more negative potentials. Because we generated the species O on the forward scan, during the reverse scan it reduces back to R.
\[O+n e^{-} \rightleftharpoons R \label{cv2} \]
Cyclic voltammetry is carried out in an unstirred solution, which, as shown in Figure \(\PageIndex{1}\)b, results in peak currents instead of limiting currents. The voltammogram has separate peaks for the oxidation reaction and for the reduction reaction, each characterized by a peak potential and a peak current.
The peak current in cyclic voltammetry is given by the Randles-Sevcik equation
\[i_{p}=\left(2.69 \times 10^{5}\right) n^{3 / 2} A D^{1 / 2} \nu^{1 / 2} C_{A} \label{cv3} \]
where n is the number of electrons in the redox reaction, A is the area of the working electrode, D is the diffusion coefficient for the electroactive species, \(\nu\) is the scan rate, and CA is the concentration of the electroactive species at the electrode. For a well-behaved system, the anodic and the cathodic peak currents are equal, and the ratio ip,a/ip,c is 1.00. The half-wave potential, E1/2, is midway between the anodic and cathodic peak potentials.
\[E_{1 / 2}=\frac{E_{p, a}+E_{p, c}}{2} \label{cv4} \]
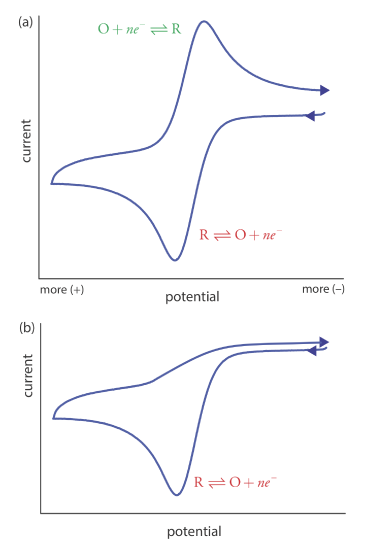
Scanning the potential in both directions provides an opportunity to explore the electrochemical behavior of species generated at the electrode. This is a distinct advantage of cyclic voltammetry over other voltammetric techniques. Figure \(\PageIndex{2}\) shows the cyclic voltammogram for the same redox couple at both a faster and a slower scan rate. At the faster scan rate, \(\PageIndex{2}\)a, we see two peaks. At the slower scan rate in Figure \(\PageIndex{2}\)b, however, the peak on the reverse scan disappears. One explanation for this is that the products from the reduction of R on the forward scan have sufficient time to participate in a chemical reaction whose products are not electroactive.
This page titled 25.4: Cyclic Voltammetry was last modified on Thu, 27 Oct 2022 14:11:33 GMT and is shared under a CC BY-NC-SA 4.0 license and was authored, remixed, and/or curated by David Harvey.
The book could not be loaded just now.