Opening the book…
The electromagnetic spectrum consists of all known forms of electromagnetic radiation (Figure 5-2). This includes radio waves, microwaves, ultraviolet, X-rays, gamma rays, infrared and visible light. Types of electromagnetic radiation can be described based on their respective wavelengths, frequencies and photon energies.
Figure 5-2 provides both the frequencies and wavelengths (in meters) for the various types of radiation. Additionally, they have provided an approximate scale to help you visualize the differences. The energy of this spectrum travel as waves and differ parts of the electromagnetic spectrum have different wavelengths. A wavelength is the distance from one crest to the next crest of the wave. The largest wavelengths are radio waves with a range of wavelengths from 1 millimeter to 1000 meters. At the other end of the spectrum, we have gamma rays with wavelengths at 10-12 meters (around 0.00000000001 M or one picometer or 1 trillionth of a meter). For scale, a radio waves wavelength could be as long as the height of skyscrapers while gamma rays are the width of an atomic nucleus.

There is a relationship amongst the wavelength, frequency and photon energies of electromagnetic radiation. The wavelength (identified using λ - Greek letter lambda) is inversely proportional to the wave’s frequency (f) and the frequency is directly proportional to the photon energy(E). This means that as the wavelengths get longer their frequencies decrease and energy decreases as well. For example, a microwave with lambda of 10-2 m has a frequency of 1010 Hz, while X-rays with lambda 10-10 m (smaller) has a frequency of 1018 Hz (larger). The higher the frequency the more energy. This is why we are concerned about exposing our bodies to too many X-rays (high energy) but not concerned about radio waves (low energy).
Visible light (VL) is only a small range of the electromagnetic spectrum with wave lengths of 400 nm (4 x 10⁻⁷ m) to 700 nm (7 x 10⁻⁷ m) (Figure 5-3). The range for VL is literally “in the eye of the beholder.” The range will shift with species and even within species. Some large cats can see further into the long wavelengths while many insects can see deeper into the UV range. Even amongst humans, the range for “visible light” can vary.

Light is often described by its wavelength, however for physiological activities such as photosynthesis, it is often easier to describe it in terms of photons – discrete packages of light energy. As was mentioned earlier, as wavelengths increase, frequencies decrease. This also hold true for the energy of photon.
| Color | Wavelength | Frequency | Photon energy |
|---|---|---|---|
| Violet | 380–450 nm | 680–790 THz | 2.95–3.10 eV |
| Blue | 450–485 nm | 620–680 THz | 2.64–2.75 eV |
| Cyan | 485–500 nm | 600–620 THz | 2.48–2.52 eV |
| Green | 500–565 nm | 530–600 THz | 2.25–2.34 eV |
| Yellow | 565–590 nm | 510–530 THz | 2.10–2.17 eV |
| Orange | 590–625 nm | 480–510 THz | 2.00–2.10 eV |
| Red | 625–740 nm | 405–480 THz | 1.65–2.00 eV |
In Table 5-1 each row represents a color in the VL spectrum from violet to red. For each color the corresponding range for the wavelength (in nm), frequency (in Terahertz) and photon energy (in electron-volts) is given. (Electron-volts are a measure of energy; it takes 6.24x10¹⁸eV to equal 1 joule.) Notice that as you read down the list (from violet to red) the wavelengths get larger, while both the frequencies and the photon energies decrease. Because of this, while both blue and red light are used in photosynthesis, blue is more photosynthetically productive than red.
When we perceive light energy, our eyes interpret the different wavelengths as colors from violet (380-450nm) to red (625-740nm) (Table 5-1). Our perception of color is due to specific wavelengths of light reflecting off surfaces. If a car appears blue to you, it is because the wavelengths being reflected to your eyes fall within the blue range. That is within the range of 380-450 nm. We perceive the color black when no wavelengths of VL are being reflected. In contrast, we perceive white when all wavelengths are reflected equally. The term “white light” refers to light containing all the colors of the spectrum. (See Colors and Light Extended).
Colors and Light Extended
What would a white surface look like if illuminated by red-light only?
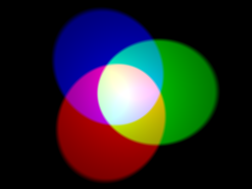
Since the only wavelengths of light that can be reflected back to our eyes are red, we would see a red tile. To see white, red, green and blue wavelengths must reflected. When working with beams of light, additive color mixing comes into play (Figure 5-4). This method is used to product color on TVs, computer monitors and cell phones. Additive primaries act as sources of light. The primaries red, green, and blue combine pairwise to produce the additive secondaries cyan, magenta, and yellow. Combining all three primaries (center) produces white. Subtractive mixing relies on the colored material, like pigments, being lit by an external white light source.
The sun is our primary source of light, and it showers the earth with both VL and other types of wavelengths. Of the solar energy striking a leaf surface, 50 percent exist as wavelengths that can’t be absorbed and 15% is reflected or transmitted (passes through the leaf) (Figure 5-5). About 10% is dissipated as heat. That leaves on 25% for used by the plant. Metabolism by the cells of the leaves accounts for 20% of that 25%. This energy is used to maintain the cells; it includes ATP from in the light reactions used for cellular work and in the consumption of intermediates used in anabolic (molecular building) activities. Only 5% gets converted into carbohydrates.
Since much of the solar energy is not absorbed, physiologist studying photosynthesis are typically only concerned with PAR – photosynthetic active radiation (400-700 nm). It is this range of light that powers photosynthetic activity.

This page titled 5.1: Physics of Light was last modified on Thu, 12 Nov 2026 21:35:11 GMT and is shared under a CC BY-NC-SA 4.0 license and was authored, remixed, and/or curated by .
The book could not be loaded just now.