Hospital-Networks-and-the-Dispersal-of-Hospital-Acquired-Pathogens-by-Patient-Transfer-pone.0035002.s004
Donker T, Wallinga J, Slack R, Grundmann H
Low resolution (320×240): this is the archive's own copy. Where the browser can use the graphics chip, Enhance picture in the player's settings draws it sharper.
Make a clip
CC BY 2.5 · Donker T, Wallinga J, Slack R, Grundmann H
Up to 60 seconds, at most the picture size of the copy it is cut from. The clip carries the title, the credit, the licence and a link back here. It is made in this browser, and nothing is sent to this site.
Or send the moment itself: https://invisiblenetwork.ai/watch/archive/commons/22679658?play=1&t=0
Parts
About
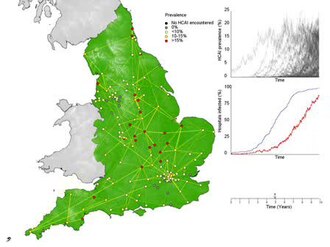
Shows one realisation of the 5,000 model simulations. Main panel shows the geographical distribution of the hospital trusts in England. The animation captures the dispersal dynamics of hospital-acquired bacteria after an outbreak in a single hospital in the East Midlands whereby 5% of all patients have been infected. Yellow radiating lines indicate transfer of infected patients to other hospitals. The colour of the placemarks indicates the prevalence in individual hospital (Black, hospitals that never encountered infected patients. Gray, hospitals with history of infected patients but no present cases. Pale yellow, hospitals with 0–10% present cases. Yellow, hospitals with 10–15% present cases. Red, hospitals with >15% present). The top right panel shows the point prevalence in each of the hospitals as time progresses, the middle right panel shows the percentage of hospitals that have encountered the infection (blue line) and the percentage of hospitals that have present cases. The lover right panel indicates the progression in time.
Human-made No record of this work says a model made it. What this means.
More from Wikimedia Commons
 Short
Making a silver chain
 Short
Jennifer Doudna Nobel Prize medal presentation
 Short
¿Qué es Wikipedia?
 Short
Wie entstehen Fossilien (CC by 4.0)
 Short
Rudy Mancuso & Maia Mitchell - Magic (Official Music Video)
 Documentary
Die wichtigsten Klimafaktoren (ZDF, Terra X) 720p 50FPS
 Short
Curiosity's Seven Minutes of Terror
 Short
Wikilovesmonuments.org
 Short
Wikipedia - FactsMatter2016
 Short
President Obama on Death of Osama bin Laden no watermark
 Short
Cassini's Grand Finale
 Cartoon