Raadsels aan het begin van het heelal
· 14 min · S1 E122
Episode Raadsels aan het begin van het heelal
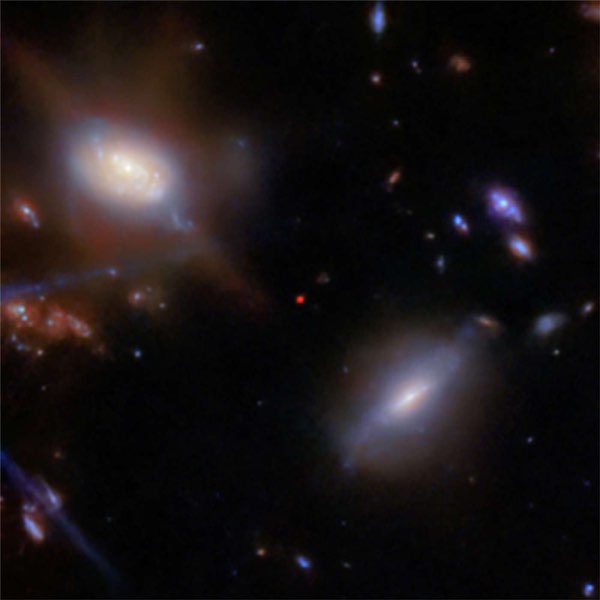
Misschien moet ik eens ophouden met die "click bait" titels, nietwaar? Maar hoe dat ook zij, een recente waarneming schudt ons begrip van de evolutie van het heelal weer eens flink door de war. Voor wie denkt dat astronomen daar ongelukkig van worden: integendeel! "Inching forward, ever so slowly" is wat wetenschap is.
Cosmic Reionization: https://webbtelescope.org/contents/media/images/2020/37/4697-Image Witnessing the onset of reionization through Lyman-α emission at redshift 13: https://www.nature.com/articles/s41586-025-08779-5 Identification and properties of intense star-forming galaxies at redshifts z>10: https://arxiv.org/ftp/arxiv/papers/2212/2212.04480.pdf
# Plot z versus leeftijd van het heelal. import numpy as np import matplotlib.pyplot as plt from astropy.cosmology import Planck18 from matplotlib.ticker import ScalarFormatter # Array of redshift values z_values = np.logspace(-2, 4, 1000) # From z=0.01 to z=10,000 # Calculate the age of the universe at each redshift age_values = [Planck18.age(z).value for z in z_values] plt.figure(figsize=(10, 6)) plt.plot(z_values, age_values, 'b-', linewidth=2) plt.xscale('log') plt.xlabel('Redshift (z)', fontsize=12) plt.ylabel('Leeftijd van het heelal (Gyr)', fontsize=12) plt.title('Leeftijd van het heelal als een functie van redshift (z)', fontsize=14) plt.grid(True, which="both", ls="-", alpha=0.2) plt.gca().xaxis.set_major_formatter(ScalarFormatter()) # Mark some important redshifts important_z = [0, 1, 5, 10, 100, 1000] important_ages = [Planck18.age(z).value if z > 0 else Planck18.age(0.001).value for z in important_z] # Annotate the current age of the universe (z=0) plt.scatter([0.01], [Planck18.age(0.01).value], color='red', s=50, zorder=5) plt.annotate(f'Vandaag: {Planck18.age(0).value:.1f} Gyr', xy=(0.01, Planck18.age(0.01).value), xytext=(0.02, Planck18.age(0.01).value - 1), arrowprops=dict(arrowstyle='->')) # Some other interesting cosmic epochs plt.scatter([7.5], [Planck18.age(7.5).value], color='green', s=50, zorder=5) plt.annotate('Eerste sterrenstelsels (~z=7-10)', xy=(7.5, Planck18.age(7.5).value), xytext=(10, Planck18.age(7.5).value + 0.5), arrowprops=dict(arrowstyle='->')) plt.scatter([1100], [Planck18.age(1100).value], color='orange', s=50, zorder=5) plt.annotate('CMB (~z=1100)', xy=(1100, Planck18.age(1100).value), xytext=(500, Planck18.age(1100).value + 0.1), arrowprops=dict(arrowstyle='->')) # Show the plot with tight layout plt.tight_layout() plt.show() # Print a table! print("Redshift (z) | Leeftijd van het heelal (Gyr)") print("-------------------------------") for z in [0, 0.1, 0.5, 1, 2, 5, 10, 50, 100, 1000, 1100]: age = Planck18.age(z).value print(f"{z:11.1f} | {age:6.3f}")
De Zimmerman en Space podcast is gelicenseerd onder een Creative Commons CC0 1.0 licentie. http://creativecommons.org/publicdomain/zero/1.0
Shows are listed from Apple Podcasts' charts and directory, and Podcast Index where it is used. Every show and episode belongs to its publisher and plays from the publisher's own feed; this site hosts none of them. Explicit shows are for adult profiles only, and children’s profiles hear only children’s shows. More about this list.