Opening the book…
Learning Objectives
- State how \(N\) affects the shape of a binomial distribution
Instructions
This demonstration allows you to explore the binomial distribution. Here you can specify the number of trials (\(N\)) and the proportion of successes (\(p\)). Note that the proportion of successes is sometimes referred to with the Greek letter \(p\); here it will be referred to as \(p\).
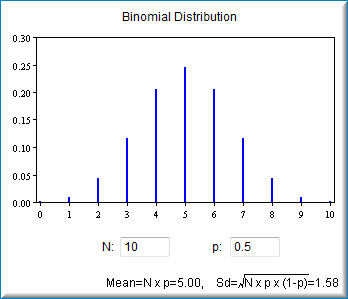
The starting values for \(N\) and \(p\) are \(10\) and \(0.5\). The graph therefore shows the probability of from \(0\) to \(10\) successes out of \(10\) trials. The probability of \(0\) successes is so small that it just barely shows up on the graph. The most likely number of successes is \(5\), which has a probability of about \(0.25\). Naturally, the sum of the probabilities is \(1.0\).
The demonstration also shows the mean and the standard deviation of the binomial distribution.
Illustrated Instructions
The screenshot below shows the binomial demonstration with its default data. You can adjust the number of trials (\(N\)) as well as the proportion of successes (\(p\)).
The example below shows a distribution of \(20\) trials with a probability of success of \(0.7\). Notice that the mean and standard deviation for the distribution are also shown.

This page titled 5.8: Binomial Demonstration was last modified on Sat, 23 Apr 2022 18:23:31 GMT and is shared under a Public Domain license and was authored, remixed, and/or curated by David Lane via source content that was edited to the style and standards of the LibreTexts platform.
The book could not be loaded just now.