Opening the book…
Learning Objectives
- Create and interpret dot plots
- Judge whether a dot plot would be appropriate for a given data set
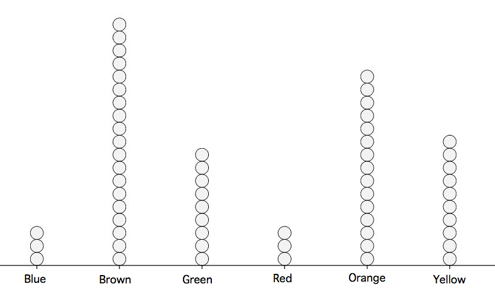
Dot plots can be used to display various types of information. Figure \(\PageIndex{1}\) uses a dot plot to display the number of M & M's of each color found in a bag of M & M's. Each dot represents a single M & M. From the figure, you can see that there were \(3\) blue M & M's, \(19\) brown M & M's, etc.
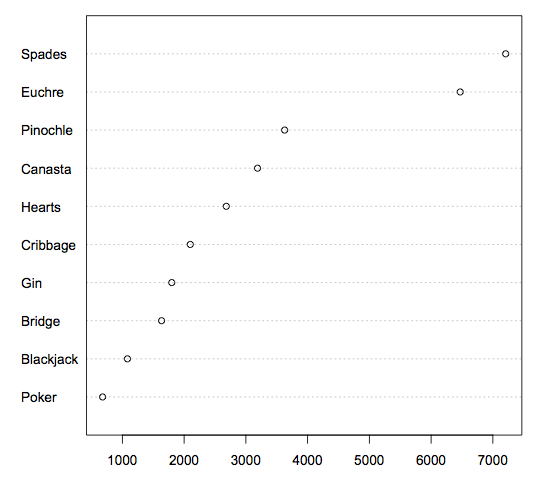
The dot plot in Figure \(\PageIndex{2}\) shows the number of people playing various card games on the Yahoo website on a Wednesday. Unlike Figure \(\PageIndex{1}\), the location rather than the number of dots represents the frequency.
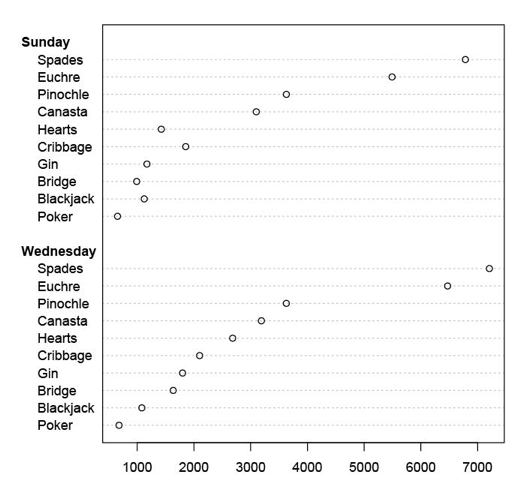
The dot plot in Figure \(\PageIndex{3}\) shows the number of people playing on a Sunday and on a Wednesday. This graph makes it easy to compare the popularity of the games separately for the two days, but does not make it easy to compare the popularity of a given game on the two days.
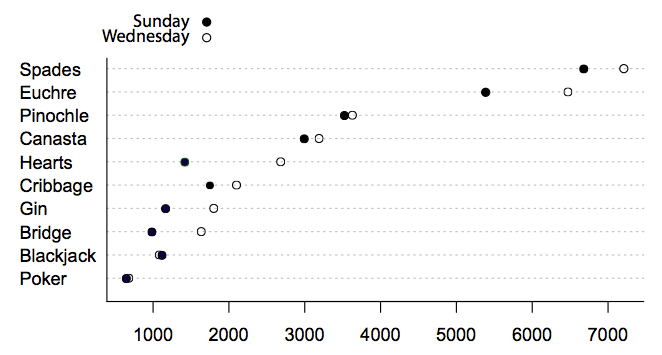
The dot plot in Figure \(\PageIndex{4}\) makes it easy to compare the days of the week for specific games while still portraying differences among games.
This page titled 2.10: Dot Plots was last modified on Sat, 23 Apr 2022 18:23:26 GMT and is shared under a Public Domain license and was authored, remixed, and/or curated by David Lane via source content that was edited to the style and standards of the LibreTexts platform.
The book could not be loaded just now.