Opening the book…
Learning Objectives
- Describe a \(3D\) Plot
- Give an example of the value of a \(3D\) plot
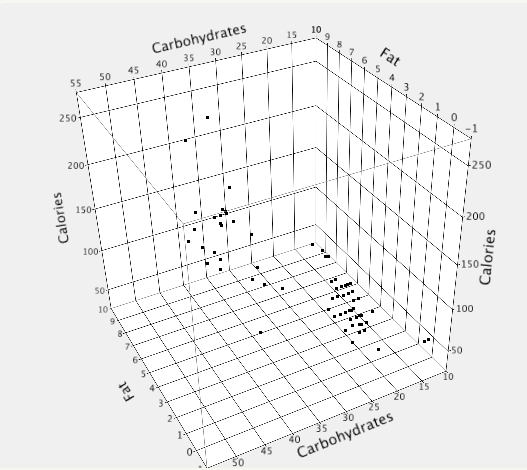
Just as two-dimensional scatter plots show the data in two dimensions, \(3D\) plots show data in three dimensions. Figure \(\PageIndex{1}\) shows a \(3D\) scatter plot of the fat, non-sugar carbohydrates, and calories from a variety of cereal types.
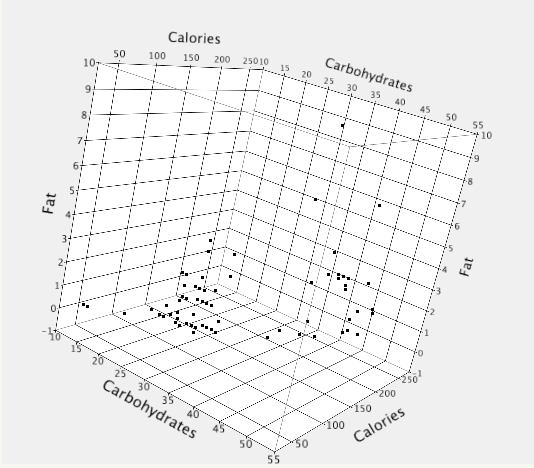
Many statistical packages allow you to rotate the axes interactively to view the data from a different vantage point. Figure \(\PageIndex{2}\) is an example.
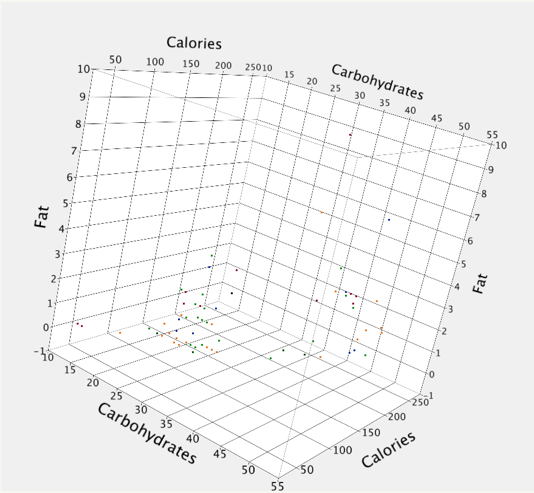
A fourth dimension can be represented as long as it is represented as a nominal variable. Figure \(\PageIndex{3}\) represents the different manufacturers by using different colors.
Interactively rotating \(3D\) plots can sometimes reveal aspects of the data not otherwise apparent. Figure \(\PageIndex{4}\) shows data from a pseudo random number generator. Figure \(\PageIndex{4}\) does not show anything systematic and the random number generator appears to generate data with properties similar to those of true random numbers.
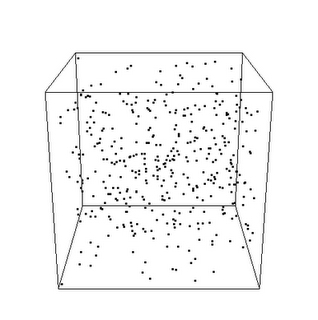
Figure \(\PageIndex{5}\) shows a different perspective on these data. Clearly they were not generated by a random process.
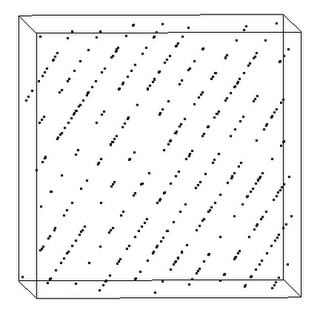
Figures \(\PageIndex{4}\) and \(\PageIndex{5}\) are reproduced with permission from R snippets by Bogumil Kaminski.
This page titled 8.3: 3D Plots was last modified on Sat, 23 Apr 2022 18:23:32 GMT and is shared under a Public Domain license and was authored, remixed, and/or curated by David Lane via source content that was edited to the style and standards of the LibreTexts platform.
The book could not be loaded just now.