Opening the book…
Learning Objectives
- Learn how to estimate Pearson's correlation coefficient by viewing scatter plots
Instructions
This demonstration allows you to learn about Pearson's correlation by viewing scatter plots with different values of Pearson's \(r\). In each case, you will have an opportunity to guess the correlation. With a little practice, you should get pretty good at it.
Illustrated Instructions
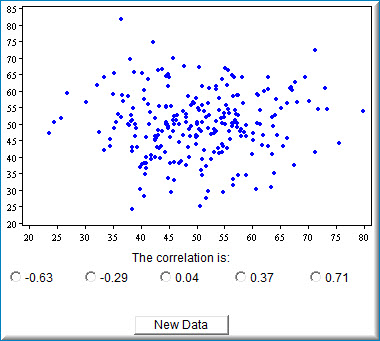
The demonstration begins by displaying a scatterplot (shown below) and you guess what the correlation of the data in the scatterplot is by selecting one of five options below the graph.
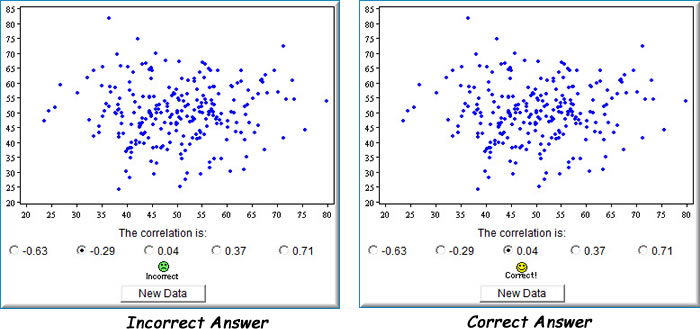
As can be seen in screenshots below, once you select an answer you will be prompted whether the answer is correct or incorrect. Click the "New Data" to get a new dataset.
This page titled 4.3: Guessing Correlations was last modified on Sat, 23 Apr 2022 18:23:25 GMT and is shared under a Public Domain license and was authored, remixed, and/or curated by David Lane via source content that was edited to the style and standards of the LibreTexts platform.
The book could not be loaded just now.