12.3E: Scatter Plots (Exercises)

Introductory Statistics · LibreTexts

0%

Contents

    Text

    Size
    100%
    Theme
    Typeface
    Line length
    Spacing

    Read aloud

    How

    Speed: 1×
    Light up
    Highlight

    Symbols: Mulberry Symbols, © 2018–2026 Steve Lee, CC BY-SA 4.0 (licence, the set), the site's own copies.

    From LibreTexts, under CC BY, as the source states it; its equations are written in TeX, which the PDF shows typeset. This page at LibreTexts.

    12.3E: Scatter Plots (Exercises)
    Exercise \(\PageIndex{1}\)

    Does the scatter plot appear linear? Strong or weak? Positive or negative?
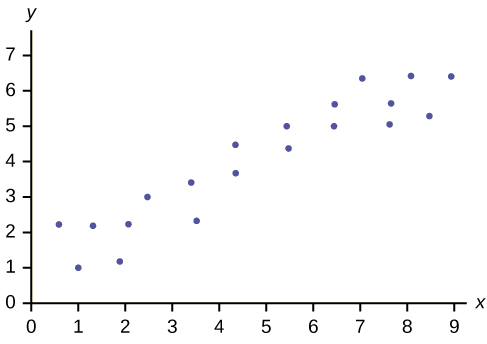
    This is a scatterplot with several points plotted in the first quadrant. The points form a clear pattern, moving upward to the right. The points do not line up , but the overall pattern can be modeled with a line.
    Figure \(\PageIndex{4}\)

    Answer

    The data appear to be linear with a strong, positive correlation.

    Exercise \(\PageIndex{3}\)

    Does the scatter plot appear linear? Strong or weak? Positive or negative?
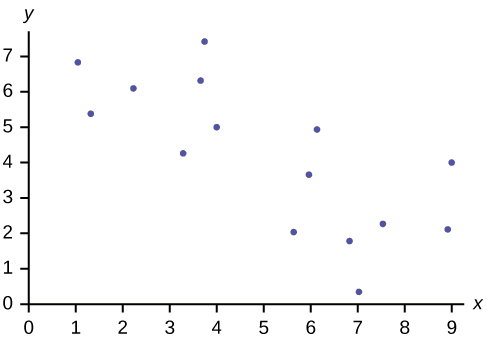
    This is a scatterplot with several points plotted in the first quadrant. The points move downward to the right. The overall pattern can be modeled with a line, but the points are widely scattered.
    Figure \(\PageIndex{5}\)
    Exercise \(\PageIndex{4}\)

    Does the scatter plot appear linear? Strong or weak? Positive or negative?
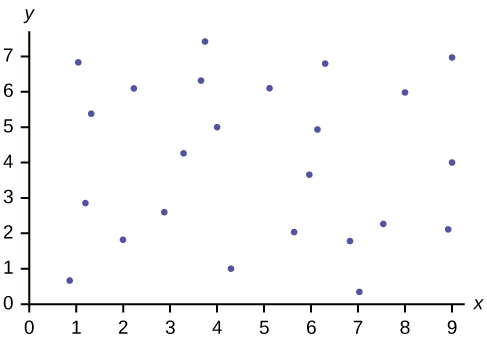
    This is a scatter plot with several points plotted all over the first quadrant. There is no pattern.
    Figure \(\PageIndex{6}\)

    Answer

    The data appear to have no correlation.


    12.3E: Scatter Plots (Exercises) is shared under a CC BY license and was authored, remixed, and/or curated by LibreTexts.