Opening the book…
What you’ll learn to do: Describe the sampling distribution for sample proportions and use it to identify unusual (and more common) sample results.
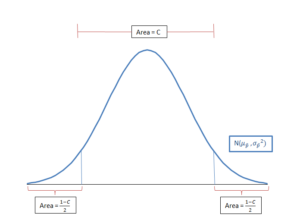
When we have real-world quantitative data, we use the distribution of sample proportions to explore and understand our results. In this section, we will learn statistical properties of sample proportion. In particular, for large enough samples under certain conditions, we will see the shape of the sample proportions (i.e. the Distribution of Sample Proportions) is roughly normal. We will use this to our advantage in constructing confidence intervals as well as estimating probabilities of certain events occurring, based on our results from the study data.
Contributors and Attributions
- Concepts in Statistics. Provided by: Open Learning Initiative. Located at: http://oli.cmu.edu. License: CC BY: Attribution
This page titled 7.2: Introduction to Distribution of Sample Proportions was last modified on Mon, 07 Dec 2020 07:05:10 GMT and is shared under a CC BY 4.0 license and was authored, remixed, and/or curated by Lumen Learning.
The book could not be loaded just now.