Opening the book…
What you’ll learn to do: Conduct a hypothesis test for a population proportion.
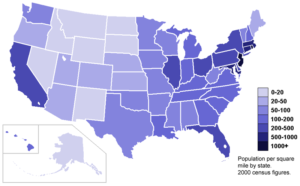 When we have real world data on population proportions we will have to learn when a situation calls for testing a hypothesis about a population proportion, conduct a hypothesis test and state a conclusion in context. We will interpret the P-value as a conditional probability in the context of a hypothesis test. We will then distinguish the difference between statistical significance from practical importance.
Contributors and Attributions
CC licensed content, Shared previously
- Concepts in Statistics. Provided by: Open Learning Initiative. Located at: http://oli.cmu.edu. License: CC BY: Attribution
This page titled 8.12: Introduction to Hypothesis Test for a Population Proportion was last modified on Mon, 07 Dec 2020 07:05:25 GMT and is shared under a CC BY 4.0 license and was authored, remixed, and/or curated by Lumen Learning.
The book could not be loaded just now.