Opening the book…
Recall that aggregate demand (AD) represents the total spending on a country’s goods and services at various price levels. It is composed of four major categories:
\[A D=C+I+G+N X \nonumber \]
Where:
-
C is consumption
-
I is investment
-
G is government spending
-
NX is net exports (exports minus imports).
Among these components, consumption (C) is by far the largest in the U.S. economy, typically accounting for around 68% of total demand. This is why, up to this point, we have focused so heavily on understanding the consumption function (because changes in consumption can significantly influence aggregate demand overall).
The consumption function (\(C = a + bY_D\)) helps us explore the factors that influence household spending. Here, “a” represents autonomous consumption (the amount people spend even with zero income), and “b” is the marginal propensity to consume (MPC), indicating how much consumption changes with a change in income YD.
When there is an upward shift in the consumption function, it means that at every income level, households are now consuming more than before. This shift might be caused by increased consumer confidence, higher wealth levels, favorable credit conditions, or lower taxes.
An upward shift in the consumption function leads to a rightward shift in the aggregate demand curve. See figure 16. This is because, with consumption increasing at each income level, total spending in the economy increases. Since aggregate demand represents the total quantity of goods and services demanded at different price levels, more consumption directly translates into higher aggregate demand.
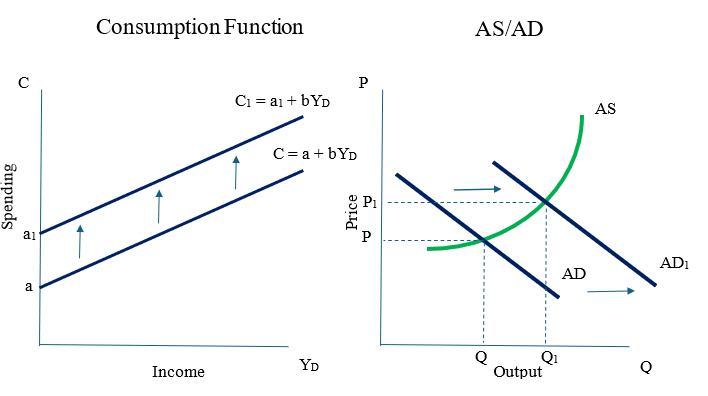
Figure 16
In summary, the consumption function is a microeconomic lens through which we can analyze changes in the largest component of aggregate demand. When it shifts upward, it signals increased household spending across the board, and this results in a larger macroeconomic effect: a rightward shift in the AD curve, which can stimulate economic growth (especially when the economy is operating below full capacity).
This page titled 9.7: Shifts in the Consumption Function vs Shifts in Aggregate Demand was last modified on Mon, 13 Oct 2025 18:23:41 GMT and is shared under a CC BY-NC-SA 4.0 license and was authored, remixed, and/or curated by Martin Medeiros.
The book could not be loaded just now.