Opening the book…
The skin is an electrical organ, and it produces slow drifts in voltage that are picked up by our EEG electrodes. These skin potentials can cause the voltage to gradually drift upward or downward by hundreds of microvolts over a period of a few minutes. To get a better look at these voltage drifts:
- Go to time zero by putting a zero in the text box between the -X and +X buttons under the plotting region (and hit Enter/Return)
- Set the Vertical Scale to 200 and the Time Range to 400 seconds in the Plot Settings panel (and click Apply)
- Note that this EEGset is 397 seconds long, and eStudio will automatically adjust the Time Range from 400 to 397
The result should look like Screenshot 2.4. Looks pretty weird, doesn’t it? The first thing you should look at is the event codes (the vertical lines). The N400 experiment lasted about 6 minutes, and you’re looking at the entire recording, so there are lots of event codes. Notice that there are 6 clusters of event codes, separated by gaps of approximately 7 seconds. Participants can maintain their attention better if the experiment is divided into a large number of short blocks, each followed by a brief break, so this experiment was broken up into short blocks that lasted only about a minute each. Specifically, the 120 trials in this experiment were divided into 6 blocks of 20 trials each, with a short rest break after each block.

Screenshot 2.4
The event codes make it hard to see the EEG on this time scale, so disable them by unchecking Show events in the Plot Settings panel (and click Apply).
Now take a look at the EEG waveforms. You can now see that the voltage is gradually drifting over time. It drifts upward in some channels and downward in others. Most of the channels change by well over 100 µV over the course of this 400-second period. These drifts are mainly caused by electrical potentials in the skin that are picked up by the EEG electrodes (see Chapter 5 in Luck, 2014 for more details).

Screenshot 2.5
Filtering Out the Low-Frequency Drifts with a High-Pass Filter
These drifts can make it difficult to obtain reliable ERP differences across conditions, and it’s usually a good idea to filter them out with a high-pass filter, which filters out low frequencies and passes high frequencies. To accomplish this, go to the Filtering panel and set it up as shown in Screenshot 2.5. This will apply a high-pass filter with a half-amplitude cutoff at 0.1 Hz and a roll-off of 12 dB/octave, which is a good general-purpose filter for most studies of cognitive and affective processes. If you don’t know what these parameters mean, don’t worry – we’ll cover them in Chapter 4. You can also find a broad conceptual overview of filters in Chapter 7 of Luck (2014) and a more detailed mathematical treatment in Chapter 12 of Luck (2014). Zhang et al. (2024) provide a list of optimal filter settings for each of the 7 ERP components in the ERP CORE.
Click the Run button in the Filtering panel to run the filter and save the result in a new EEGset. You should see a new window like the one shown in Screenshot 2.6, which will allow you to name the new EEGset. In EEGLAB and ERPLAB Studio, most operations that modify an EEGset will actually create a new EEGset. That way, if you make a mistake or change your mind, you can easily go back to the previous EEGset. The EEGsets are stored in memory, where they’re listed in the EEGsets panel. You can also save them to your hard drive if you want.
ERPLAB Studio will suggest a name for each new EEGset that you create, typically adding a suffix to the end of the previous EEGset name. As you can see in Screenshot 2.6, it suggests adding a suffix of _filt to the previous EEGset name, resulting in a new name of 6_N400_preprocessed_filt. You can use any name you like, but it's quick and easy to use eStudio's suggested name, and that way you will automatically have a consistent naming scheme.
We're going to need the filtered EEGset for a later exercise, so you should save it to disk by checking the Save EEGsets to disk box. The name of the EEGset in memory doesn’t have to be the same as the filename, but it can be confusing if the name in memory is different from the filename. You can automatically make the names identical by clicking the Use EEG name as filename box.
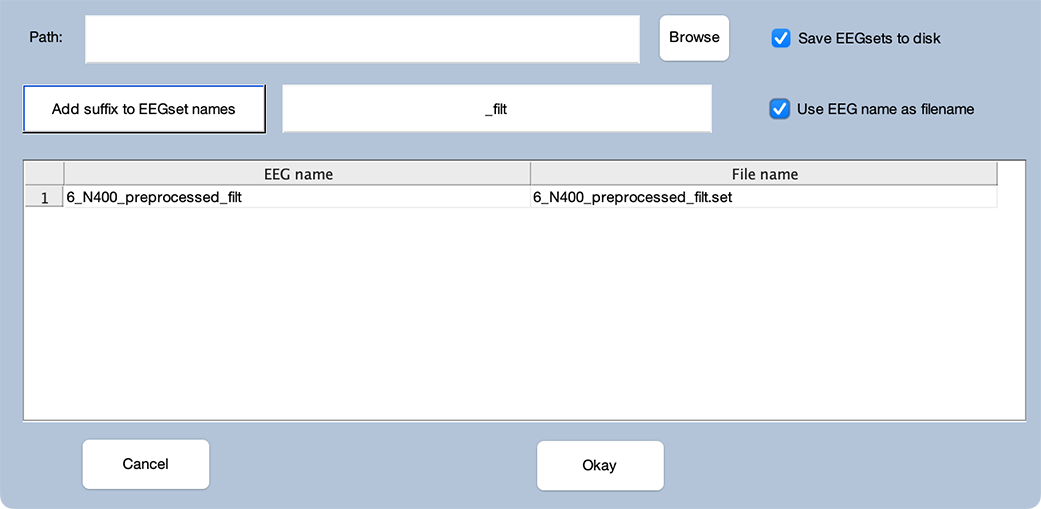
Screenshot 2.6
Once you have everything set up as shown in Screenshot 2.6, click Okay. You’ve now created a new EEGset with the filtered data and saved it to the current folder of your disk. If you look in the EEGsets panel, you should see both the original EEGset (6_N400_preprocessed) and the new EEGset (6_N400_preprocessed_filt), with the new one selected. And the plotting region will show the filtered EEGset, as shown in Screenshot 2.7.
Getting an Error Message?
Did you get an error message when you launched the filtering tool? If so, the message probably said that you're missing the Signal Processing Toolbox. This toolbox comes from the makers of Matlab and is required for certain ERPLAB processes, such as filtering. Depending on your institution's Matlab license, it may be free or it may require an extra fee.
You can see what toolboxes are installed by typing ver on the Matlab command line. If you don't have the Signal Processing Toolbox and you don't know how to get it and/or install it, contact your institution's IT support department for assistance.

Screenshot 2.7
Looking at the Filtered Data
As you can see in Screenshot 2.7, the slow drifts are now gone, and the data look much more orderly. We’ve now gotten rid of a major source of artifactual activity from the EEG, which improves our ability to obtain robust, reliable ERP effects.
Now change the time period to display to be 10 seconds instead of 400 seconds in the Time Range box in the Plot Settings panel. Because you’re still removing the DC offset and the drifts are slow, the filtered and unfiltered data don’t look as radically different with this 10-second time scale as they did with the 400-second time scale. But if you go back and forth between selecting 6_N400_preprocessed and 6_N400_preprocessed_filt in the EEGsets panel, you’ll see that there is some drift in the unfiltered data that is absent in the filtered data (especially in Channel 10, which is the PO3 channel). You can also see that the faster deflections in the data are largely identical in the filtered and unfiltered EEGsets. So, the high-pass filter has largely eliminated the slow drifts but has had minimal effect on the other features of the EEG. We’ll take a closer look at filters in Chapter 4.
You’ll need the filtered dataset for the next exercise, so leave eStudio in its current state if possible. Also, you should reset the plotting parameters back to their defaults, which you can do via the Reset button under the lower right corner of the plotting regions.
This page titled 2.4: Exercise- Filtering Out Low-Frequency Drifts from the EEG was last modified on Thu, 01 Oct 2026 18:52:40 GMT and is shared under a CC BY-NC 4.0 license and was authored, remixed, and/or curated by Steven J Luck directly on the LibreTexts platform.
The book could not be loaded just now.