Opening the book…
1. Seasons
1.5.1 Solar Brightness and Light Angle

Five light beam examples A–E showing different light angles and illuminated areas on a surface.
Image Credit: Astronomy Interactives from the Astronomy Education Department at the University of Nebraska-Lincoln (https://astro.unl.edu/interactives/)
- Give each lettered example a ranking for: Brightness (1 is brightest), illuminated area (1 is greatest), and angle between light and paper (1 is greatest angle).
| Example | Brightness | Illuminated Area | Angle |
|---|---|---|---|
| A | |||
| B | |||
| C | |||
| D |
- Summarize the patterns you saw above: How does the angle between the ground and a line from the Earth to the sun affect how bright sunlight is on that part of the ground?
1.5.2 Light Angle and Earth Position

Earth diagram with equal light cutouts showing how sunlight spreads across different latitudes.
Image Credit: Astronomy Interactives from the Astronomy Education Department at the University of Nebraska-Lincoln (https://astro.unl.edu/interactives/)
- Examine the area cutouts: How do the areas compare? Based on your response and the patterns in the previous model, how should the amount of light in each cutout compare?
- Examine the portions of the Earth that receive light from each cutout: How do the areas along the Earth compare? Based on your response and the patterns in the previous model, how should the brightness of light on each portion of the Earth compare?
- Summarize: What parts of the Earth receive the most light? What parts of the Earth receive the least light?
- Interpret: What parts of the Earth are warmer? What parts of the Earth do you think are colder? Justify your responses with the patterns you identified in the previous questions.
1.5.3 Seasonal Daylight
Model

Tilted Earth model with latitudes A–E showing daylight and nighttime portions of rotation paths.
Image Credit: Astronomy Interactives from the Astronomy Education Department at the University of Nebraska-Lincoln (https://astro.unl.edu/interactives/)
- Each letter represents a latitude. For the time of the year shown, estimate the percentage of time that position is in daylight and night, based on the fraction of the dashed line that is on the illuminated and dark portions of the Earth model.
| Latitude | Daylight % | Night % |
|---|---|---|
| A | ||
| B | ||
| C | ||
| D | ||
| E |
- Which portion of the Earth (top or bottom) is tilted more towards the sun?
- For the part of the Earth (top or bottom) that you identified in the previous question, do latitudes near that point experience more daylight or more night?
- Which part of the Earth (top or bottom) do you think spends more time heating up during a 24-hour period? Explain your reasoning.
- Which part of the Earth (top or bottom) do you think is experiencing summer? Explain your reasoning.
1.5.4 Light Angle and Earth Position
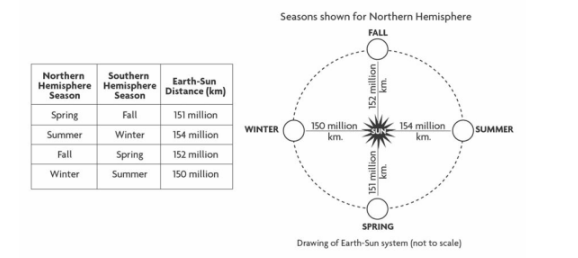
Earth orbit diagram showing seasonal positions and varying Earth–Sun distances.
Image Credit: Astronomy Interactives from the Astronomy Education Department at the University of Nebraska-Lincoln (https://astro.unl.edu/interactives/)
- Would you expect the Earth to be warmer when it is closer or farther from the sun? Explain your thinking.
- During which season is the Earth closest to the sun? Is that a warm or cold season?
- During which season is the Earth farthest from the sun? Is that a warm or cold season?
- Do you think the distance between the Earth and the sun causes the seasons? Explain your reasoning using evidence from this model.
- Consider this student conversation and identify whether you agree or disagree with each student:
Student A: The distance between the Earth and the sun cannot be the cause of the seasons because the Earth is 4 million kilometers closer to the sun in the winter, when it is colder. That doesn’t make sense because being closer should make the Earth warmer. The cause of the seasons must be related to the tilt of the Earth, not the distance between the Earth and the sun.
Student B: I agree that the tilt is what causes the seasons, but I think it is related to distance. When the Northern Hemisphere of the Earth is tilted towards the sun, it is closer to the sun than the Southern Hemisphere. So distance does play a part.
Student C: I disagree. The Northern Hemisphere might be closer to the sun than the Southern Hemisphere when it is summer in the Northern Hemisphere, but the whole planet is farther away. So it must be the way the tilt affects how the light reaches us, not the change in distance caused by the tilt.
Summary
Explain how each of the following do or do not affect the seasons:
- Distance between Earth and Sun
- Sunlight Angle
- Amount of Daylight Hours
Application
Imagine a person is at the “X” on each figure. Rank the different examples in terms of: Hours of daylight and sun angle. Then rank them in terms of greatest daytime temperature.

Multiple Earth diagrams with person marked X for comparing daylight, sun angle, and temperature.
Image Credit: Astronomy Interactives from the Astronomy Education Department at the University of Nebraska-Lincoln (https://astro.unl.edu/interactives/)
| Example | Hours of Daylight Rank | Sun Angle Rank | Greatest Daytime Temperature Rank |
|---|---|---|---|
| A | |||
| B | |||
| C | |||
| D | |||
| E |
This page titled 1.5: The Reason for the Seasons was last modified on Tue, 06 Oct 2026 22:47:21 GMT and is shared under a CC BY 4.0 license and was authored, remixed, and/or curated by Andrew Totah-McCarty.
The book could not be loaded just now.