Opening the book…
2.4 Applying the Energy Conservation Model
2.4.1 Throwing a Ball to Maximum Height
Model
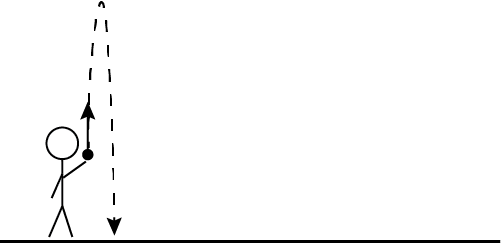
With your new knowledge of energy, you wonder if you can determine how high you can throw a ball. Let's say you can throw a ball upward with a speed of 15 m/s. How high will it go before it starts to fall back down? Assume the ball is 1.5 meters above the ground just after it leaves your hand.

\[ \Delta E_{system}=Q+W \]
Explore
- What indicator values are given in the prompt?
- What qualitative description represents the moment on the timeline for those indicators? Place a dot labeled i for initial and f for final to represent the physical location of the ball at the beginning and end of this timeline.
- What is the unknown that you are trying to determine?
- Tell a Physical Story for this scenario as a few sentences:
- This timeline starts when the ball...
- The initial speed is __________ and the initial height is __________.
- Over this timeline, the height of the ball __________ and the speed of the ball __________.
- This timeline ends when the ball reaches __________ and the speed of the ball is __________.
Critical Thinking & Concept Invention
- What do you think the speed of the ball is just as it reaches its maximum height? Check that this makes sense to everyone in the group.
- At the maximum height, the ball switches from going up to going down. We often call this a turnaround point. What is the speed of an object at a turnaround point?
At a turnaround point, the speed of an object is __________. - Construct a Timeline using the information from the previous questions. Then, construct an Energy Interaction Diagram and a corresponding Energy Equation. Solve the equation for the maximum height.
Apply
Use the same process as before, but solve for the speed of the ball when it is 10 meters above the ground on the way up and 10 meters above the ground on the way down. Mark these points on the diagram below (not fully to scale) to show the different final states for each timeline.
\[ \Delta E_{system}=Q+W \]
2.4.2 Horizontal Spring
Model
A cart is attached to a spring (\(k=10\text{ J/m}^2\)) and is able to move side to side on a horizontal tabletop. The cart is initially not moving and the spring is at its natural length. Then, the cart is pulled 35 cm to the right, causing the spring to stretch. Then the cart is released from rest. How fast will the cart be moving when it is 20 cm to the left of where it started (i.e., the spring is compressed 20 cm)?

Explore
- How many different positions is the spring and cart shown in the Physical Scenario Diagram?
- What is the value for the indicator for Elastic Potential Energy in this scenario at:
- Time A: __________
- Time B: __________
- Time C: __________
- What do these indicator values measure?
These values measure __________. - What other indicator do you know the value for at some (possibly not all) times? What is the unknown that you will need to solve for?
We know the value of __________ at times __________.
We need to determine the value of __________.
Critical Thinking & Concept Invention
- Why do you think there are three positions of the spring and cart shown in the Physical Scenario Diagram?
- What does the vertical dashed line represent? Why is it important to show this across the different images of the spring position?
- Explain what the indicator for Elastic Potential Energy is and how to model it on a Physical Scenario Diagram.
- Create two sets of models, one for the timeline from A to B and one from the timeline B to C. Create equations for each model and solve for any unknown variables:
B to C

\[ \Delta E_{system}=Q+W \]
A to B
\[ \Delta E_{system}=Q+W \]
Apply
A spring (\(k=5\text{ J/m}^2\)) with a natural length of 20 cm hangs vertically above the ground. A 200 gram mass is connected to the end of the spring and then released. Identify how far down it will fall before the spring pulls it back up (i.e., find the lower turnaround point). To do this, draw a Physical Scenario Diagram, make a timeline with relevant indicators identified, construct an Energy Interaction Diagram to show the energies that change in this process, and construct an Energy Equation that is consistent with the EID and timeline.
Physical Scenario Diagram
\[ \Delta E_{system}=Q+W \]
2.4.3 Equal Masses on a Pulley
Model
Two blocks with the same mass (\(M\)) are connected by a string that crosses over a pulley that is free to rotate. Assume the pulley has no mass. The two blocks are initially held in the position shown below and are then released.

\[ \Delta E_{system}=Q+W \]
Explore
- Identify how the following quantities and indicators compare for each block before they are released. Respond "Left Block", "Right Block", or "The same for each block":
- Which block has more mass?
- Which block has a greater speed?
- Which block is at a greater height?
- Identify how the following energies compare for each block before they are released. Respond "Left Block", "Right Block", or "The same for each block":
- Which block has more gravitational potential energy?
- Which block has more kinetic energy?
- What do you think will happen to the blocks when they are released?
Critical Thinking & Concept Invention
- Record a tally of everyone's responses to what will happen to the blocks when released. Discuss any disagreements, then draw the blocks on the diagram for the final moment on the timeline as they will appear a few seconds later, based on what you said would happen. If the blocks are moving, draw arrows to indicate their direction. If not, write \(v=0\) next to the block.
- Fill in a timeline for these blocks that aligns with your drawing. For indicators, you can provide qualitative descriptions (e.g., "faster/slower" or "higher/lower"). Then construct an Energy Interaction Diagram and Energy Equation with +/− symbols. You do not need to solve the energy equation.
- Does your EID and equation make sense? Is the final state that you modeled possible or does it violate energy conservation? Explain.
2.4.4 Unequal Masses on a Pulley
Model
Two blocks with different masses (\(M\) and \(2M\)) are connected by a string that crosses over a pulley that is free to rotate. Assume the pulley has no mass. The two blocks are initially held in the position shown below and are then released.

\[ \Delta E_{system}=Q+W \]
Explore
- Identify how the following quantities and indicators compare for each block before they are released. Respond "Left Block", "Right Block", or "The same for each block":
- Which block has more mass?
- Which block has a greater speed?
- Which block is at a greater height?
- Identify how the following energies compare for each block before they are released. Respond "Left Block", "Right Block", or "The same for each block":
- Which block has more gravitational potential energy?
- Which block has kinetic energy?
Critical Thinking & Concept Invention
- What do you think will happen to the blocks when they are released? Explain your thinking and draw the blocks on the diagram for the final moment on the timeline as they will appear a few seconds later. If the blocks are moving, draw arrows to indicate their direction. If not, write \(v=0\) next to the block.
- Your instructor will assign your group a possible final state of the system. Fill in a timeline for these blocks that aligns with that assignment. For indicators, you can provide qualitative descriptions (e.g., "faster/slower" or "higher/lower"). Then construct an Energy Interaction Diagram and Energy Equation with +/− symbols. You do not need to solve the energy equation.
- Does your EID and equation make sense? Is the final state that you modeled possible or does it violate energy conservation? Explain.
2.4.5 Rotational Energy
Model
A ball travels down a ramp, starting from rest at the top of the ramp. Consider two different ways this could happen: The ball could slide down the ramp without rolling/spinning OR the ball could roll down the ramp.

Explore
- Tell a physical story about each scenario. Be sure to list how the object(s) change (motion, height, etc.).
| Ball Slides Down Ramp | Ball Rolls Down Ramp |
|---|---|
|
|
- Identify the energies that increase/decrease when the ball slides down the ramp:
- Increase:
- Decrease:
- Identify the energies that increase/decrease when the ball rolls down the ramp:
- Increase:
- Decrease:
Critical Thinking & Concept Invention
- How do you think the final speed (\(v_f\)) of the ball that slides will compare to the ball that rolls? Explain your thinking.
- Model both types of motion as a closed energy system. Construct an Object Interaction Diagram, an Energy Interaction Diagram, and an Energy Equation for each. You do not need to solve the equation.
Sliding
\[ \Delta E_{system}=Q+W \]
Rolling
\[ \Delta E_{system}=Q+W \]
- Use your EID Model and Energy Equation to revisit Question 1. How will the final speeds of the ball compare in each scenario? Construct a CER response:
Claim: The final speed of the ball that slides will be __________ than the final speed of the ball that rolls.
Evidence:
Reasoning:
Summary
Translational Kinetic Energy
\[ K_{trans}= \]
\[ \Delta K_{trans}= \]
Rotational Kinetic Energy
\[ K_{rot}= \]
\[ \Delta K_{rot}= \]
We can assume a moving/spinning object does not have either type of kinetic energy if __________________ is zero (or really small compared to other objects).
Apply
Let's revisit the unequal masses on a pulley from earlier in this activity. This time, we will assume the pulley is a disk with mass \(3M\), which means it can have rotational kinetic energy. Make a new EID for this scenario, then describe how the motion will be different than when the pulley had no mass.
Pulley with Unequal Masses
\[ \Delta E_{system}=Q+W \]
This page titled 2.4: Applying the Energy Conservation Model was last modified on Tue, 20 Oct 2026 21:54:28 GMT and is shared under a CC BY 4.0 license and was authored, remixed, and/or curated by Andrew Totah-McCarty.
The book could not be loaded just now.