Opening the book…
Ex. A: Read this graph. Use the 5-step approach. Then answer the questions.
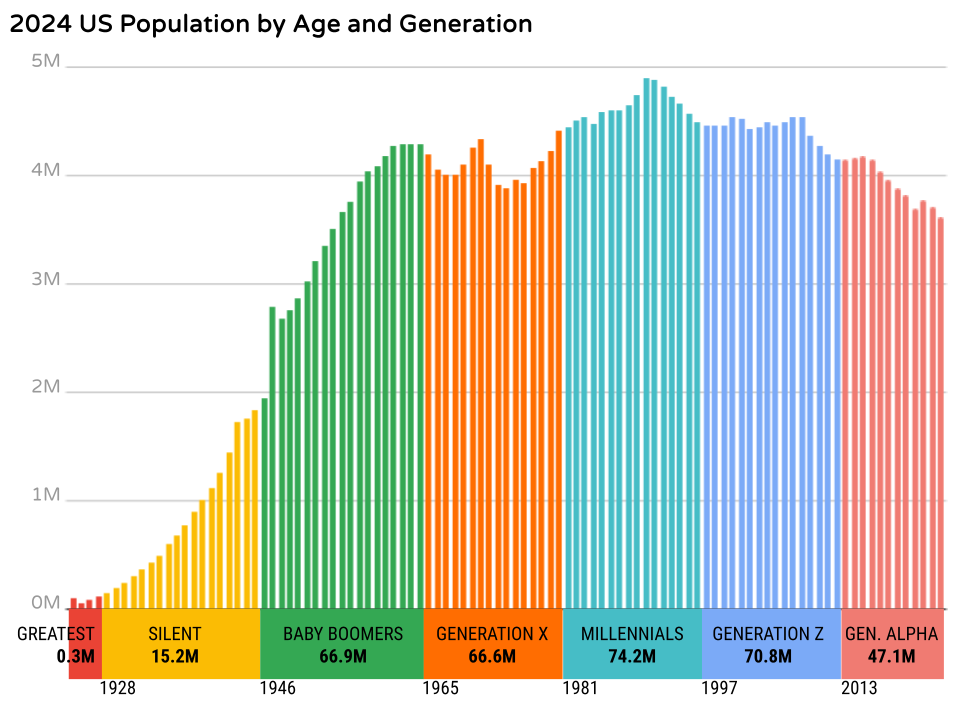
Graph from Meador Manor blog of July 10, 2025,

Ex. B: Discuss these questions with your group.
- What type of graph is this?
- What is a generation? What types of information does this graph give you about generations?
- What is the source of the data shown in this graph? Is it a reliable source of data?
- Where does the graph itself come from? What is the source?
- What information is shown on the Y axis (vertical)? On the X axis (horizontal)?
- How long are generations–more or less?
- Which generation is the largest? Which generation is the smallest? Why?
- Why do you think the Gen. Alpha generation is smaller than the other recent generations?
- What trend can you observe when you look at the Baby Boomers? Gen. Alpha?
- Which generation do you or your family members belong to?
- Do you have the same kind of generation names in the country you came from?
This page titled 4.7: Reading Graphs 1- 2024 U.S. Population was last modified on Fri, 13 Nov 2026 23:09:25 GMT and is shared under a CC BY-NC-SA license and was authored, remixed, and/or curated by Luciana Diniz, Jennifer Snyder, Sarah Bailie and Sarah Barrett.
The book could not be loaded just now.