Opening the book…

High resolution surface map (Public Domain).
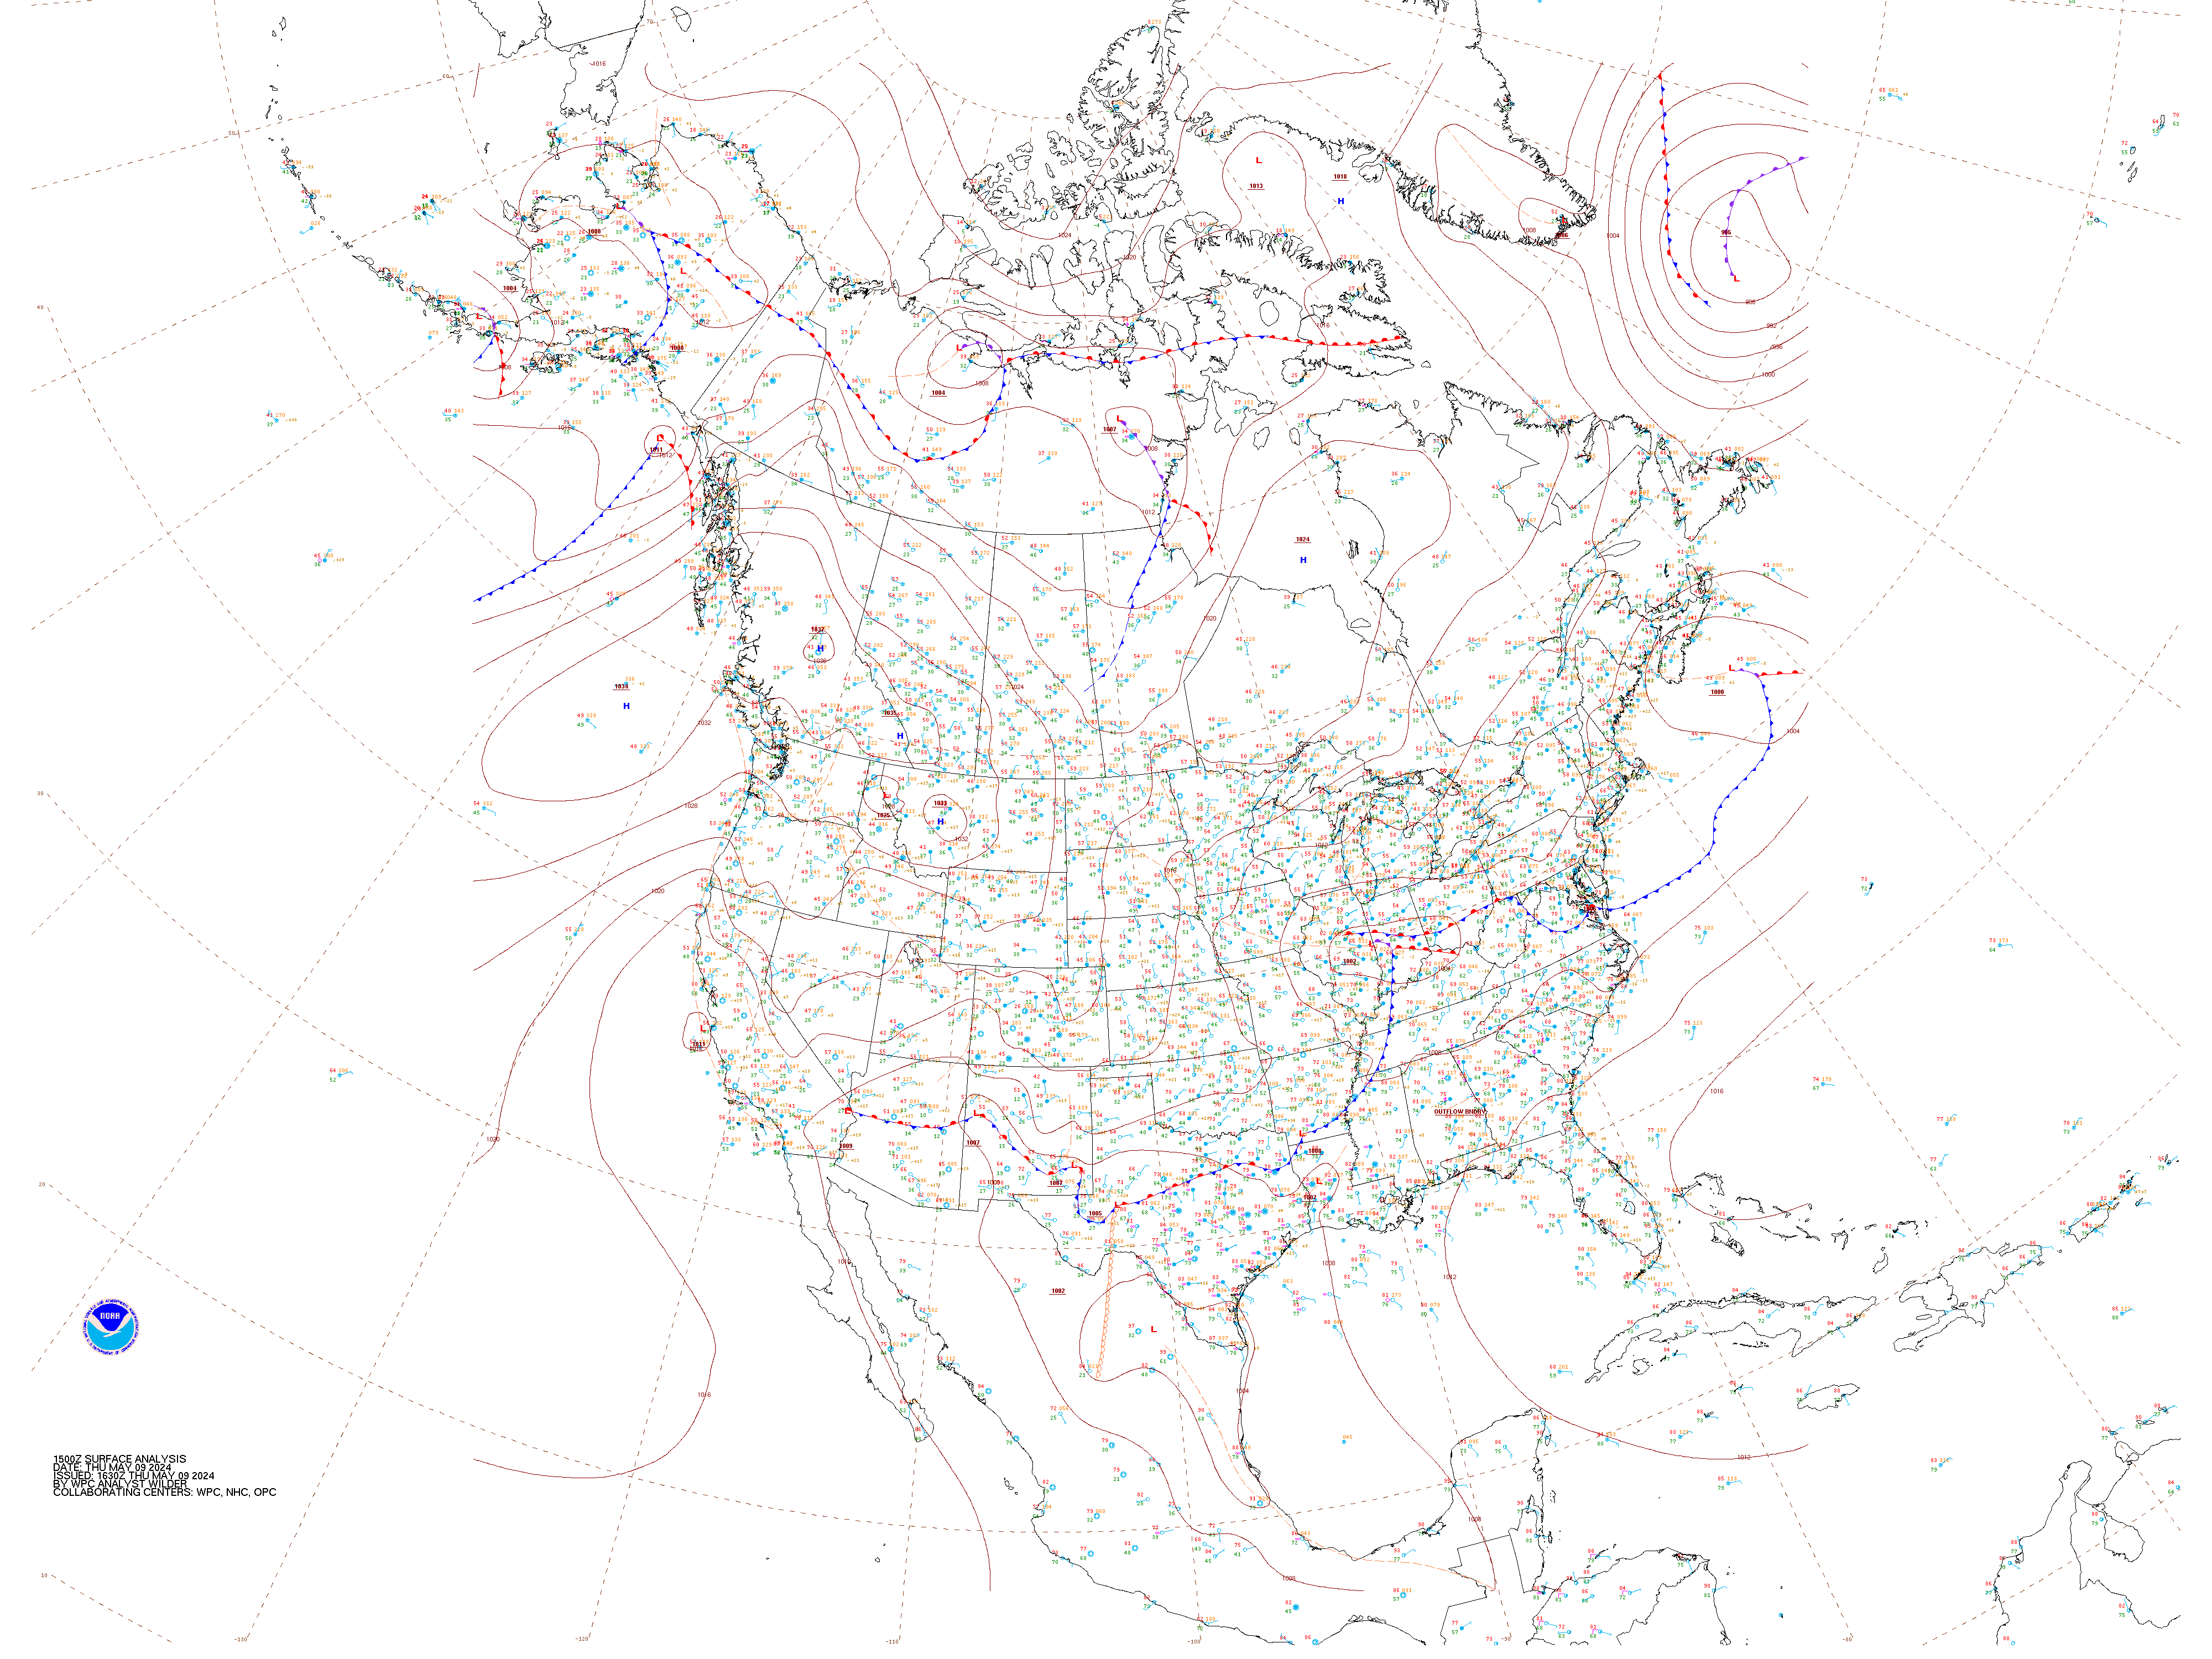
Weather encompasses the state of the atmosphere at any given time, and it is in a constant state of change. Temperature, pressure, humidity, wind, precipitation, cloud cover, visibility—this type of data is constantly being collected around the globe, both at the surface and aloft in the upper atmosphere. How is this data collected and where does it come from? How is it shown on a map? What is the purpose of plotting weather conditions on a map if they are changing all the time? This chapter serves as a brief introduction to surface synoptic weather maps and interpreting the data plotted on them. Simplified weather charts are used frequently on TV, showing locations of high and low pressure systems, fronts, and storm systems. You’re likely familiar with this material already, just from your day to day experiences.
8.1: Introduction is shared under a CC BY-SA 4.0 license and was authored, remixed, and/or curated by LibreTexts.
The book could not be loaded just now.