Opening the book…
By Carey A. Smith
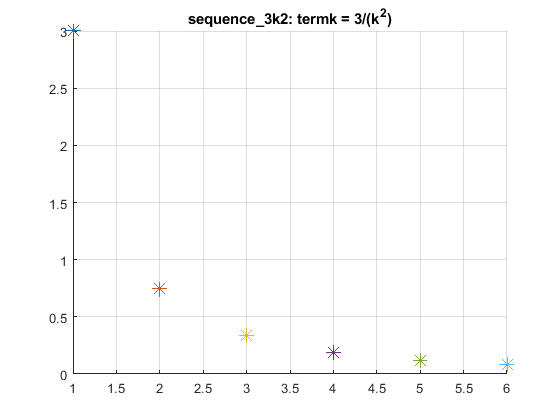
This example computes a sequence with terms = 3/(k^2)
clear all; close all; format compact; clc;
% Octave needs graphics toolkit to plot graph.
graphics_toolkit("fltk") % Do not use with MATLAB
figure; % Open a figure
hold on; % Plot all points on this figure
grid on;
n = 6 % The number of terms in the sequence
for k=1:n
termk = 3/(k^2)
plot(k,termk,'*','MarkerSize',10)
end
title('sequence\_3k2: termk = 3/(k^2)')
Solution
Fibonacci #2
Leonardo Fibonacci was an Italian mathematician, who lived around 1200 AD. He traveled to Arab countries and learned about Arab and Hindu progress in math and algebra. He popularized the Hindu–Arabic numeral system in the Western world.Hindu–Arabic numeral system(opens in new window) [en.Wikipedia.org] It is much better for arithmetic and algebra than Roman numerals. This enabled the math and science advances of the Renaissance. He is most famous for his "Fibonacci sequence".
The first terms in Fibonacci sequence are:
0, 1, 1, 2, 3, 5, 8, 13, ...
Each term successive is the sum of the 2 preceding terms.
Examples:
2+3 = 5
3+5 = 8
(1 pt) Create a MATLAB/Octave m-file script named "Fibonacci_2_YourName.m" (Replace YourName with your own name.)
(1 pt) Put these lines of code at the beginning of your file:
% Compute a Fibonacci sequence with a for loop

% Clear any variables; close any figures; eliminate white space; clear the console:

clear all; close all; format compact; clc;
% Octave needs graphics toolkit to plot graph.

graphics_toolkit("fltk") % Do not use with MATLAB
figure; % Open a figure window.

hold on; % Allow multiple points to be plotted on the same figure.

grid on; % Draw horizontal and vertical grid lines on the plot.
(2 pts) Initialize and plot the 1st 2 terms with this code:
a = 0 % 1st number in the sequence

plot(1,a,'bo')

b = 1 % 2nd number in the sequence

plot(2,b,'bo')
(2 pts) Write a for loop. Let k = the for-loop iteration number. k goes from 3 to 12
(2 pts) Inside the for loop, calculate and plot the next term with this code:
c = a+b

plot(k,c,'bo')
(2 pts) Then update a and b to be the current last 2 terms, in order to be ready for the next iteration. This is similar to the bike example.
a = b; % Update a for the next iteration. (Use a semicolon so that this line does not display.)

b = c; % Update a for the next iteration. (Use a semicolon so that this line does not display.)
- Answer
-
Add texts here. Do not delete this text first.
This page titled 3.6.1: Sequences Additional Material was last modified on Sat, 16 Sep 2023 02:41:07 GMT and is shared under a CC BY-NC-SA 4.0 license and was authored, remixed, and/or curated by Carey Smith.
The book could not be loaded just now.