Opening the book…
The Ellingham diagram plots1 the standard free energy of a reaction as a function of temperature. Originally the values were plotted for oxidation and sulphidation reactions for a series of metals, relevant to the extraction of metals from their ores (extraction metallurgy). These reactions generally involve the reaction of a gaseous phase (the oxidising gas) with (almost) pure condensed phases (the metal and oxidised compounds).
By using the diagram the standard free energy change for any included reaction can be found at any temperature. Along with allowing you to calculate the equilibrium composition of the system, the data on the diagram is useful in other ways, as we shall see.
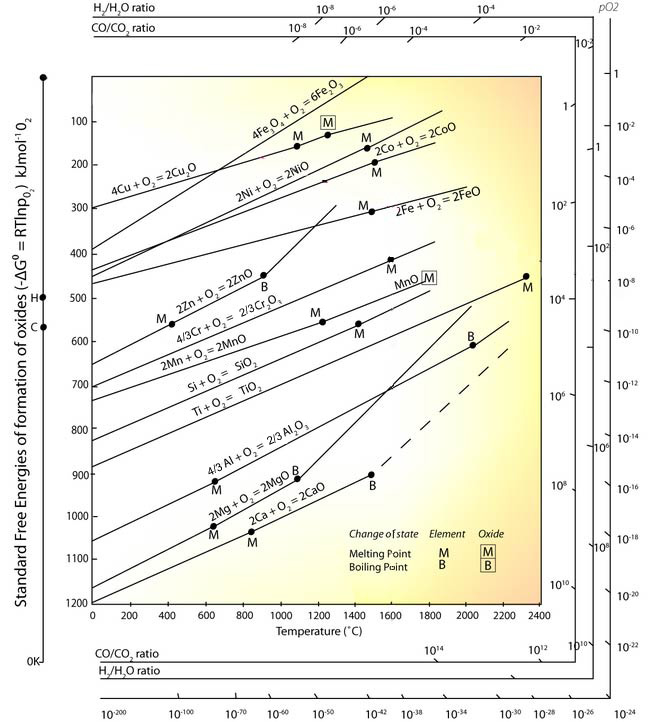
Note: Due to shortage of reliable experimental data, some of these lines are not plotted over the complete range of temperature.
This page titled 25.5: The Ellingham Diagram was last modified on Thu, 24 Aug 2023 21:18:46 GMT and is shared under a CC BY-NC-SA 2.0 license and was authored, remixed, and/or curated by Dissemination of IT for the Promotion of Materials Science (DoITPoMS) via source content that was edited to the style and standards of the LibreTexts platform.
The book could not be loaded just now.