Opening the book…
What is Raman Spectroscopy
Raman spectroscopy is a powerful tool for determining chemical species. As with other spectroscopic techniques, Raman spectroscopy detects certain interactions of light with matter. In particular, this technique exploits the existence of Stokes and Anti-Stokes scattering to examine molecular structure. When radiation in the near infrared (NIR) or visible range interacts with a molecule, several types of scattering can occur. Three of these can be seen in the energy diagram in Figure \(\PageIndex{1}\).
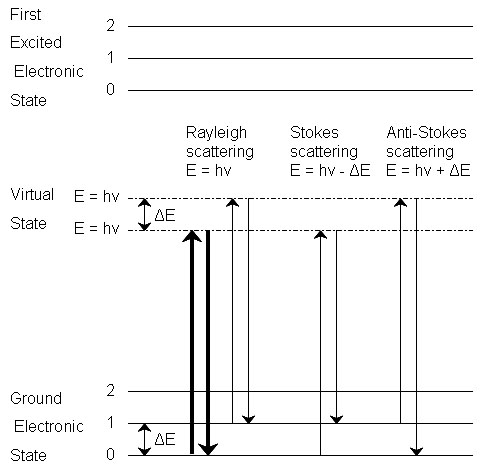
In all three types of scattering, an incident photon of energy hν raises the molecule from a vibrational state to one of the infinite number of virtual states located between the ground and first electronic states. The type of scattering observed is dependent on how the molecule relaxes after excitation.
Rayleigh Scattering
- The molecule is excited to any virtual state.
- The molecule relaxes back to its original state.
- The photon is scattered elastically, leaving with its original energy.
Stokes Scattering
- The molecule is excited to any virtual state.
- The molecule relaxes back to a higher vibrational state than it had originally.
- The photon leaves with energy hν-ΔE and has been scattered inelastically.
Anti-Stokes Scattering
- The molecule begins in a vibrationally excited state.
- The molecule is excited to any virtual state.
- The molecule relaxes back to a lower vibrational state than it had originally.
- The photon leaves with energy hν+ΔE, and has been scattered superelastically.
Rayleigh scattering is by far the most common transition, due to the fact that no change has to occur in the vibrational state of the molecule. The anti-Stokes transition is the least common, as it requires the molecule to be in a vibrationally excited state before the photon is incident upon it. Due to the lack of intensity of the anti-Stokes signal and filtering requirements that eliminate photons with incident energy and higher, generally only Stokes scattering is used in Raman measurements. The relative intensities of Rayleigh, Stokes and anti-Stokes scattering can be seen in Figure \(\PageIndex{2}\).
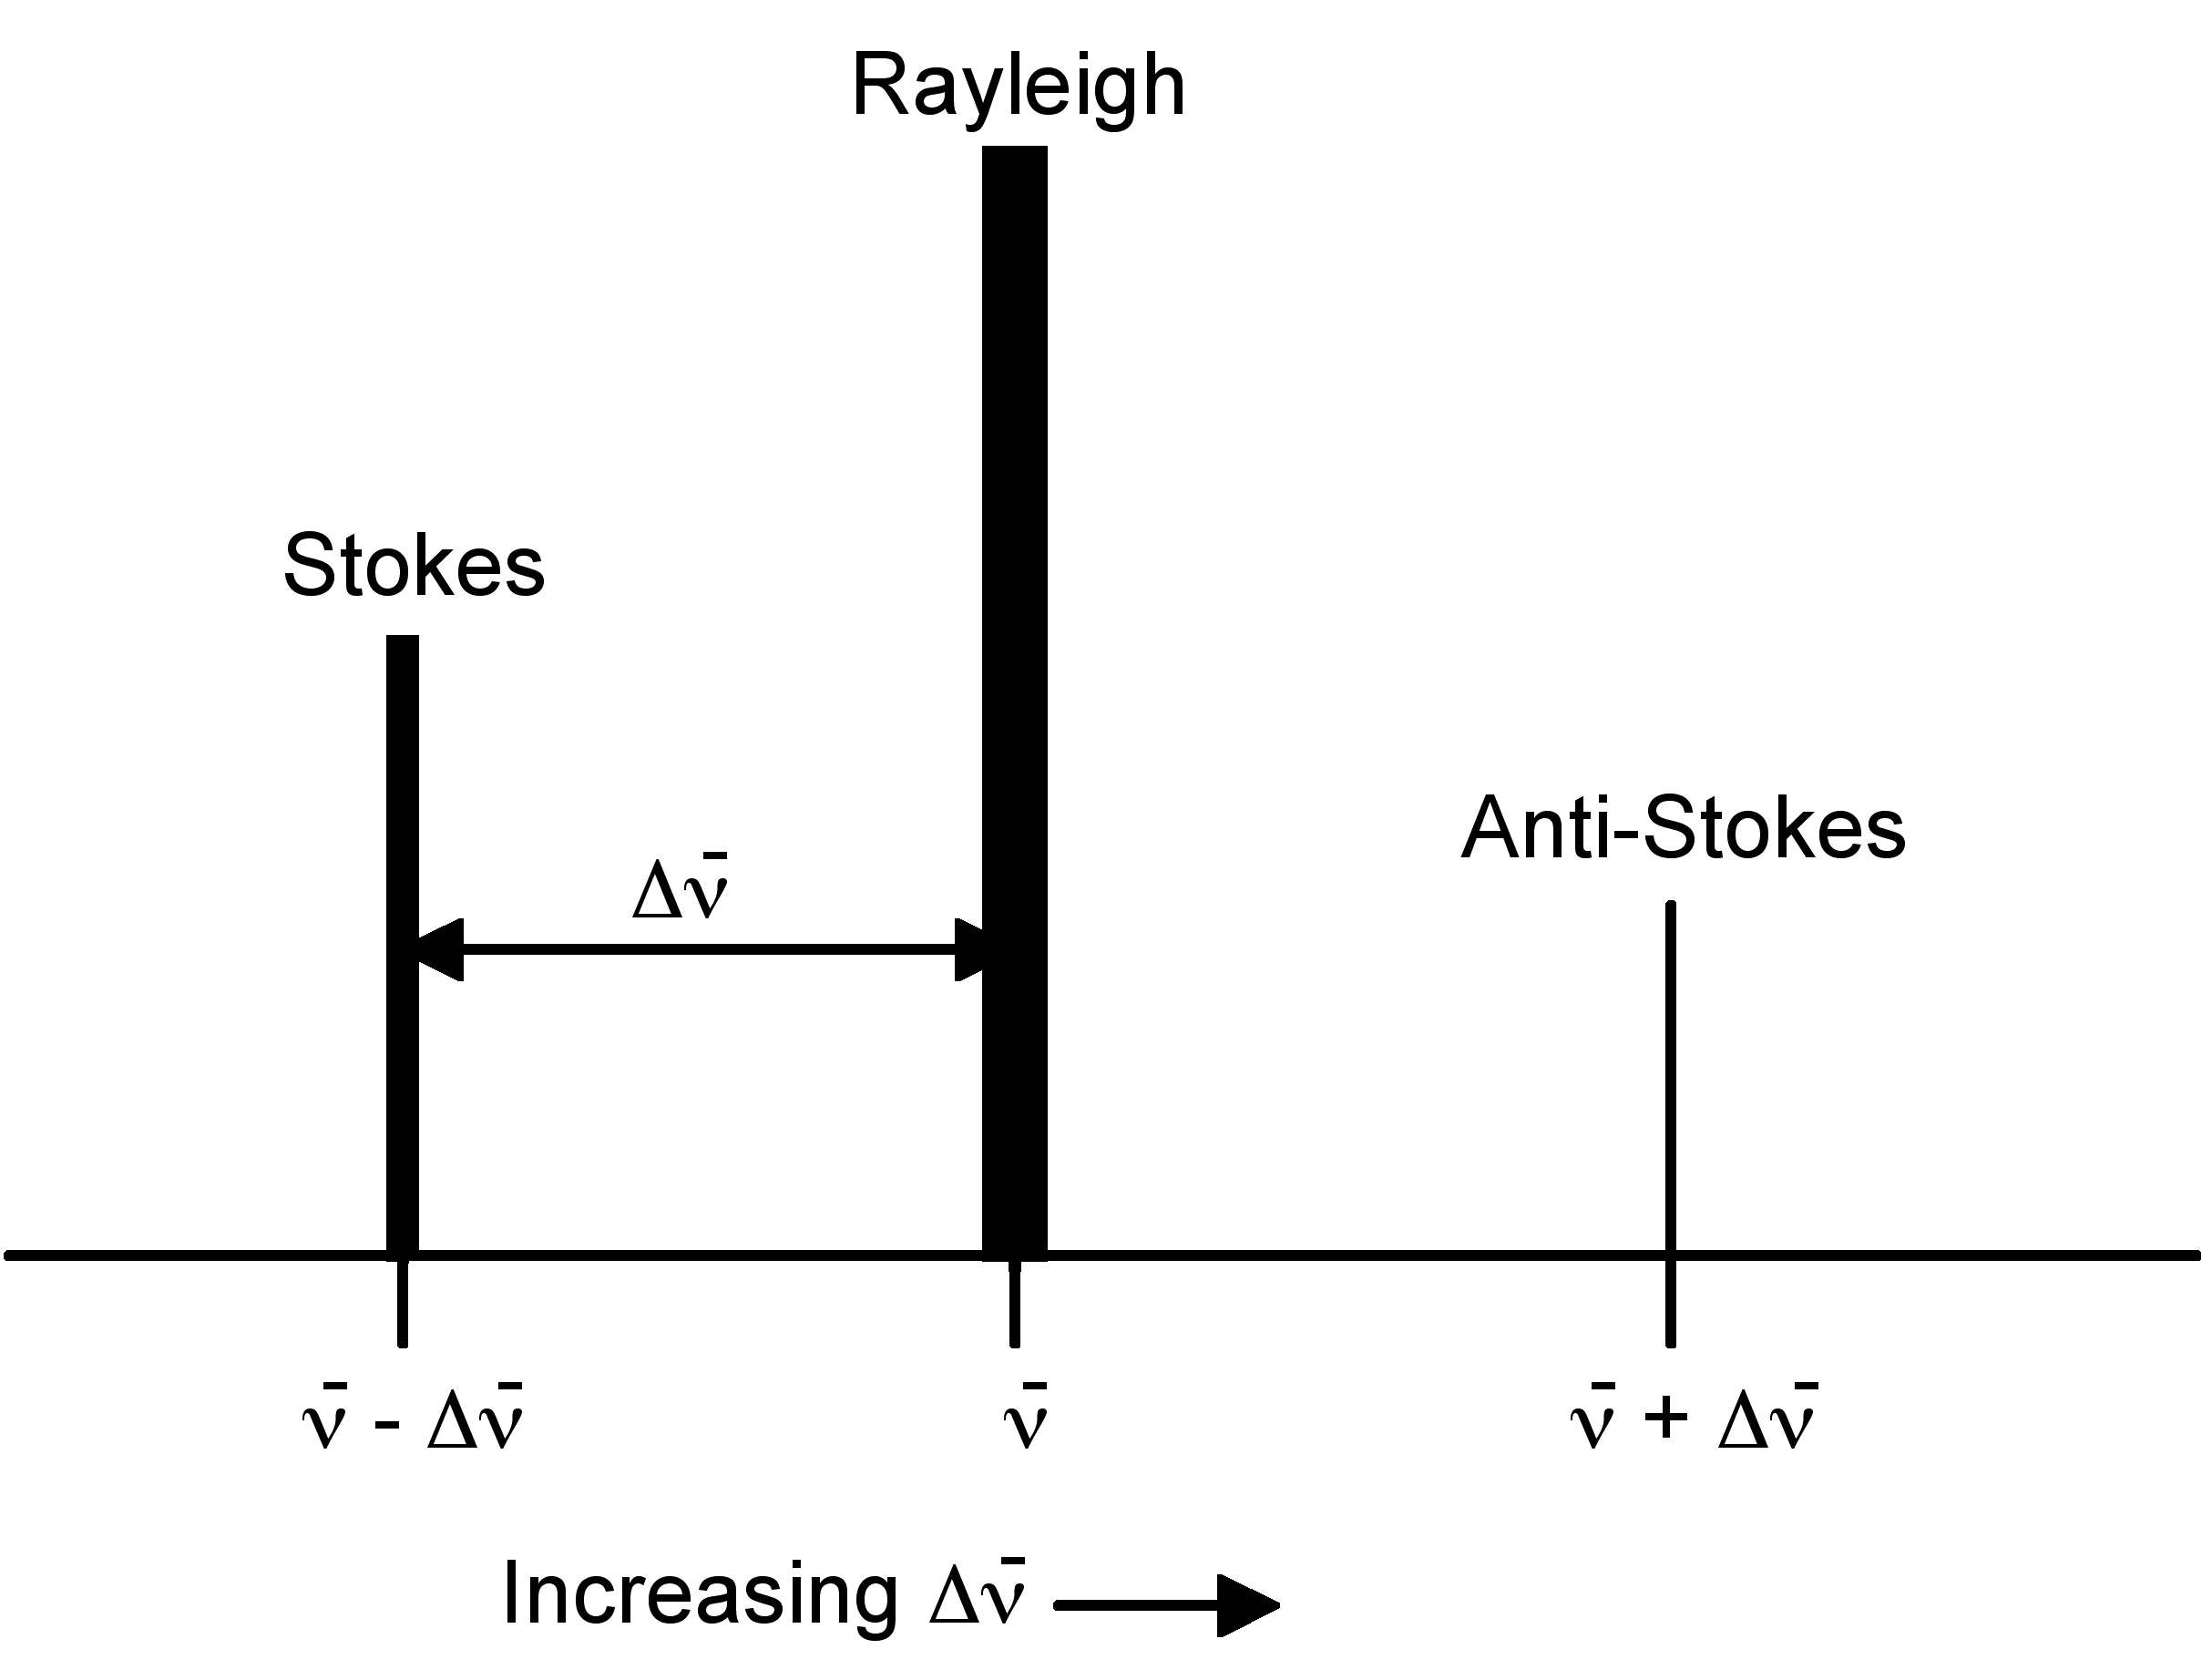
Raman spectroscopy observes the change in energy between the incident and scattered photons associated with the Stokes and anti-Stokes transitions. This is typically measured as the change in the wavenumber (cm-1), from the incident light source. Because Raman measures the change in wavenumber, measurements can be taken using a source at any wavelength; however, near infrared and visible radiation are commonly used. Photons with ultraviolet wavelengths could work as well, but tend to cause photodecomposition of the sample.
Comparison between Raman and Infrared Spectroscopy
Raman spectroscopy sounds very much like infrared (IR) spectroscopy; however, IR examines the wavenumber at which a functional group has a vibrational mode, while Raman observes the shift in vibration from an incident source. The Raman frequency shift is identical to the IR peak frequency for a given molecule or functional group. As mentioned above, this shift is independent of the excitation wavelength, giving versatility to the design and applicability of Raman instruments.
The cause of the vibration is also mechanistically different between IR and Raman. This is because the two operate on different sets of selection rules. IR absorption requires a dipole moment or change in charge distribution to be associated with the vibrational mode. Only then can photons of the same energy as the vibrational state of molecule interact. A schematic of this can be seen in Figure \(\PageIndex{3}\).

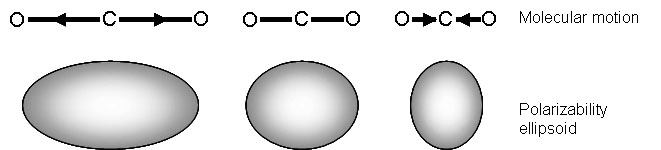
Raman signals, on the other hand, due to scattering, occur because of a molecule’s polarizability, illustrated in Figure \(\PageIndex{4}\). Many molecules that are inactive or weak in the IR will have intense Raman signals. This results in often complementary techniques.
What does Raman Spectroscopy Measure?
Raman activity depends on the polarizability of a bond. This is a measure of the deformability of a bond in an electric field. This factor essentially depends on how easy it is for the electrons in the bond to be displaced, inducing a temporary dipole. When there is a large concentration of loosely held electrons in a bond, the polarizability is also large, and the group or molecule will have an intense Raman signal. Because of this, Raman is typically more sensitive to the molecular framework of a molecule rather than a specific functional group as in IR. This should not be confused with the polarity of a molecule, which is a measure of the separation of electric charge within a molecule. Polar molecules often have very weak Raman signals due to the fact that electronegative atoms hold electrons so closely.
Raman spectroscopy can provide information about both inorganic and organic chemical species. Many electron atoms, such as metals in coordination compounds, tend to have many loosely bound electrons, and therefore tend to be Raman active. Raman can provide information on the metal ligand bond, leading to knowledge of the composition, structure, and stability of these complexes. This can be particularly useful in metal compounds that have low vibrational absorption frequencies in the IR. Raman is also very useful for determining functional groups and fingerprints of organic molecules. Often, Raman vibrations are highly characteristic to a specific molecule, due to vibrations of a molecule as a whole, not in localized groups. The groups that do appear in Raman spectra have vibrations that are largely localized within the group, and often have multiple bonds involved.
What is Surface-Enhanced Raman Spectroscopy
Raman measurements provide useful characterization of many materials. However, the Raman signal is inherently weak (less than 0.001% of the source intensity), restricting the usefulness of this analytical tool. Placing the molecule of interest near a metal surface can dramatically increase the Raman signal. This is the basis of surface-enhanced Raman spectroscopy (SERS). There are several factors leading to the increase in Raman signal intensity near a metal surface
- The distance to the metal surface.
- Signal enhancement drops off with distance from the surface.
- The molecule of interest must be close to the surface for signal enhancement to occur.
- Details about the metal surface: morphology and roughness.
- This determines how close and how many molecules can be near a particular surface area.
- The properties of the metal.
- Greatest enhancement occurs when the excitation wavelength is near the plasma frequency of the metal.
- The relative orientation of the molecule to the normal of the surface.
- The polarizability of the bonds within the molecule can be affected by the electrons in the surface of the metal.
Surface-Enhanced Raman Spectroscopy for the Study of Surface Chemistry
The ever-rising interest in nanotechnology involves the synthesis and application of materials with a very high surface area to volume ratio. This places increasing importance on understanding the chemistry occurring at a surface, particularly the surface of a nanoparticle. Slight modifications of the nanoparticle or its surrounding environment can greatly affect many properties including the solubility, biological toxicity, and reactivity of the nanomaterial. Noble metal nanomaterials are of particular interest due to their unique optical properties and biological inertness.
One tool employed to understand the surface chemistry of noble metal nanomaterial, particularly those composed of gold or silver is surface-enhanced Raman spectroscopy (SERS). Replacing a metal surface with a metal nanoparticle increases the available surface area for the adsorption of molecules. Compared to a flat metal surface, a similar sample size using nanoparticles will have a dramatically stronger signal, since signal intensity is directly related to the concentration of the molecule of interest. Due to the shape and size of the structure, the electrons in the nanoparticle oscillate collectively when exposed to incident electromagnetic radiation. This is called the localized surface plasmon resonance (LSPR) of the nanoparticle. The LSPR of the nanoparticles boosts the Raman signal intensity dramatically for molecules of interest near the surface of the nanoparticle. In order to maximize this effect, a nanoparticle should be selected with its resonant wavelength falling in the middle of the incident and scattered wavelengths.
The overall intensity enhancement of SERS can be as large as a factor of 106, with the surface plasmon resonance responsible for roughly four orders of magnitude of this signal increase. The other two orders of magnitude have been attributed to chemical enhancement mechanisms arising charge interactions between the metal particle and the adsorbate or from resonances in the adsorbate alone, as discussed above.
Why is SERS Useful for Studying Surface Chemistry?
Traditionally, SERS uses nanoparticles made of conductive materials, such as gold, to learn more about a particular molecule. However, of interest in many growing fields that incorporate nanotechnology is the structure and functionalization of a nanoparticle stabilized by some surfactant or capping agent. In this case, SERS can provide valuable information regarding the stability and surface structure of the nanoparticle. Another use of nanoparticles in SERS is to provide information about a ligand’s structure and the nature of ligand binding. In many applications it is important to know whether a molecule is bound to the surface of the nanoparticle or simply electrostatically interacting with it.
Sample Preparation and Instrumental Details
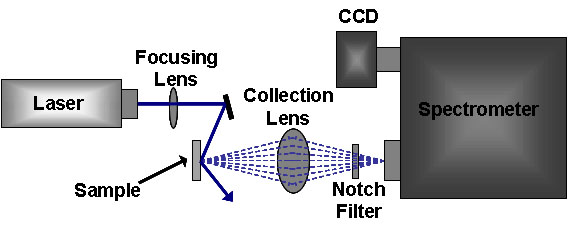
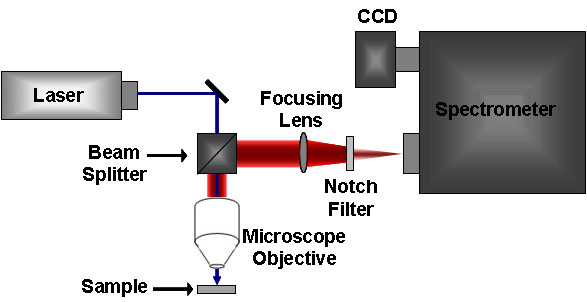
The standard Raman instrument is composed of three major components. First, the instrument must have an illumination system. This is usually composed of one or more lasers. The major restriction for the illumination system is that the incident frequency of light must not be absorbed by the sample or solvent. The next major component is the sample illumination system. This can vary widely based on the specifics of the instrument, including whether the system is a standard macro-Raman or has micro-Raman capabilities. The sample illumination system will determine the phase of material under investigation. The final necessary piece of a Raman system is the spectrometer. This is usually placed 90° away from the incident illumination and may include a series of filters or a monochromator. An example of a macro-Raman and micro-Raman setup can be Figure \(\PageIndex{5}\) and Figure \(\PageIndex{6}\). A macro-Raman spectrometer has a spatial resolution anywhere from 100 μm to one millimeter while a micro-Raman spectrometer uses a microscope to magnify its spatial resolution.
This page titled 4.13: Raman Spectroscopy was last modified on Wed, 22 Oct 2025 19:46:03 GMT and is shared under a CC BY 4.0 license and was authored, remixed, and/or curated by Pavan M. V. Raja and Andrew R. Barron (OpenStax CNX) via source content that was edited to the style and standards of the LibreTexts platform.
The book could not be loaded just now.