Opening the book…
Definitions of Electron Affinity
According to IUPAC, there are two different, but equivalent, definitions of electron affinity (EA).1
Electron affinity can be defined as the energy required when an electron is removed from a gaseous anion. The reaction as shown in equation \(\ref{EA1}\) is endothermic (positive \(\Delta U\)) for elements except noble gases and alkaline earth metals. Under this definition, the more positive the EA value, the higher an atom's affinity for electrons.
\[A^{-}_{(g)} \longrightarrow A_{(g)} + e^- \hspace{1cm} EA = \Delta U \label{EA1} \]
The reaction shown in Equation \(\ref{EA1}\) is similar those that define ionization energy. For this reason, the EA is also described as the zeroth ionization energy.
An alternate and more common definition is the microscopic reverse of Equation \(\ref{EA1}\). This more common definition states that electron affinity is the energy released when an electron is added to a gaseous atom, as shown in Equation \(\ref{EA2}\). The reaction as shown in equation \(\ref{EA2}\) is exothermic (negative \(\Delta U\)) for elements except noble gases and alkaline earth metals. The more negative this EA value, the higher an atom's affinity for electrons.
\[A_{(g)} + e^- \longrightarrow A^{-}_{(g)} \hspace{1cm} EA = \Delta U \label{EA2} \]
Conceptually, this second definition is quite similar to the concept of electronegativity; but unlike electronegativity, EA is a well-defined quantitative measurement.
Trends in Electron Affinity
For this discussion, we will use the definition of EA that is consistent with it being a zeroth ionization energy: a more positive (larger) value means that the EA is higher (meaning stronger affinity toward an electron).
- Across a period: Similar to ionization energy, EA generally increases across a row of the periodic table; this observation is consistent with the increase in effective nuclear charge (Z*) from left to right across a period. However, there are variations across a period that are similar to variations in ionization energy and that can be explained by shielding, penetration, and electron configuration.
- Down a group: Like the case of ionization energy trends, EA does not consistently decrease going down a column of the periodic table despite the fact that \(Z^*\) increases down a group.
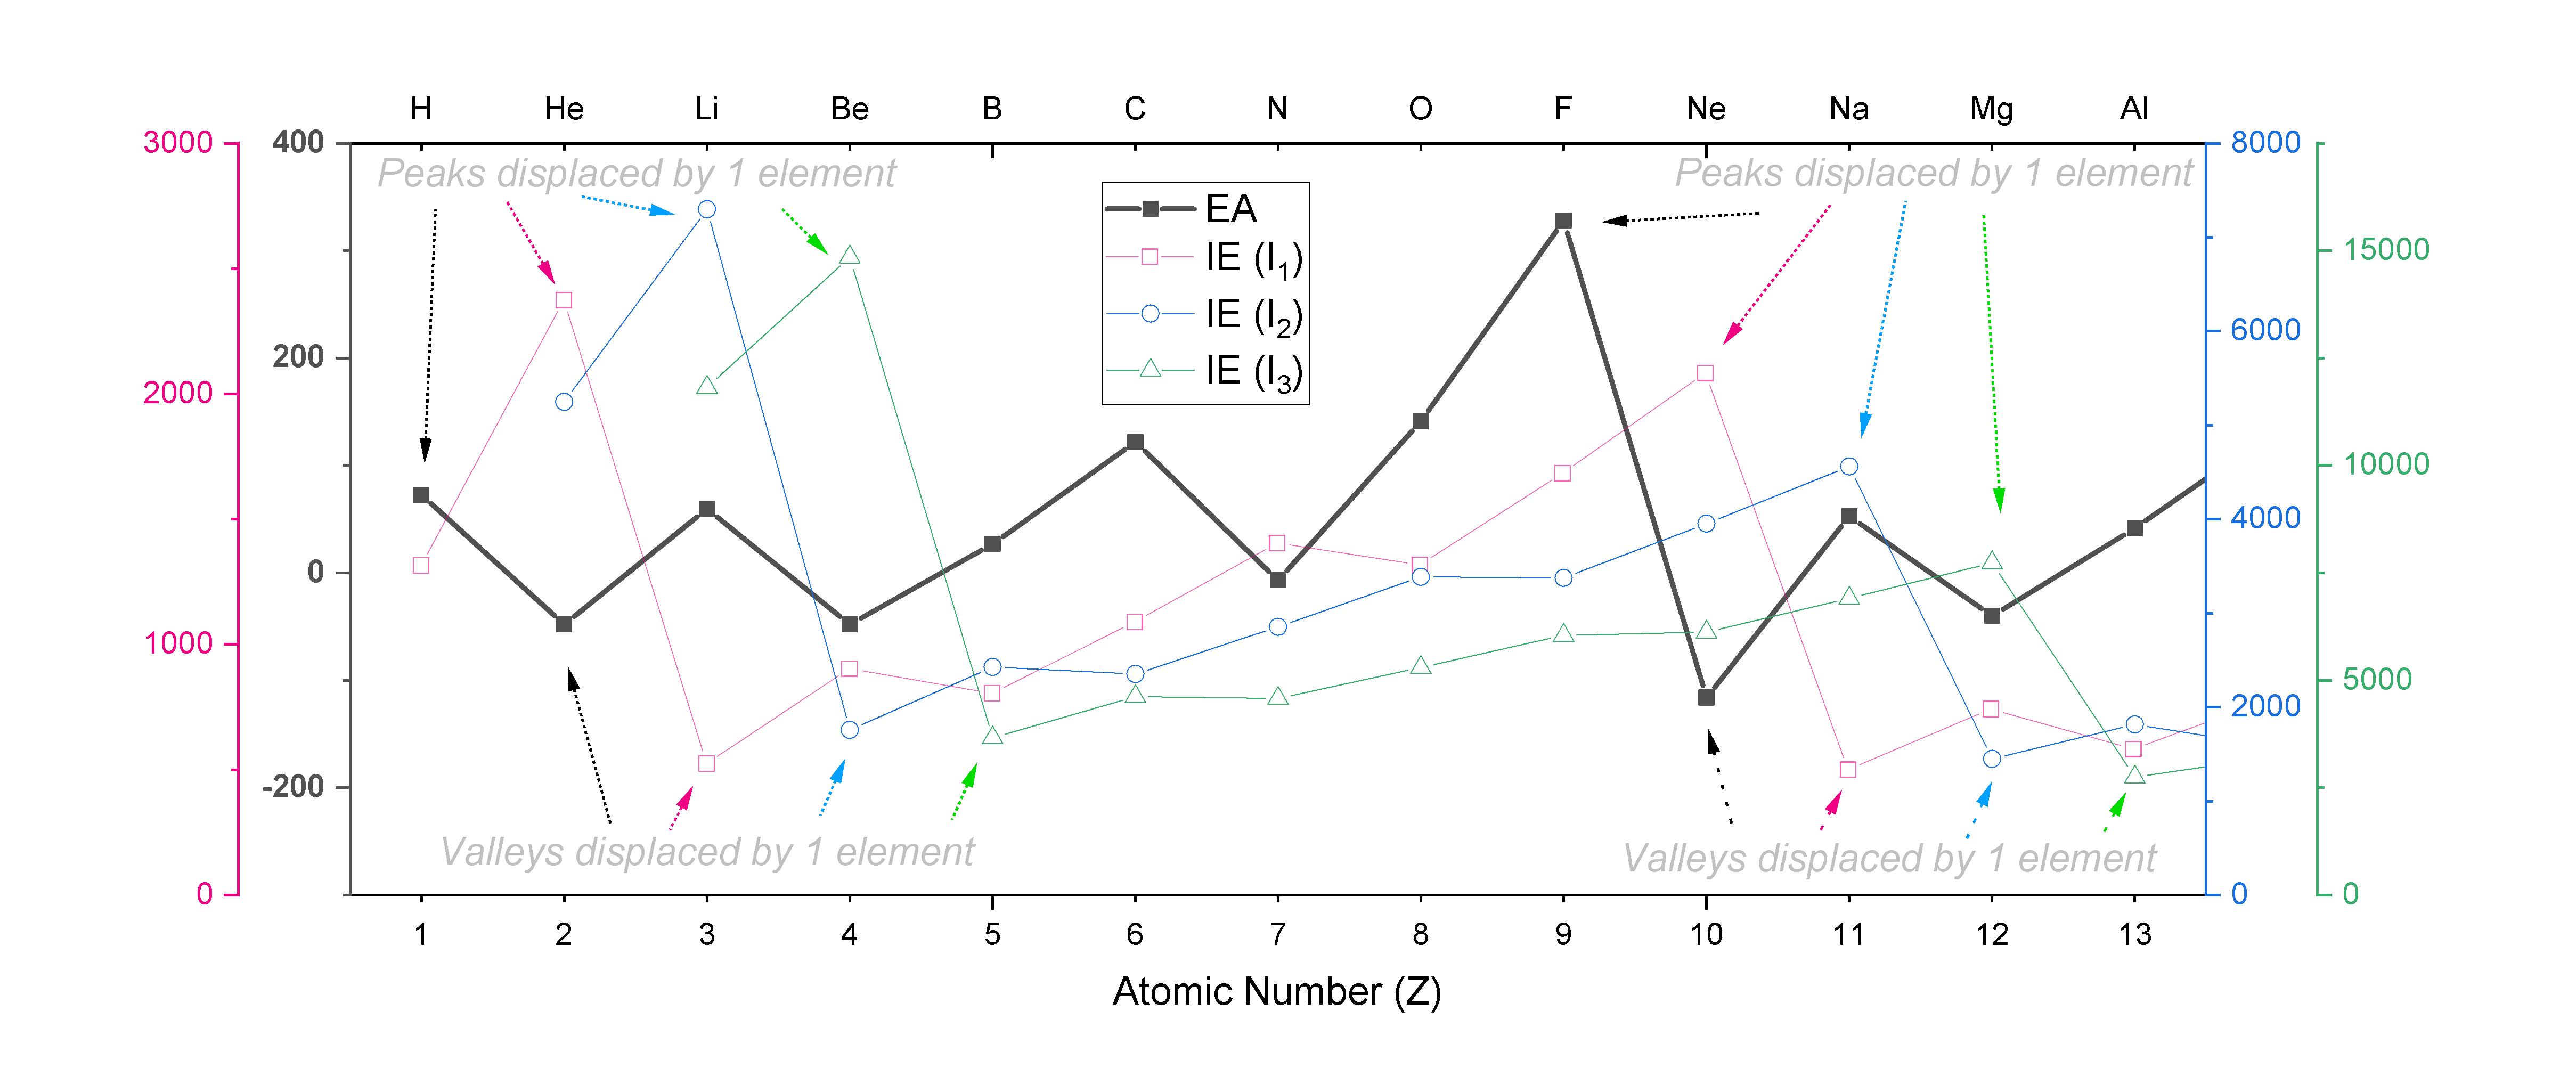
The trend in EA follows a zig-zag pattern similar to the one seen with ionization energies, except that it is displaced by one unit from the trend in \(I_1\), two units from \(I_2\), and so on. For example, EA peaks at F, while \(I_1\) peaks at Ne, \(I_2\) peaks at Na, and \(I_3\) peaks at Mg. A plot of EA for the first 13 elements is shown overlaid on plots of \(I_1, I_2\) and \(I_3\) in Figure \(\PageIndex{1}\)., where the shifts in the peaks and valleys within each zig-zag trend are indicated.
Sources
- IUPAC. Compendium of Chemical Terminology, 2nd ed. (the "Gold Book"). Compiled by A. D. McNaught and A. Wilkinson. Blackwell Scientific Publications, Oxford (1997). Online version (2019-) created by S. J. Chalk. ISBN 0-9678550-9-8. doi.org/10.1351/goldbook.
- Electron Affinity (data page), Wikipedia. en.Wikipedia.org/wiki/Electron_affinity_(data_page) Accessed 12/3/19.
This page titled 2.4.2: Electron Affinity was last modified on Thu, 25 Jul 2024 18:39:37 GMT and is shared under a CC BY-NC 4.0 license and was authored, remixed, and/or curated by Kathryn Haas.
The book could not be loaded just now.