Opening the book…
- Interpret motion graphs of velocity, and position versus time as well as the relationship between these graphs.
Earlier in this chapter, we looked an at example of comparing position, speed, and velocity by way of motions graphs. Let us revisit that example here.
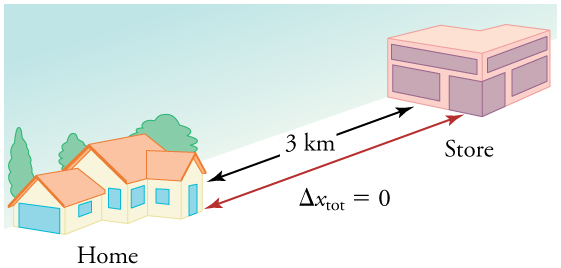
If you drive to a store and return home in half an hour, and your car’s odometer shows the total distance traveled was 6 km, then your average speed was 12 km/h. Your average velocity, however, was zero, because your displacement for the round trip is zero. (Displacement is change in position and, thus, is zero for a round trip.) Thus, average speed is not simply the magnitude of average velocity.
Let us now revisit the motion graphs and consider in more detail what is plotted on those graphs. In each case, the x-axis indicates time. Although there are other ways of graphically showing trends in motion, we will exclusively be plotting time on the x-axis throughout this text. The difference is then the value plotted on the y-axis. What is of interest to us in this section of the chapter is understanding how each type of motion graph is related.
The first graph shows the changing position with time: we call this the position versus time graph. Note that at the start of the position versus time graph this is indicated by an upward sloping line, indicating that the movement is initially at a constant speed in the same direction. Because the direction is the same, it also means that the velocity is also constant. If we then move to the second graph of velocity versus time we see that throughout this section there is a flat line with a positive value showing the velocity. This is exactly what we should expect based on the position versus time graph. The slope of the position versus time graph is the value of the y-axis on the velocity versus time graph. Because the slope is constant on the position versus time graph, the value on the y-axis is a constant on the velocity versus time graph. Later in this section we will investigate how a non-constant slope on the position versus time graph would translate to the velocity versus time graph.
If we move towards the end of the position versus time graph we see that the line is now sloping downward instead of upwards. The corresponding velocity versus time graph should indicate a negative value in this range because the slope of the line in the position versus time graph is negative. The value in the velocity versus time graph is also constant because the slope is constant.
The final graph shows speed versus time. For this graph, we are not considering direction, so whether the line is sloping upwards or downwards in the position versus time graph, the speed will be a positive value. Notice that the speed versus time graph is constant all the way across. There are two reasons for this. The position versus time graph has a constant slope whether it is positive or negative, so this will result in a straight line on the speed versus time graph just as it does on the velocity versus time graph. Because the magnitude of that slope remains the same whether the velocity is positive or negative in this example, the magnitude of the speed remains the same across the entire graph.

We can consider other possibilities for position versus velocity graphs. What will happen to the velocity versus time graph if the position stops changing? What will happen to the velocity versus time graph if the position starts changing at a different rate? We will consider some of these possibilities as we continue in this chapter.
Contributors
Curated from resources found in Introduction to Physics published by OpenStax.
This page titled 2.8.1: Motion graphs of position, velocity, and speed versus time was last modified on Tue, 16 Jul 2024 03:14:39 GMT and is shared under a CC BY-NC-SA 4.0 license and was authored, remixed, and/or curated by Jamie MacArthur.
The book could not be loaded just now.