Opening the book…
If at least one species in a titration absorbs electromagnetic radiation, then we can identify the end point by monitoring the titrand’s absorbance at a carefully selected wavelength. For example, we can identify the end point for a titration of Cu2+ with EDTA in the presence of NH3 by monitoring the titrand’s absorbance at a wavelength of 745 nm, where the \(\text{Cu(NH}_3)_2^{4+}\) complex absorbs strongly. At the beginning of the titration the absorbance is at a maximum. As we add EDTA, however, the reaction
\[\text{Cu(NH}_3)_4^{2+}(aq) + \text{Y}^{4-} \rightleftharpoons \text{CuY}^{2-}(aq) + 4\text{NH}_3(aq) \nonumber \]
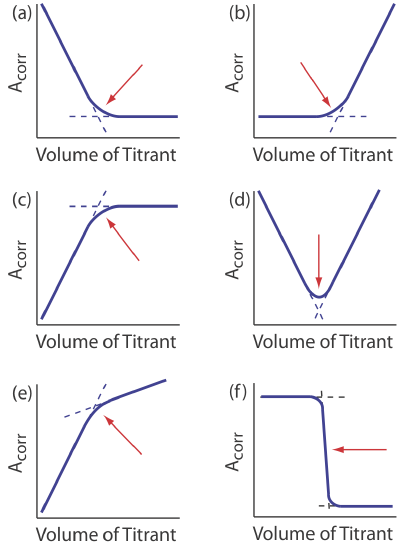
decreases the concentration of \(\text{Cu(NH}_3)_2^{4+}\) and decreases the absorbance until we reach the equivalence point. After the equivalence point the absorbance essentially remains unchanged. The resulting spectrophotometric titration curve is shown in Figure \(\PageIndex{1}a\). Note that the titration curve’s y-axis is not the measured absorbance, Ameas, but a corrected absorbance, Acorr
\[A_\text{corr} = A_\text{meas} \times \frac {V_\text{EDTA} + V_\text{Cu}} {V_\text{Cu}} \nonumber \]
where VEDTA and VCu are, respectively, the volumes of EDTA and Cu. Correcting the absorbance for the titrand’s dilution ensures that the spectrophotometric titration curve consists of linear segments that we can extrapolate to find the end point. Other common spectrophotometric titration curves are shown in Figures \(\PageIndex{1}b-f\).
This page titled 14.5: Photometric Titrations was last modified on Wed, 28 Sep 2022 20:53:47 GMT and is shared under a CC BY-NC-SA 4.0 license and was authored, remixed, and/or curated by David Harvey.
The book could not be loaded just now.