Opening the book…
Search Fundamentals of Biochemistry
(Learning goals written by Claude, Sonnet 4.6, Anthropic)
Steady State vs. Equilibrium: Conceptual Foundation
- Distinguish between equilibrium and steady state in enzyme-catalyzed reactions, explaining why in vivo metabolic pathways operate under steady-state rather than equilibrium conditions and articulating the critical conceptual inversion that in vivo velocity determines substrate concentration, not the reverse.
- Explain how embedding a reversible reaction within a pathway (A ↔ S ↔ P ↔ Q) establishes a steady state in which concentrations of intermediates remain approximately constant, and predict qualitatively how changing the rate constant for product removal alters the apparent Keq of the central reaction.
Computational Modeling of Metabolic Pathways
- Describe the inputs required for a computational model of a metabolic pathway — including defined reaction networks, kinetic parameters (Km, Vmax, Keq, inhibition constants), initial concentrations, and ordinary differential equations (ODEs) — and explain how programs such as VCell and COPASI use numerical methods to generate concentration-vs-time progress curves.
- Write the ordinary differential equation (ODE) for the change in concentration of a metabolic intermediate such as glucose-6-phosphate, given the set of reactions that produce and consume it, correctly assigning positive and negative signs to each flux term.
- Interpret the results of a computational simulation of yeast glycolysis (Teusink model), including the significance of branching reactions (to glycogen, trehalose, glycerol, and succinate) for achieving a realistic steady state, and critically evaluate discrepancies between modeled and experimentally measured fluxes.
Kinetic Equations for Reversible and Inhibited Enzyme Reactions
- Explain why the net forward rate of a reversible enzyme-catalyzed reaction cannot be calculated by simple subtraction of the reverse Michaelis-Menten rate from the forward rate, and recognize the correct form of the fully reversible Michaelis-Menten equation derived under rapid equilibrium assumptions.
- Recognize and interpret the standard kinetic equations for reversible Michaelis-Menten kinetics and competitive inhibition of reversible reactions, identifying how the parameters Km fwd, Km rev, Vmax fwd, Vmax rev, and Ki appear in these expressions and how each affects reaction flux.
Introduction to Metabolic Control Analysis
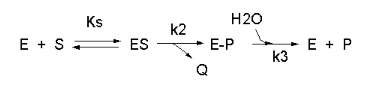
Enzyme kinetics is difficult for students because of complicated mathematical derivations, the number of chemical species involved (an enzyme and all its substrates and products), the number of steps in the mechanism, and the numerous rate, kinetic, and dissociation constants. An example of such a “complicated” reaction explored earlier is shown in Figure \(\PageIndex{1}\).
\begin{equation}
v=\frac{\frac{k_2 k_3}{k_2+k_3}\left(E_0\right)(S)}{\left[\frac{k_3}{k_2+k_3}\right] K_S+S}=\frac{k_{c a t}\left(E_0\right)(S)}{K_M+S}
\end{equation}
But single enzymes rarely act in isolation. They are components of complex pathways with many steps, many of which are regulated. To fully understand a reaction, it is important to study the concentrations of all species in the entire pathway as a function of time. Imagine deriving the equations and determining all the relevant concentrations and constants for a pathway like glycolysis!
To study enzyme kinetics in the lab, you have to spend much time developing assays to measure how the concentration of species changes as a function of time, to be able to measure the initial velocities of an enzyme-catalyzed reaction. However, in networks of interconnected metabolic reactions, the concentrations of certain species may remain constant. How can this happen? Two simple examples might help explain how.
Example 1: There is no change in input or output from a given reaction. This would occur in a closed system for a reversible reaction at equilibrium.
For a reversible reaction of reactant R going to product P (R ↔ P) with forward and reverse first-order rate constants, the following equation can be written at equilibrium:
\begin{equation}
\begin{gathered}
v_f=k_1 R=k_2 P \\
K_{e q}=\frac{P_{e q}}{R_{e q}}=\frac{k_1}{k_2}
\end{gathered}
\end{equation}
At equilibrium, \(R\) and \(P\) don’t change.
Example 2: Consider the reaction as part of a pathway of reactions (like an open system). Now, imagine a nonzero input to form reactant R and a nonzero output that consumes product P, as shown in Figure \(\PageIndex{2}\).
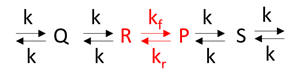
If the input and output rates are the same, the concentrations of R and P would remain constant over time. This would lead to steady-state, but not equilibrium, species concentrations.
The Steady State - A Threshold Biochemistry Concept
Students often struggle to understand steady state and recognize when it may prevail under specific conditions.
In his book Fundamentals of Enzyme Kinetics, Cornish-Bowden discusses the key differences between enzyme kinetics performed in test tubes (in vitro) and what occurs in cells (in vivo). We've discussed this previously, but it's essential to revisit it now. The conditions under which enzymes are studied (in vitro) and those under which they operate (in vivo) are very different.
- In vitro (in the lab), the enzyme is held at a constant concentration while the substrate is varied (i.e., the substrate concentration is the independent variable). The substrate concentration determines the velocity. When studying inhibition, the substrate is varied while the inhibitor is held constant at several fixed concentrations.
- In vivo (within the cell), the velocity may remain relatively constant in a pathway. This means that the velocity determines the substrate concentration! You may have to repeat this sentence many times in your mind to realize its significance, as it seems to contradict all the kinetics you studied in many courses! To avoid a flux bottleneck, the substrate can't build up at the enzyme; therefore, the enzyme processes it in a steady-state manner to produce the product, as determined by the Michael-Menten equation.
These differences are vastly underappreciated and not widely understood by students and instructors alike.
Additionally, we confound our efforts to help students understand the steady state by focusing almost exclusively on initial rate (v0) vs. [S] curves when substrate concentration changes. Then, instructors expect students to magically understand the steady state when substrate levels in pathways don’t change. It’s a big leap out of this box. We can help students better understand the steady state by shifting to progress curves (concentrations vs. time), which they can easily construct using programs such as VCell and COPASI.
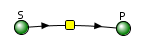
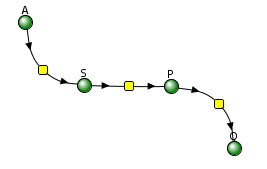
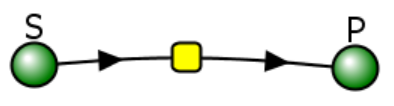
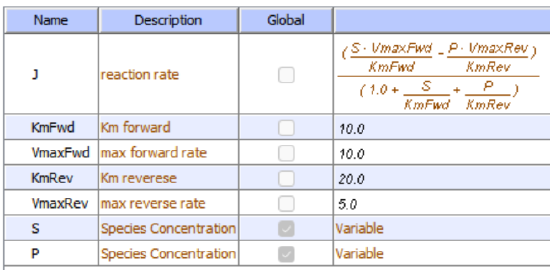
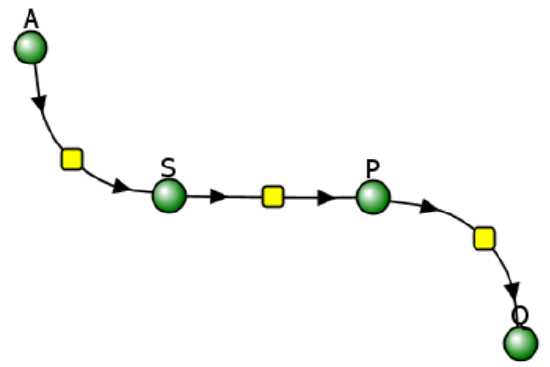
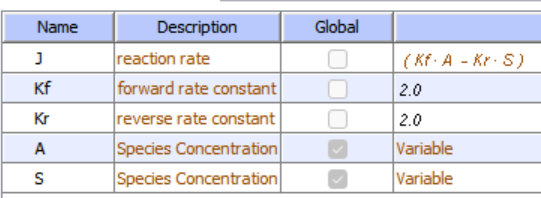
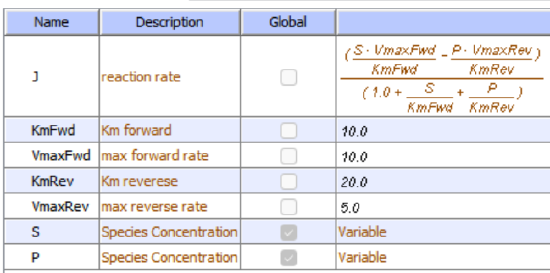
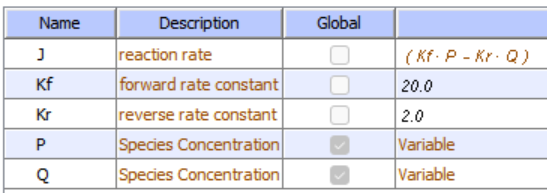
Let's use VCell to analyze a very simple reversible enzyme in isolation, S ↔ P. Then we will place that same enzyme into a "mini" pathway, A ↔ S ↔ P ↔ Q, in which there is one preceding reactant, A, and one following product, Q, that help control S and P levels. We must start the simulation at a specified concentration, so the default for the simulations is set such that [S] and [A] at time t = 0, S0 and A0 are both 5, and the rest are set to 0. Thus, as the simulation begins, concentrations adjust until they reach equilibrium or steady-state concentrations. Table \(\PageIndex{1}\) shows the reaction diagrams and their parameters. Here is the equation for both.
\begin{equation}
\frac{\left(\frac{S \cdot V m a x F w d}{K m F w d}-\frac{P \cdot V m a x R e v}{K m R e v}\right)}{\left(1.0+\frac{S}{K m F w d}+\frac{P}{K m R e v}\right)}
\end{equation}
| A reversible enzyme in isolation, S ↔ P | A reversible enzyme for S ↔ P in a mini-pathway A ↔ S ↔ P ↔ Q | ||||||||||||||||||||||||||||||||||||||||||||||||||||||||||||||||||||||||||||
 |
 |
||||||||||||||||||||||||||||||||||||||||||||||||||||||||||||||||||||||||||||
|
|
|
||||||||||||||||||||||||||||||||||||||||||||||||||||||||||||||||||||||||||||
Figure \(\PageIndex{3}\): Reaction schemes and parameters for a simple enzyme-catalyzed reversible reaction (left) and the same reaction embedded in a "mini" pathway (right).
VCell simulation for the isolated enzyme
Remember that an enzyme doesn't change the thermodynamics of a given reaction and hence doesn't alter Keq. It just speeds up both the forward and the reverse reactions. Hence, you can calculate the Keq for the reaction condition from the VCell model time course graph:
\begin{equation}
\mathrm{K}_{\mathrm{eq}}=\frac{[\mathrm{P}]_{\mathrm{eq}}}{[\mathrm{S}]_{\mathrm{eq}}}=\frac{4}{1}=1
\end{equation}
Now you observe that in this reaction, S does change from its initial value, S0 = 5 (since P0 = 0). Soon, however, the reaction reaches a dynamic equilibrium, in which neither S nor P changes over time.
You could choose a different initial concentration of S and P, rerun the simulation, and calculate KEQ for the new conditions using the CSV-downloaded spreadsheet data from each run you make. They should be the same.
 MODEL
Reversible reaction E + S ↔ ES ↔ EP ↔ E + P
Initial values
Select Load [model name] below
Select Start to begin the simulation.
Select Plot to change Y axis min/max, then Reset and Play | Select Slider to change which constants are displayed | Select About for software information.
Move the sliders to change the constants and see changes in the displayed graph in real-time.
Time course model made using Virtual Cell (Vcell), The Center for Cell Analysis & Modeling, at UConn Health. Funded by NIH/NIGMS (R24 GM137787); Web simulation software (miniSidewinder) from Bartholomew Jardine and Herbert M. Sauro, University of Washington. Funded by NIH/NIGMS (RO1-GM123032-04)
VCell simulation for the enzyme in a "mini-pathway"
Now compare this same reaction, but in which S and P are part of the "mini-pathway" A ↔ S ↔ P ↔ Q, as shown in the VCell model below. The enzyme kinetic parameters for S ↔ P (KM forward, VM forward, KM reverse, VM reverse) in the A ↔ S ↔ P ↔ O pathway were set equal to those for the simple S ↔ P reaction, since it's the same enzyme. How do the A ↔ S and P ↔ Q reactions affect the apparent KEQ? Run the VCell model with the defaults automatically set to the values in the table above!
MODEL
Initial Values
 |
 |
 |
Select Load [model name] below
Select Start to begin the simulation.
Select Plot to change Y axis min/max, then Reset and Play | Select Slider to change which constants are displayed | Select About for software information.
Move the sliders to change the constants and see changes in the displayed graph in real-time.
Time course model made using Virtual Cell (Vcell), The Center for Cell Analysis & Modeling, at UConn Health. Funded by NIH/NIGMS (R24 GM137787); Web simulation software (miniSidewinder) from Bartholomew Jardine and Herbert M. Sauro, University of Washington. Funded by NIH/NIGMS (RO1-GM123032-04)
As in the first simulation, S and P quickly reach constant values. Both are significantly lower than in the simple reaction of S ↔ P since P is being pulled toward Q faster than Q is converted back to S. Note also that Q reaches a higher concentration than either A or S, but remember that the sum of the initial values of A and S is 10.
Run the simulation again, but this time, set kr=200 for the P ↔ Q reaction.
Now, calculate the "KEQ apparent" for the different kf values of the conversion of P → Q from this equation. Again, use the CSV file you downloaded for each run.
\begin{equation}
K_{\text {eq apparent }}=\frac{[\mathrm{P}]_{\text {steady state }}}{[\mathrm{S}]_{\text {steady state }}}
\end{equation}
Do they equal 4 as in case 1? No, they do not! You should see that the "KEQ apparent" value deviates most from 4 (lower number) when the rate constant for removal of P is highest (kf=200).
Animations
Now, let's look at animations of these reactions to better understand their dynamics. Click the image in Figure \(\PageIndex{4}\) to view (in a new window) the animation of the chemical species and an inserted graph showing concentration vs. time for the reversible enzyme-catalyzed Reaction S ↔ P
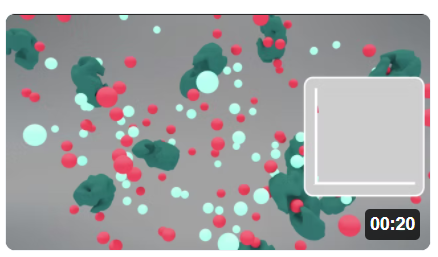
Pay attention to the disappearance of S (red) and the appearance of P (light blue) species after interacting with the enzyme (green).
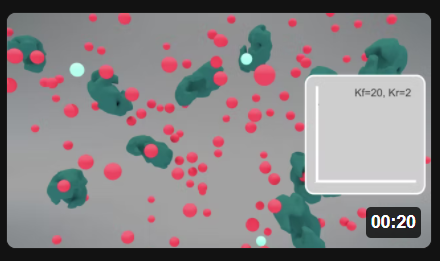
Now here are two animations for the S ↔ P reaction when it's embedded in the "minipathway" A ↔ S ↔ P ↔ Q, when kf for the reaction P ↔ Q is 20 (left) and 200 (right). Click the images in Figure \(\PageIndex{5}\) to view (in a new window) an animation of the chemical species and inserted graphs showing concentrations vs. time.
| "mini-pathway" A ↔ S ↔ P ↔ Q, kf for the reaction P ↔ Q = 20 | "mini-pathway" A ↔ S ↔ P ↔ Q, kf for the reaction P ↔ Q = 200 |
 |
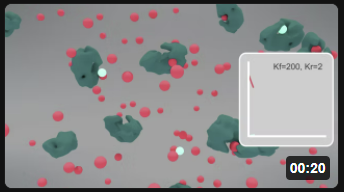 |
Figure \(\PageIndex{5}\): Animation of the reversible enzyme-catalyzed Reaction embedded in a "minipathway" A ↔ S ↔ P ↔ Q when kf for the reaction P ↔ Q is 200. S (red), P (light blue), and enzyme (green).
These animations should reinforce your understanding of the differences between equilibrium and steady-state conditions, although you can calculate the actual KEQ apparent from the insert graphs without numerical data.
Understanding a pure enzyme in vitro and in vivo requires different approaches. Biochemists isolate and purify an enzyme from certain tissues and study its mechanism of action. When performing thermodynamic measurements to determine equilibrium constants (Keq) or dissociation constants (KD), from which ΔG0 can be calculated, a protein concentration is usually held constant as the binding ligand concentration is varied (independent variable). A dependent variable signal (often spectroscopic) is measured. Measurements are made when equilibrium is reached.
As we mentioned above (but it bears repeating), for enzyme kinetic measurements in vitro, the enzyme concentration is usually held constant as substrate and modifiers are varied (independent variables) to determine how velocity (dependent variable) changes. The substrate concentration determines the velocity. When studying inhibition, the substrate concentration is varied while the inhibitor concentration remains constant at several fixed levels.
In vivo, reaction velocity depends on substrate concentration. For sets of reactions in pathways, flux (J) is used instead of velocity. In the steady state, the in and out fluxes for a given reaction are identical. Flux J is used to describe the rate of the system, whereas the rate or velocity v is used to describe the rate of an individual enzyme in a system.
Computer programs can find steady-state concentrations by setting the ordinary differential equations (ODEs) to zero (vf = vr). To model a process at very low concentrations, programs can also use probabilistic or stochastic simulations to model probability distributions for species and their temporal changes for a finite number of particles. In such simulations, concentrations (in mM) are replaced with the number of particles/unit volume. ODEs don’t work well to describe these conditions because concentrations don't change continuously.
Now, let's return to our earlier rhetorical question: how do we derive the equations and determine all the relevant concentrations and constants for a pathway such as glycolysis? Teusink et al. did this for yeast glycolysis. Many complex metabolic and signal transduction pathways have been mathematically modeled to better understand cellular and organismal responses. Systems biology is based on quantitatively modeling and predicting the concentrations, inputs, and outputs of all species in complex pathways.
Basic Principles of Metabolic Control Analysis - Glycolysis
Let's use a more complex example, glycolysis, to illustrate the powers of computational modeling of entire pathways. The reference for this model is shown below.
Can yeast glycolysis be understood in terms of the in vitro kinetics of the constituent enzymes? Testing biochemistry, Bas Teusink, Jutta Passarge, Corinne A. Reijenga, Eugenia Esgalhado, Coen C. van der Weijden, Mike Schepper, Michael C. Walsh, Barbara M. Bakker, Karel van Dam, Hans V. Westerhoff, and Jacky L. Snoep, 2000, European Journal of Biochemistry, 267, 5313-5329. PubMed ID: 10951190.
Databases containing curated models with all the above information have been developed for many pathways. The yeast glycolysis model described in the reference above and the material below is found in the Biomodels Database. The model, BIOMD0000000064, can be downloaded as a Systems Biology Markup Language (SBML) file and imported into any of the programs described above.
A variety of inputs are required for such computational analyses:
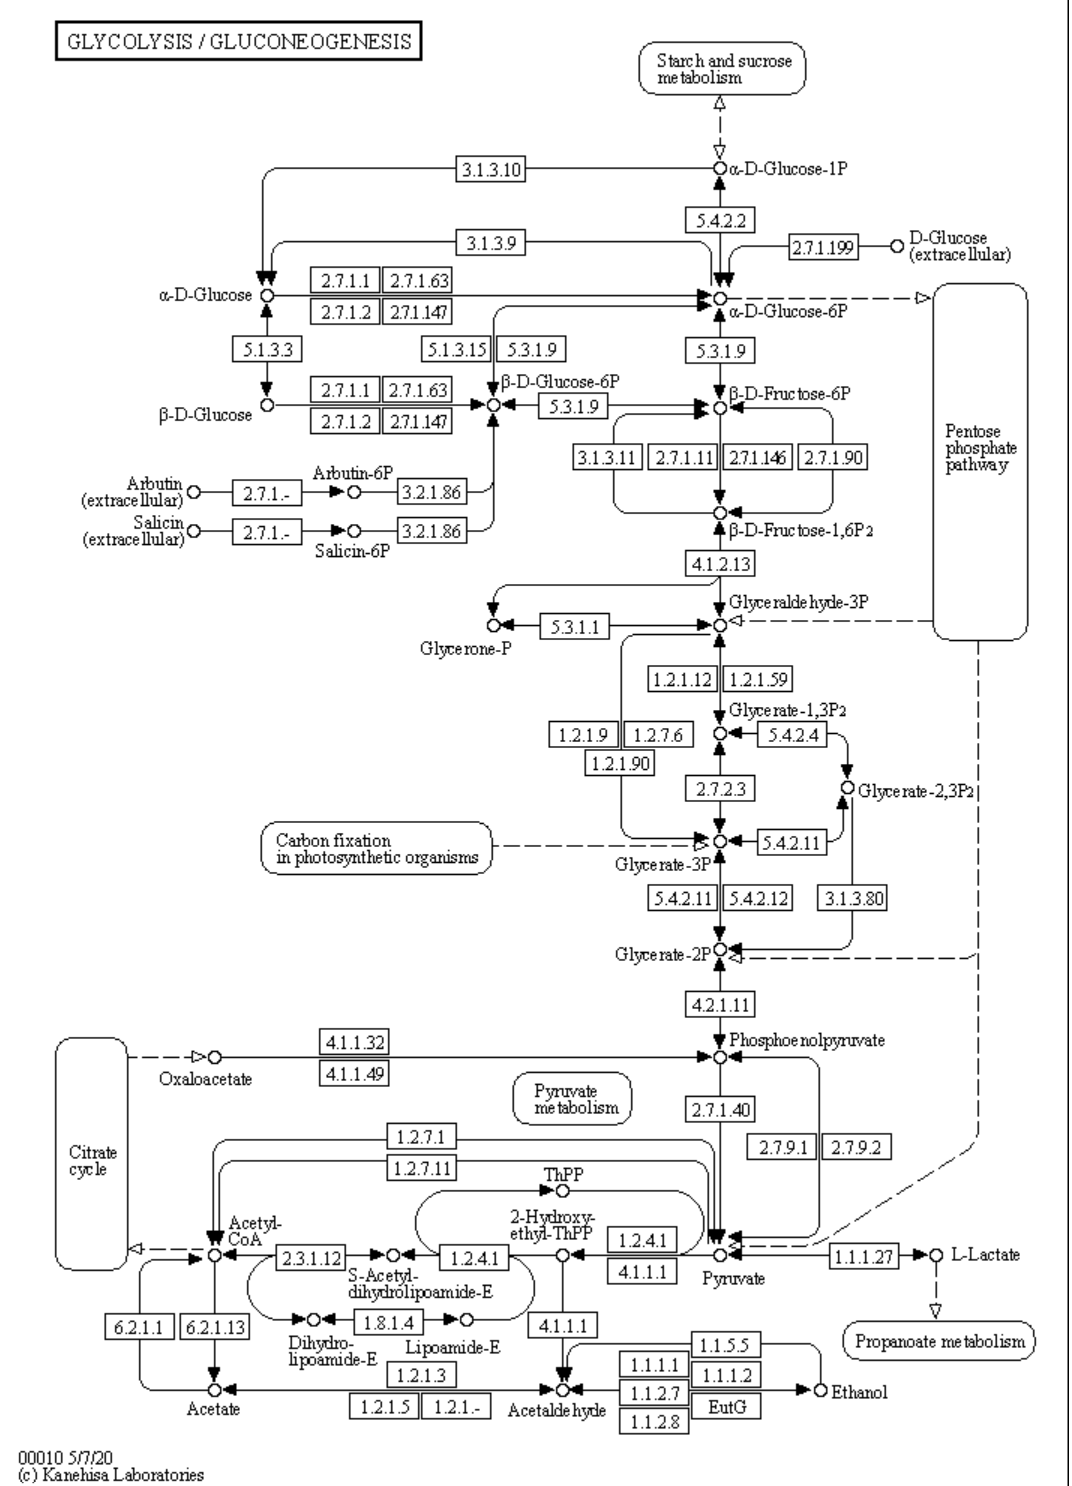
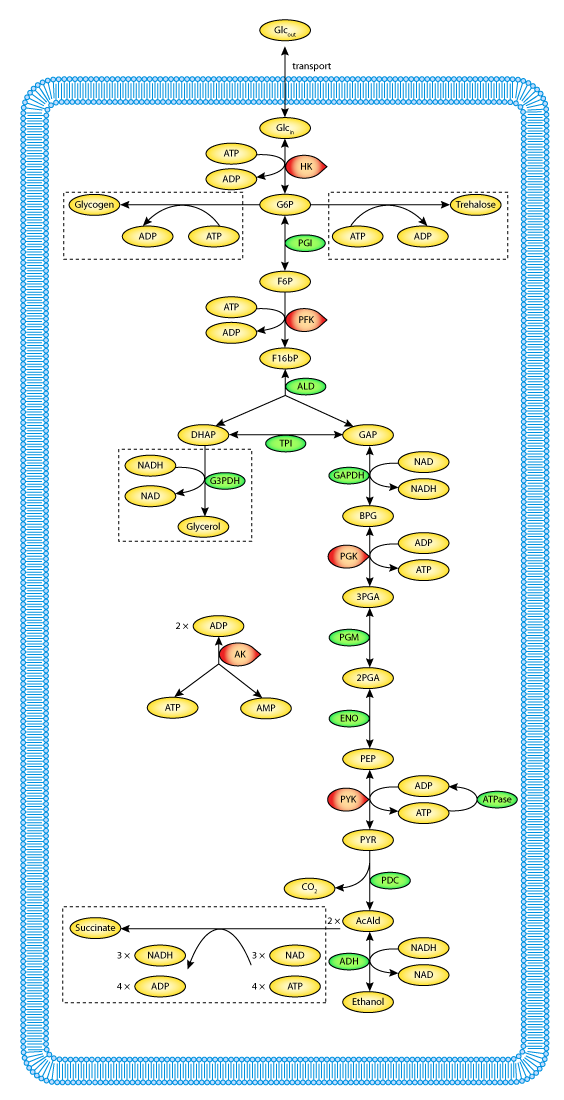
a. Defined pathways. These are available in many databases. An example from the KEGG pathways for yeast glycolysis is shown in the left panel of Figure \(\PageIndex{6}\) below. The right panel shows a more familiar representation, with glucose on the outside of the cell (Glco) entering the cell.
  |
 |
b. A computational modeling program to input all parameters, equations, and models and calculate concentrations for all species as a function of time. We use VCell throughout this book. We construct a reaction diagram that connects all the species involved. Two are shown in Figure \(\PageIndex{7}\) below.
 |
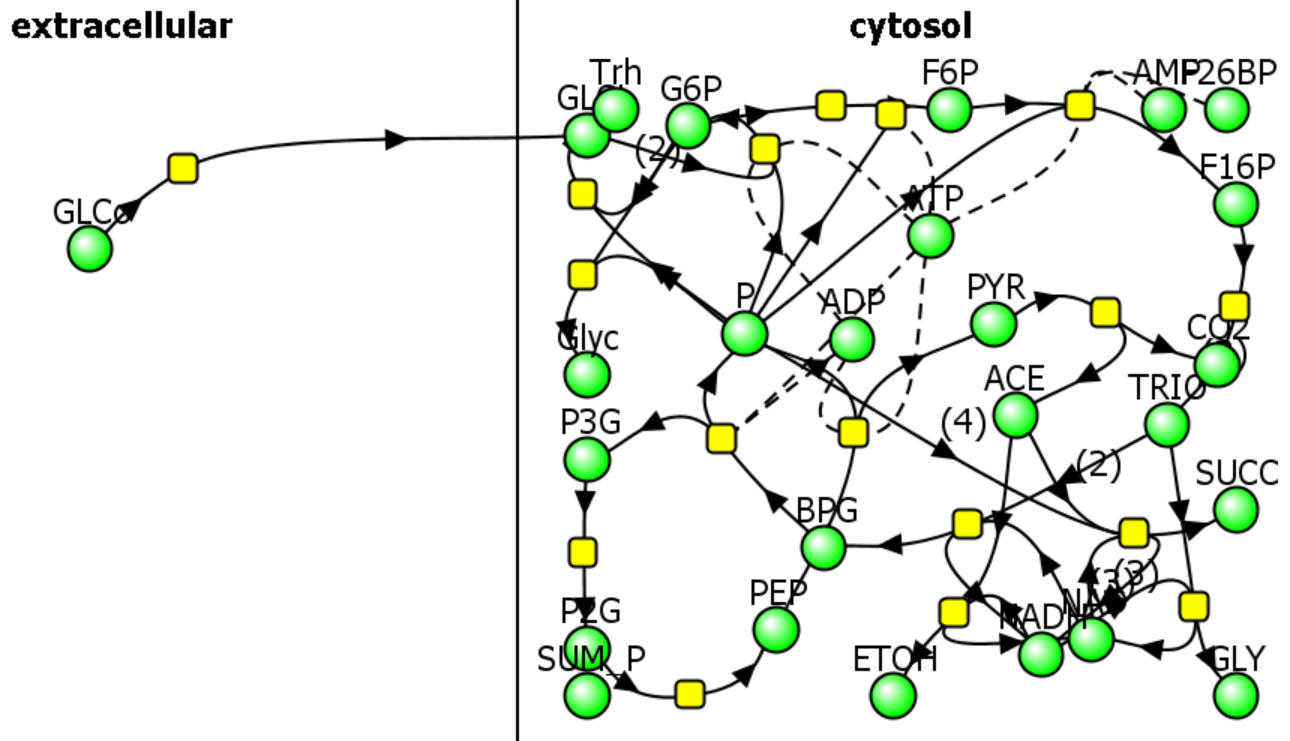 |
The computational results from the analyses for yeast glycolysis were able to fit experimental data only if corrected by the addition of several branching reactions (shown in the figures above and Figure \(\PageIndex{8}\)) and in the dotted boxes in Figure 6 (Right)

Trehalose is the non-reducing disaccharide Glc-(α 1,1)-Glc. It is a reserve carbohydrate that also protects yeast against stress (desiccation, dehydration, temperature extremes) and lethal levels of ethanol. These effects arise from its impact on protein stability, likely because it is preferentially excluded from proteins' hydration spheres. A similar mechanism explains glycerol's stabilizing effect on protein stability, as described in Chapter 4.9.
c. Table 2 below shows a list of all reactions as shown in Figure \(\PageIndex{10}\) for glycolysis and branching reactions (taken from COPASI).
| Reaction | Name | Structure |
| ACE + NADH → NAD + ETOH | vADH | cytosol |
| F16P → 2TRIO | vALD | cytosol |
| P → | vATP | cytosol |
| P2G → PEP | vENO | cytosol |
| TRIO + NADH → NAD + GLY | vG3PDH | cytosol |
| NAD + TRIO → NADH + BPG | vGAPDH | cytosol |
| P + GLci → G6P | vGLK | cytosol |
| GLCo → GLci | vGLT | extracellular |
| G6P + P → Glyc | vGLYCO | cytosol |
| PYR → ACE + CO2 | vPDC | cytosol |
| P + F6P → F16P | vPFK | cytosol |
| G6P → F6P | vPGI | cytosol |
| BPG → P + P3G | vPGK | cytosol |
| P3G → P2G | vPGM | cytosol |
| PEP → P + PYR | vPYK | cytosol |
| 3NAD + 4P + 2ACE → 3NADH + SUCC | vSUC | cytosol |
| 2G6P + P → Trh | vTreha | cytosol |
Table \(\PageIndex{2}\): List of reactants and concentrations for yeast glycolysis. P is ATP, ACE is acetaldehyde, a reactant/product of the enzyme alcohol dehydrogenase.
d. Parameters (concentrations, rate, enzyme kinetics, and equilibrium constants) of all species. Table \(\PageIndex{3}\) below shows the initial concentrations for the glycolysis model.
| Species | Structure | Clamped | Conc (mM) |
| GLCo | extracellular | TRUE | 50 |
| GLCi | cytosol | FALSE | 0.087 |
| G6P | cytosol | FALSE | 2.45 |
| F6P | cytosol | FALSE | 0.62 |
| F16P | cytosol | FALSE | 5.51 |
| TRIO | cytosol | FALSE | 0.96 |
| BPG | cytosol | FALSE | 0 |
| P3G | cytosol | FALSE | 0.9 |
| P2G | cytosol | FALSE | 0.12 |
| PEP | cytosol | FALSE | 0.07 |
| PYR | cytosol | FALSE | 1.85 |
| ACE | cytosol | FALSE | 0.17 |
| P | cytosol | FALSE | 6.31 |
| NAD | cytosol | FALSE | 1.2 |
| NADH | cytosol | FALSE | 0.39 |
| Glyc | cytosol | TRUE | 0 |
| Trh | cytosol | TRUE | 0 |
| CO2 | cytosol | TRUE | 1 |
Table \(\PageIndex{3}\): Initial concentrations for the glycolysis model. Clamped TRUE means concentrations were fixed.
e. Equations that can be used to compute the change in concentrations of all species with time. These are usually ordinary differential equations (ODEs) as described in Chapter 6B - Kinetics of Simple and Enzyme-Catalyzed Reactions, Section B1: Single Step Reactions.) ODEs are easy to write but require a computer to solve as the number of interacting species increases.
For a quick review, consider the relatively simple reaction scheme shown in Figure \(\PageIndex{12}\) below. The ODEs for each species are shown below.

The ODEs for each species are as follows.
\begin{equation}
\begin{aligned}
\frac{d[A]}{d t} &=-k_1[A][B]+k_2[C] \\
\frac{d[B]}{d t} &=-k_1[A][B]+k_2[C] \\
\frac{d[C]}{d t} &=+k_1[A][B]-k_2[C]-k_3[C]=+k_1[A][B]-\left(k_2+k_3\right)[C] \\
\frac{d[D]}{d t} &=+k_3[C]
\end{aligned}
\end{equation}
If a reaction removes species X, the right side of the ODE for the disappearance of that species has a – sign for that term. Likewise, if a reaction increases the concentration of species X, the right-hand side has a positive sign. The above examples illustrate unimolecular (C to D, C to A + B) and bimolecular (A + B to C) reactions.
Now, let's examine the equations specifically for the change in glucose-6-phosphate concentration. Two reactions can form it, and four reactions can remove it (check arrows for reversibility), as shown in Figure \(\PageIndex{13}\) below.

Figure \(\PageIndex{13}\): The reactions that change [G6P] in the Teusink yeast glycolysis model
We can write an ODE for the change in glucose-6-phosphate concentration.
\begin{equation}
\left.\mathrm{d}[\mathrm{G} 6 P] / \mathrm{dt}=v_{\mathrm{HK}}-v_{\mathrm{PGI}}-2 v_{\text {trehalose }}-v_{\text {glycogen }}\right)
\end{equation}
where HK is hexokinase, and PGI is phosphoglucoisomerase. Note the coefficient of 2 for trehalose formation, since it takes 2 G6Ps to make 1 trehalose.
Let's look at the terms and how they are written in VCell.
Formation of G6P
Only one reaction goes towards G6P. It's the reaction catalyzed by hexokinase (G + ATP → G6P + ADP). In the VCell reaction diagram, ATP is represented by P. Flux J =
\begin{equation}
\frac{V m G L K \cdot\left(G L C i \cdot A T P-\frac{G 6 P \cdot A D P}{K e q G L K}\right)}{K m G L K G L C i \cdot K m G L K A T P \cdot\left(1.0+\frac{G L C i}{K m G L K G L C i}+\frac{G 6 P}{K m G L K G 6 P}\right) \cdot\left(1.0+\frac{A T P}{K m G L K A T P}+\frac{A D P}{K m G L K A D P}\right)}
\end{equation}
Removal of G6P
3 reactions go away from G6P.
i. G6P → F6P. Flux J =
\begin{equation}
\frac{V m P G I_{-} 2 \cdot\left(G 6 P-\frac{F 6 P}{K e q P G I_{-} 2}\right)}{K m P G I G 6 P_{-} 2 \cdot\left(1.0+\frac{G 6 P}{K m P G I G 6 P \_2}+\frac{F 6 P}{K m P G I F 6 P_{-}2}\right)}
\end{equation}
ii. G6P → Glycogen
Flux J = KGLYCOGEN_3
iii. G6P → Trehalose
Flux J = KTREHALOSE
Now let's run a simulation of the yeast glycolysis model (Teusink, B. et al.: Eur J Biochem 2000 Sep;267(17):5313-29). The actual model is available from Biomodels (BIOMD0000000064).
Yeast Glycolysis
Yeast Glycolysis
Teusink et al., 2000. BIOMD0000000064
For Figure \(\PageIndex{14}\) below, the model was run, and the CSV file was used to plot the concentration vs. time plots for each species. Two species, EtOH (50 mM) and GLCo (glucose outside, 50 mM), have fixed concentrations much higher than the others. Hence, they are omitted from the graph for clarity. When you run the simulation above, repeat the process by downloading the CSV file and plotting the progress curves. Also, note that the y-axis values are incorrect in the simulation. Rescale them in the spreadsheet using the correct values of EtOH and GLC0, which were held constant (clamped) at 50 mM throughout the time course.

Figure \(\PageIndex{14}\): Time course graphs of all glycolytic species vs time
How closely does simulation replicate fluxes found experimentally in vivo? As mentioned above, without adding the branch reaction, the simulation did not reach steady state. Model fluxes were within a factor of two for only about half of the enzymes, indicating that the model needs improvement. Other discrepancies could be attributed to differences between in vivo and in vitro kinetics. Additional products (glycogen, trehalose, glycerol, and succinate) were derived from glucose, which mainly entered glycolysis and was converted to ethanol, highlighting the complexity of modeling even a relatively "simple" pathway like glycolysis.
Metabolic Control Analysis and Simple Enzyme Inhibition
Biochemists model complex enzyme-catalyzed reactions in the presence and absence of modifiers (either activators or inhibitors) to develop reaction mechanisms. The following kinetic parameters were determined experimentally by fitting initial velocity (vo) vs. substrate concentration ([S]) using nonlinear fitting algorithms.
- Km – the Michaelis Constant, the concentration of substrate at half-maximal velocity;
- Vm – the velocity at saturating substrate concentration;
- kcat - the turnover number for conversion of bound reactant to product;
- Kix – inhibition dissociation constants.
An example of competitive inhibition, shown in Figure \(\PageIndex{15}\), illustrates a common type of analysis for such reactions.
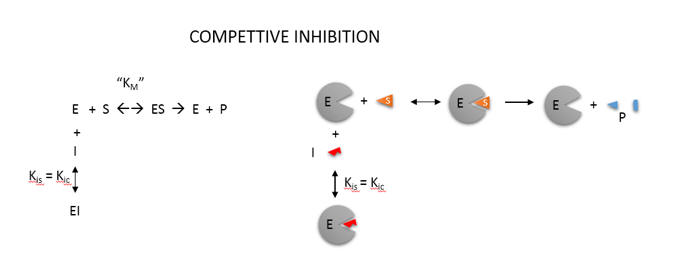
One modern pictorial depiction of a simple irreversible, enzyme-catalyzed reaction of substrate S going to product P with inhibition by the product and by an added inhibitor is shown in Figure \(\PageIndex{16}\). The square, a "node" in the reaction diagram, represents the enzyme.

Consider the simple enzyme-catalyzed reaction for a reversible conversion of substrate S to product P that has three reversible steps, as shown in Figure \(\PageIndex{17}\)

If the forward (f) and reverse (r) chemical reaction steps were irreversible and written separately, simple Michaelis-Menten equations could be written for each.
\begin{equation}
\begin{aligned}
&v_f=\frac{V_f S}{K_{M S}+S}=\frac{\frac{V_f S}{K_{M S}}}{1+\frac{S}{K_{M S}}} \\
&v_r=\frac{V_r P}{K_{M P}+P}=\frac{\frac{V_r P}{K_{M P}}}{1+\frac{P}{K_{M P}}}
\end{aligned}
\end{equation}
For the actual reversible reactions, the net forward rate cannot be found by simple subtraction of the two equations above, as the differential equations describing the simple forward and reverse rates don’t account for the reverse steps
\begin{equation}
v \neq\left[\frac{\frac{V_f S}{K_{M S}}}{1+\frac{S}{K_{M S}}}-\frac{\frac{V_r P}{K_{M P}}}{1+\frac{P}{K_{M P}}}\right]
\end{equation}
A derivation (assuming rapid equilibrium for both forward and reverse steps) can be made for the net forward reaction. Again, consider the following enzyme-catalyzed reaction (Figure 17 above):
Here it is if you wish to see it!
- Derivation
-
You may remember that for the isolated E + S ↔ ES and for the E + P ↔ EP reactions, the simple dissociation constants, KS and KP are given by
\begin{equation}
\begin{aligned}
&K_S=\frac{E_{e q} S_{e q}}{E S_{e q}}=\frac{k_{-1}}{k_1} \text { or } E S=\frac{[E][S]}{K_S} \\
&K_P=\frac{E_{e q} P_{e q}}{E P_{e q}}=\frac{k_3}{k_{-3}} \text { or } E P=\frac{[E][P]}{K_P}
\end{aligned}
\end{equation}The rapid equilibrium assumption states that the rate of dissociation of ES and EP, which are both physical steps, is much faster than the rate of the chemical conversion steps for each complex. Hence, \(k_{-1} \gg k_2\) and \(k_3 \gg k_{-2}\), so the relative amounts of ES and EP can be determined from the dissociation constants as shown above.
Mass conservation of enzymes gives
\begin{equation}
E_0=E+E S+E P=E+\frac{[E][S]}{K_S}+\frac{[E][P]}{K_p}=E\left[1+\frac{[S]}{K_S}+\frac{[P]}{K_p}\right]
\end{equation}From this, we can get the fractional amount of both ES and EP
\begin{equation}
\begin{aligned}
&\frac{E S}{E_0}=\frac{\frac{[E][S]}{K_S}}{E\left[1+\frac{[S]}{K_S}+\frac{[P]}{K_p}\right]} \text { or } E S=\frac{E_0 \frac{[S]}{K_S}}{\left[1+\frac{[S]}{K_S}+\frac{[P]}{K_p}\right]} \\
&\frac{E P}{E_0}=\frac{[E][P]}{E\left[1+\frac{[S]}{K_S}+\frac{[P]}{K_P}\right]} \text { or } E P=\frac{E_0 \frac{[P]}{K_P}}{\left[1+\frac{[S]}{K_S}+\frac{[P]}{K_P}\right]}
\end{aligned}
\end{equation}Now, we can derive the rate equation for the net forward reaction for the rapid equilibrium case:
\begin{equation}
v=k_2[E S]-k_{-2}[E P]=k_2 \frac{E_0 \frac{[S]}{K_S}}{\left[1+\frac{[S]}{K_S}+\frac{[P]}{K_p}\right]}-k_{-2} \frac{E_0 \frac{[P]}{K_p}}{\left[1+\frac{[S]}{K_S}+\frac{[P]}{K_p}\right]}
\end{equation}Knowing that k2E0 and k-2E0 represent the maximal velocities, Vf and Vr, respectively, the equation becomes:
\begin{equation}
v=k_2[E S]-k_{-2}[E P]=\frac{V_f \frac{[S]}{K_S}}{\left[1+\frac{[S]}{K_S}+\frac{[P]}{K_p}\right]}-\frac{V_r \frac{[P]}{K_p}}{\left[1+\frac{[S]}{K_S}+\frac{[P]}{K_p}\right]}=\frac{V_f \frac{[S]}{K_S}-V_r \frac{[P]}{K_p}}{\left[1+\frac{[S]}{K_S}+\frac{[P]}{K_p}\right]}
\end{equation}
Here is the derived equation.
\begin{equation}
v=k_2[E S]-k_{-2}[E P]=\frac{V_f \frac{[S]}{K_S}}{\left[1+\frac{[S]}{K_S}+\frac{[P]}{K_p}\right]}-\frac{V_r \frac{[P]}{K_p}}{\left[1+\frac{[S]}{K_S}+\frac{[P]}{K_p}\right]}=\frac{V_f \frac{[S]}{K_S}-V_r \frac{[P]}{K_p}}{\left[1+\frac{[S]}{K_S}+\frac{[P]}{K_p}\right]}
\end{equation}
An equation of a similar form can be derived from the steady-state assumption. Hence, the net forward rate can't be determined by the simple subtraction of the backward rate from the forward rate, as shown in Equation 10 above.
Common Forms of Kinetic Equations
Programs like COPASI and VCell have many built-in equations for the velocities of many enzyme-catalyzed reactions with similar forms. Two are shown below:
Reversible Michaelis-Menten:
\begin{equation}
\frac{\frac{V_f[\text { substrate }]}{K_{M s}}-\frac{V_r[\text { product }]}{K_{M p}}}{1+\frac{[\text { substrate }]}{K_{M s}}+\frac{[\text { product }]}{K_{M p}}}
\end{equation}
Competitive Inhibition Reversible:
\begin{equation}
\frac{\frac{V_f[\text { substrate }]}{K_{M s}}-\frac{V_r[\text { product }]}{K_{M p}}}{1+\frac{[\text { substrate }]}{K_{M s}}+\frac{[\text { product }]}{K_{M p}}+\frac{[\text { inhibitor }]}{K_I}}
\end{equation}
What matters most is not detailed derivations or solving the differential equations on your own. However, you should be able to:
- write the differential equation of a given reaction.
- recognize the common equations used for nonenzyme-catalyzed reactions (mass action) and enzyme-catalyzed ones;
- change parameters in programs that use numerical methods to solve systems of linked differential equations for a system, and see how the time course graphs are affected.
Summary
(Summary written by Claude, Sonnet 4.6, Anthropic)
This chapter introduces metabolic control analysis and computational modeling as essential tools for understanding how complex, interconnected enzyme-catalyzed pathways behave as integrated systems rather than collections of isolated reactions.
The chapter opens with a widely underappreciated conceptual distinction: the fundamental difference between enzyme kinetics studied in vitro and enzyme behavior in vivo. In vitro, the biochemist holds enzyme concentration constant and varies substrate concentration, treating it as the independent variable that determines velocity. In vivo, within a pathway operating at steady state, this relationship is inverted — the reaction velocity determines the substrate concentration. This distinction is not merely semantic; it fundamentally changes how metabolic flux must be analyzed and modeled. Students are urged to internalize this inversion as a threshold concept.
The chapter then carefully develops the concept of steady state through two complementary approaches. First, a simple closed reversible reaction (S ↔ P) reaches a true dynamic equilibrium in which concentrations stop changing because forward and reverse rates are equal. Second, when that same reaction is embedded within a pathway (A ↔ S ↔ P ↔ Q) with nonzero input and output fluxes, the concentrations of S and P reach a steady state — constant over time but not at thermodynamic equilibrium — because the rate of consumption equals the rate of production for each intermediate. VCell simulations make this concrete: when the rate constant for P → Q removal is increased dramatically, the apparent Keq for S ↔ P deviates significantly from its true value, illustrating how downstream reactions can pull an upstream equilibrium away from its thermodynamic position. Animations of particle-level simulations reinforce the distinction between equilibrium (symmetric, balanced) and steady state (directional, sustained flux).
The chapter then scales from single reactions to entire pathways. Quantitative modeling of a complex pathway such as yeast glycolysis requires four categories of input: a defined reaction network (available from databases such as KEGG and BioModels), a computational platform capable of numerically solving large systems of ordinary differential equations (VCell, COPASI, Tellurium), a complete table of kinetic and thermodynamic parameters for each enzyme, and initial concentrations for all species. ODEs are written for each species by summing the fluxes that produce it (positive terms) and consume it (negative terms); for glucose-6-phosphate, for example, the ODE includes contributions from hexokinase (formation), phosphoglucoisomerase, glycogen synthesis, and trehalose synthesis (all removal). The Teusink yeast glycolysis model (BIOMD0000000064) illustrates both the power and the limitations of this approach: the model could not achieve a realistic steady state without including branching reactions to trehalose, glycerol, and succinate, and even then, modeled fluxes matched experimental measurements for only about half the enzymes within a factor of two — a sobering demonstration of the gap between in vitro kinetic parameters and in vivo behavior.
The chapter closes with the kinetic formalism needed to describe reversible, inhibited enzyme-catalyzed reactions within these models. For a three-step reversible reaction (E + S ↔ ES ↔ EP ↔ E + P), the net forward rate cannot be obtained by subtracting the reverse Michaelis-Menten expression from the forward one; a proper derivation under rapid equilibrium assumptions yields a coupled expression containing both Km fwd, Km rev, Vmax fwd, Vmax rev, and Ki, and the concentrations of both S and P. Competitive inhibition of the reversible reaction introduces an additional K<sub>i</sub> term in the denominator. These are the kinetic equations built into programs like COPASI and VCell, and readers are expected to write ODEs, recognize standard kinetic equation forms, and manipulate parameters in computational models to observe how time-course graphs respond—rather than solve differential equations analytically.
This page titled 14.2: Basic Principles of Metabolic Control Analysis (MCA) was last modified on Sat, 12 Sep 2026 23:34:15 GMT and is shared under a not declared license and was authored, remixed, and/or curated by Henry Jakubowski and Patricia Flatt.
The book could not be loaded just now.