Opening the book…
Search Fundamentals of Biochemistry
(Learning goals written by Claude, Sonnet 4.6, Anthropic)
Principles of Metabolic Control Analysis
- Define the Flux Control Coefficient (\(C_{Ei}^{J}\)), explain its mathematical meaning as the fractional change in pathway flux relative to the fractional change in a single enzyme's concentration or activity, and interpret the Summation Theorem \(\sum_{i=1}^{n} C_{E i}^{J}=1\) as evidence that flux control is distributed across all enzymes in a pathway rather than concentrated in a single rate-limiting step.
- Explain why the classical concept of a single "rate-limiting enzyme" is an oversimplification, using the Summation Theorem and the observation that end-product feedback inhibition distributes control throughout a pathway to support the argument.
- Interpret a sensitivity analysis table of flux control coefficients for yeast glycolysis, explaining why perturbation of any single enzyme affects the fluxes of all other pathway steps, why adjacent unbranched steps share identical steady-state flux values, and why the three thermodynamically favored enzymes (hexokinase, PFK, pyruvate kinase) paradoxically have small flux control coefficients.
Aerobic Glycolysis and the Warburg Effect
- Define the Warburg effect quantitatively using the ratio W = JLac/Jox, describe the conditions under which W is high versus low, and explain the key metabolic factors — including growth rate, mitochondrial activity, and cytoplasmic NAD⁺/NADH balance — that determine whether pyruvate is routed to lactate or to mitochondrial oxidative phosphorylation.
- Explain the computational and experimental evidence supporting GAPDH as the primary flux-controlling enzyme in aerobic glycolysis, including the role of elevated fructose-1,6-bisphosphate concentrations creating a "bottleneck" that impairs GAPDH-mediated flux through the lower half of glycolysis, and describe how this finding challenges the conventional emphasis on hexokinase and PFK as the principal regulators of glycolytic flux.
- Describe how flux control coefficients were experimentally determined in the aerobic glycolysis model using ¹³C-labeled lactate measurements combined with selective enzymatic inhibition, and explain how negative flux control coefficients for certain steps (including PFK and HK) were interpreted.
Computational Modeling as a Tool in Systems Biology
- Explain how computational models of metabolic pathways (such as the Teusink yeast glycolysis and Shestov aerobic glycolysis models) are constructed, validated against experimental data, and used to identify which parameters most strongly influence pathway flux — distinguishing between predictions based on in vitro kinetics alone and those informed by in vivo measurements.
Introduction
Metabolic control analysis (MCA) is one method used to address the complexity of dynamic changes of species in a complex metabolic system. As such, understanding MCA applies to complex signal transduction pathways and other emerging areas in systems biology. In MCA, external inputs (sources) and outputs (exits), as well as pools and reservoirs, exist. These connect to the internal metabolic enzymes, reactants, and products of the pathway linking the two external reservoirs.
In studying complex metabolic systems, what matters is not just the KM or VM of particular enzymes (such as those far from equilibrium or catalyzing “rate-limiting” steps based on in vitro studies), but the system's control parameters, known as control coefficients. These coefficients are properties of the whole pathway as an emergent system with properties different from those of the individual steps. Another example of an emergent property is consciousness. It must emerge from the incredible assembly of around 90 billion neurons in the brain, forming around 1015 synapses. It cannot simply be predicted from the properties of isolated neurons. Metabolic control analyses use three especially relevant parameters: the Flux Control Coefficient, the Concentration Control Coefficient, and the Elasticity Coefficient.
To understand how a pathway is regulated and how scientists modify it to meet their demands, one needs to understand these coefficients. In particular, we would like to know which:
- parameters have the greatest effect (increase or decrease) on a preferred outcome;
- properties of the system make it most resilient or fragile;
- parameters should be measured most accurately
The Flux Control Coefficient
The Flux Control Coefficient (\(C_{Ei}^{J}\)) gives the relative fractional change in pathway flux \(J\) (\(dJ/J\)) (a system variable) with fractional change in concentration or activity of an enzyme \(Ei\) (\(du_i/u_i\)). The change in an enzyme's concentration can arise from increased synthesis or degradation, a change in a modifier (an inhibitor or activator), covalent modification, the presence of inhibitor RNA, mutations, etc. Again, the word flux \(J\) is used to describe the rate of the system, whereas rate or velocity \(v\) is used to describe an individual enzyme in the system. Think of \(u\) as “units” of activity.
The Flux Control Coefficient (\(C_{Ei}^{J}\)) can also be written as
\[C_{Ei}^{J}=\dfrac{d J}{d u} \dfrac{u}{J} \label{15} \]
The \(dJ/du\) in Equation \ref{15} suggests that the \(C_{Ei}^{J}\) is equal to the slope of a plot of \(J\) vs u multiplied by \(u/J\) at that point. Alternatively, it is the slope of an ln-ln plot of \(\ln J\) vs \(\ln u\). A more formal definition would be obtained using partial derivatives (a normal derivative like dy/dx with every other variable held constant) - in this case, all other enzyme concentrations or activities other than the one under study:
\[C_{E i}^{J}=\dfrac{\dfrac{\partial J}{J}}{\dfrac{\partial u}{u}}=\dfrac{\partial \ln J}{\partial \ln u_{i}} \label{16} \]
\(C_{Ei}^{J}\) clearly shows how the system flux changes with changes in the activity of a single enzyme. The variable ui is a property of an enzyme (a local property), but J and concentrations (for the concentration coefficient – see below) are system variables. Hence, every enzyme in a pathway has a flux control coefficient. How are they related? It makes sense that the sum of all of the individual \(C_{Ei}^{J}=1\) as the fractional change in flux, \(∂J/J\), is equal in magnitude to the fractional change in all enzyme activities. This relationship, shown below, is called the Summation Theorem.
\[\sum_{i=1}^{n} C_{E i}^{J}=1 \label{17} \]
This equation predicts that if one magical enzyme X were truly rate-limiting and completely controlled that rate, then CJEx = 1 for that enzyme and 0 for all other enzymes. Yet this is counterintuitive since if all the enzymes are linked, their responses should also be linked. Hence, all enzymes share control of flux.
Another way to consider this is to consider a linear set of connected reactions. For these enzymes, \(C_{Ei}^{J}\) would vary between 0 and 1. If one enzyme was completely rate-limiting, its \(C_{Ei}^{J}\) = 1, indicating that the fractional change in flux, \(∂J/J\), is equal to the fractional change in enzyme concentration (or activity) \(u\), \(∂u/u\), for enzyme X. This implies that all change in flux is accounted for by the change in the concentration of enzyme X. This is a bit difficult to believe, so it would make sense to think of the control of a pathway as being distributed over all the enzymes in the pathway. Plots of flux \(J\) vs enzyme activity u are similar to rectangular hyperbolas. Hence, the flux coefficient changes with enzyme activity and flux, so at different fluxes, different enzyme flux coefficients would also change. “Control” gets redistributed in the pathway.
Textbooks often describe the first step of a linear pathway as the committed step and the rate-limiting step. But think of this. If the end product of a pathway feeds back and inhibits the first enzyme in the pathway, then the last enzyme influences the first enzyme, although the last is not considered “rate-limiting”. Now, if another enzyme removes the last product and hence the first enzyme's feedback inhibitor of the pathway, that enzyme also determines flux. This again shows that flux control is distributed throughout the system. The classical “rate-limiting” enzyme might still have the largest \(C_{Ei}^{J}\) of the pathways, but if the system is in a steady state, all enzymes have the same rate. Hence, the term “rate-limiting” is somewhat misleading in a pathway. Analysis of flux control coefficients gives a truly quantitative analysis of the system pathway.
Phosphofructokinase is said to be a “key” enzyme in glycolysis because it is one of three enzymes in the pathway characterized by a large negative free energy difference. Figure \(\PageIndex{1}\):
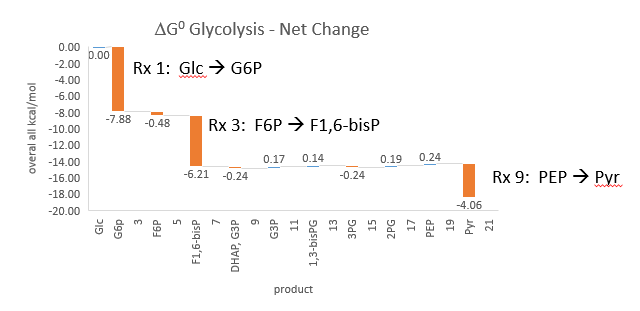
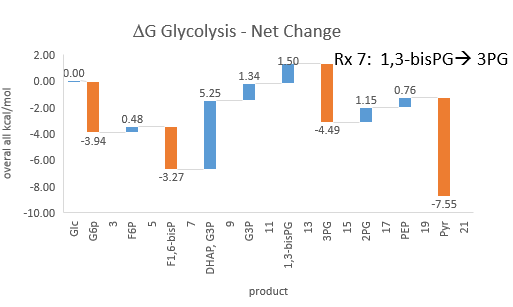
Figure \(\PageIndex{1}\): ΔG0 and ΔG values for enzymes in glycolysis
It is also highly regulated. However, Heinisch et al. (Molecular and General Genetics, 202, 75-82) found that increasing its concentration 3.5-fold in fermenting yeast did not affect ethanol production flux.
Here are some results of "sensitivity analyses" of yeast glycolysis showing the effect of small changes (up to 5%) on the flux control coefficients of glycolytic enzymes. The enzyme changes in these analyses are 1%. The numbers are scaled values that represent a relative change. A value of +0.5 means that if the parameter increases by 10%, the target value increases by 5%. A column shows the rate of the changed reaction, and the row indicates the flux of the affected reaction. Green represents positive values and red represents negative values, with the color intensity correlating with the extent of the change. The table is split, with column 1 headings of the first table applying to tables 2 and 3 as well.
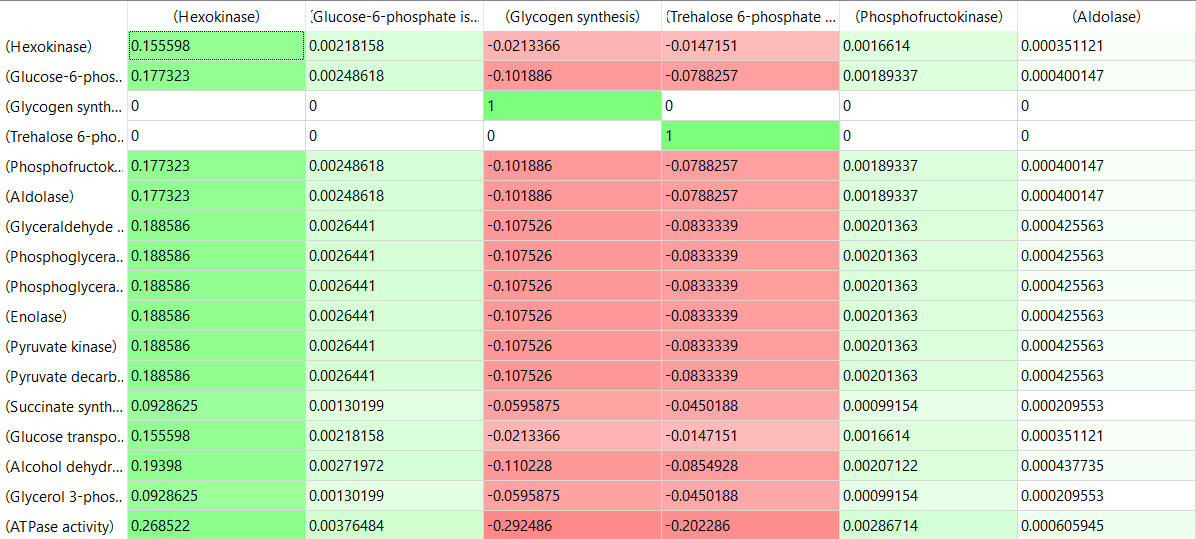
Table, part 2, continued:
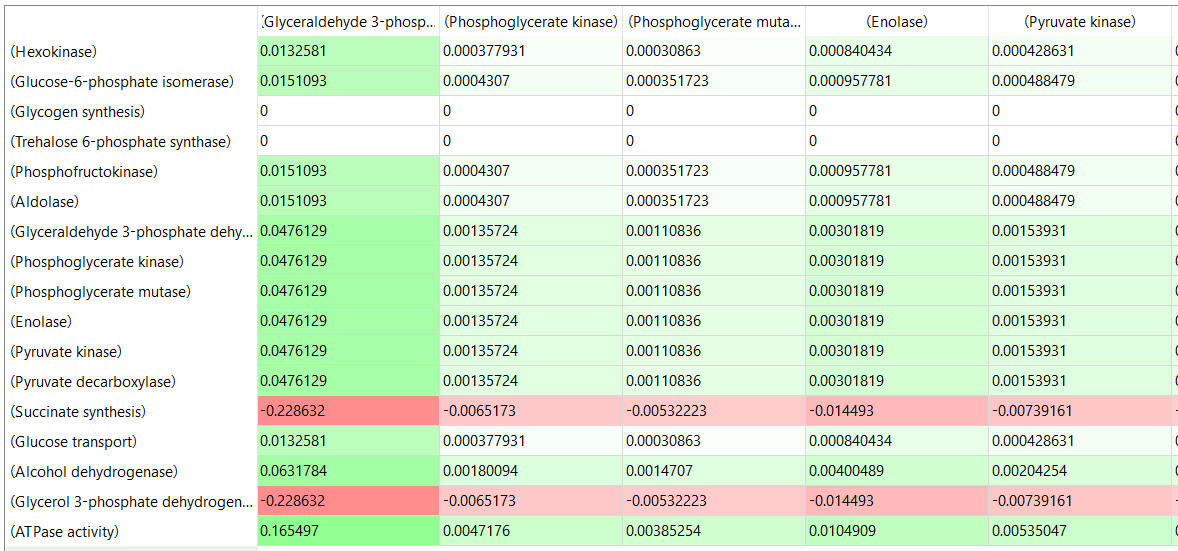
Table, part 3, continued
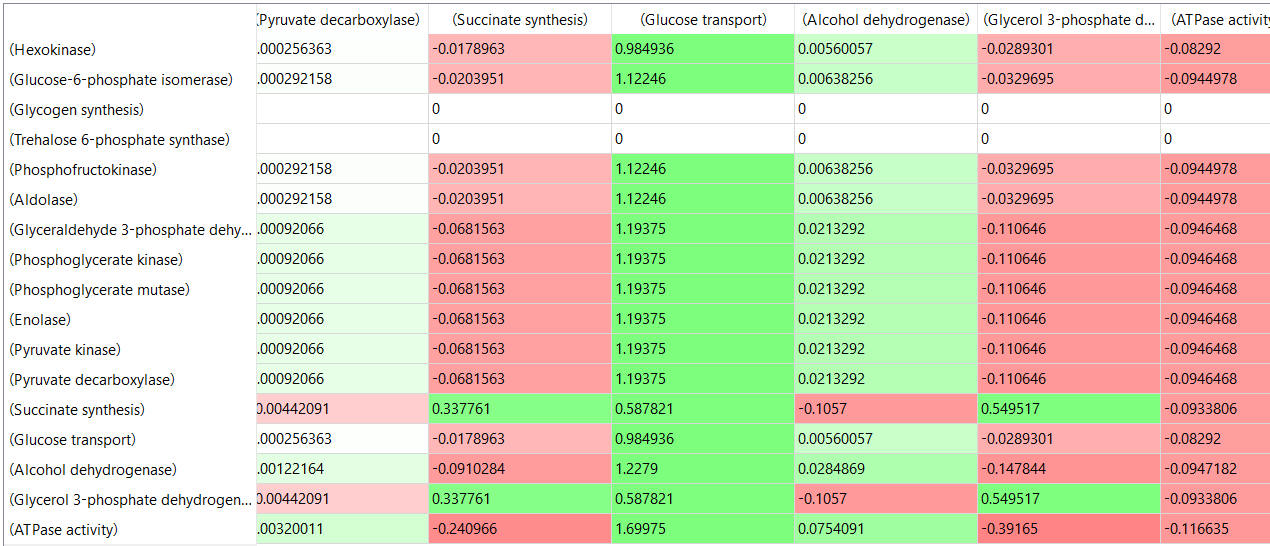
Some things to note:
- almost everything has changed in each column, which shows that a change in one enzyme affects all enzymes;
- 2 adjacent rows often have identical numbers since they describe two connected reactions (without branches), so their steady-state fluxes will be the same;
- the sum of the \(C_{Ei}^{J}\) values across the same row in both tables is 1 (summation theorem);
- perturbations of the "big 3" enzymes for steps 1,3, and 10 in glycolysis (hexokinase, phosphofructokinase, and pyruvate kinase), all of which proceed with a significant -ΔG0 and -ΔG, have minor effects on the flux.
These results show that you can't predict the enzymes that control flux without this kind of mathematical analysis. Don't rely on just your "biochemical intuition."
Flux Control in Aerobic Glycolysis
Let's look at another pathway to run a full simulation using VCell - aerobic glycolysis. We have mostly encountered glycolysis as a central anaerobic pathway in almost all organisms. In some cases, it can also run aerobically. One prime example is cancer cells, which require both energy in the form of ATP and anabolic building blocks to proliferate - a hallmark of cancer cells. Warburg noted aerobic glycolysis, and this effect now bears his name.
Yeast cells have been used to model aerobic glycolysis. The pathway is shown in Figure \(\PageIndex{2}\) below.

Figure \(\PageIndex{2}\): Schematic of the glycolysis model with chemical reactions and allosteric points of regulation described. Alexander A Shestov et al. (2014) Quantitative determinants of aerobic glycolysis identify flux through the enzyme GAPDH as a limiting step. eLife 3:e03342. https://doi.org/10.7554/eLife.03342. Creative Commons Attribution License
Abbreviations: GLC—glucose, G6P—glucose-6-phosphate, F6P—fructose-6-phosphate, FBP—fructose-1,6,-bisphosphate, F26BP—fructose-2,6,-bisphosphate, GAP—glcyceraldehyde-3-phosphate, DHAP—dihydroxyacetone phosphate, BPG—1,3 bisphosphoglycerate, 3PG—3-phosphoglycerate, 2PG—2-phosphoglycerate, PEP—phosphoenolpyruvate, PYR—pyruvate, SER—Serine, GLY—glycine, Lac—lactate, MAL—malate, ASP—aspartate, Pi—inorganic phosphate, CI—creatine, PCI—phosphophocreatine, GTR—glucose transporter, HK—hexokinase, PGI—phosphoglucoisomerase, PFK—phosphofructokinase, ALD—aldolase, TPI—triosephosphoisomerase, GAPDH—glyceraldehyde-phosphate dehydrogenase, PGK—phosphoglycerate kinase, PGM—phosphoglycerate mutase, ENO—enolase, PK—pyruvate kinase, LDH—lactate dehydrogenase, MCT—monocarboxylate transporter, PDH—pyruvate dehydrogenase, CK—creatine kinase.
The Warburg Effect W can be quantitatively described by the ratio of the flux of pyruvate to lactate (JLac) compared to the flux of pyruvate entry into the mitochondria and subsequent consumption of O2 by mitochondrial oxidative phosphorylation (Jox), so W = JLac/Jox).
Usually, under normal conditions in healthy cells, W < 0.10, so less than 10% of glucose is converted (or diverted) to lactate. On average, W < 0.3 across different tissues. Therefore, some lactate is always produced. High values of W (> 1) mean that most of the glucose is diverted to lactate synthesis. The W value depends on many factors that determine the cell's energy state, including rates of glucose uptake, ATP hydrolysis, and biosynthesis, as well as the balance of cytoplasmic and mitochondrial NAD+/NADH, and thus the cell's redox state. A key part of the balance that supports aerobic glycolysis is reoxidizing cytosolic NADH to NAD+ under aerobic conditions so glycolysis can continue when growth rates are high.
How does a cell know which path to take, pyruvate to lactate (anaerobic), pyruvate to CO2 with ATP synthesis (aerobic), or some of both? From metabolic control analysis, what controls the flux of pyruvate through these paths? This is where computational modeling informed by experimental data helps. We can determine the flux control coefficient (\(C_{Ei}^{J}\)), more easily written as FCC, for each enzyme in glycolysis to help us understand what controls the flux. Figure \(\PageIndex{3}\) metaphorically describes these different paths. In a way, the flux of pyruvate through these three choices, anaerobic, aerobic, and both (as reflected by the Warburg effect W), is an optimal example to use to discuss flux control since the readers are likely very familiar with the concept of anaerobic and aerobic metabolism and the "switch" between them when running short sprints vs marathons.

Figure \(\PageIndex{3}\): Fluxes of pyruvate through multiple paths
Now let's run the VCell model for aerobic glycolysis in yeast.
 MODEL
AerobicGlycolysis
Quantitative determinants of aerobic glycolysis identify flux through the enzyme GAPDH as a limiting step. .Shestov AA, Liu X, Ser Z, Cluntun AA, Hung YP, Huang L, Kim D, Le A, Yellen G, Albeck JG, Locasale JW. eLife , 7/ 2014 , Volume 3 , PubMed ID: 25009227. Biomodel MODEL1504010000

Select Load [model name] below
Select Start to begin the simulation.
Select Plot to change Y axis min/max, then Reset and Play | Select Slider to change which constants are displayed | Select About for software information.
Move the sliders to change the constants and see changes in the displayed graph in real-time.
Time course model made using Virtual Cell (Vcell), The Center for Cell Analysis & Modeling, at UConn Health. Funded by NIH/NIGMS (R24 GM137787); Web simulation software (miniSidewinder) from Bartholomew Jardine and Herbert M. Sauro, University of Washington. Funded by NIH/NIGMS (RO1-GM123032-04)
Where did all the parameters in the model come from? They are derived experimentally, and the goal of modeling is to produce a computational model consistent with the experimental findings fed into it.
The model suggests that the Warburg effect is determined by cell growth rate as well as mitochondrial activity. The model does not support the idea that aerobic glycolysis balances energy needs and new biosynthesis as cells proliferate. Rather, the cells that proliferate the most have the most active mitochondria and, hence, lower levels of lactate production. Redox balance is key in pushing cells toward lactate synthesis and aerobic glycolysis.
Glyceraldehyde-3-phosphate dehydrogenase (GAPDH) catalyzes a key step and separates the top and bottom halves of glycolysis. Experimental data show that flux through this enzyme is rate-limiting, and that F1,6-BP levels are also very important. Some key steps thought to be rate-limiting had negative fluxes. Negative flux control coefficients were found and confirmed for several steps thought to be rate-limiting in glycolysis.
The flux control coefficients, given by the formula
\begin{equation}
C_{E i}^J=\frac{\frac{\partial J}{J}}{\frac{\partial u}{u}}=\frac{\partial \ln J}{\partial \ln u_i}
\end{equation}
were calculated for each enzyme in the glycolytic pathway. The authors of the study used this equation for the Flux Control Coefficient:
\begin{equation}
F C C=\frac{d \ln \left[J_{L A C T}\right]}{d \ln \left[E_i\right]}
\end{equation}
The fluxes for lactate production were measured using 13C-labeled lactate to obtain absolute lactate concentration. Fluxes were then measured by changes in 13C-lactate production with time. The FCC of each enzyme could be calculated using these data and the selective inhibition by small drugs of each step in glycolysis to alter the "concentration/activity of the enzyme". The results are shown in Figure \(\PageIndex{4}\) below.

Figure \(\PageIndex{4}\): (left) Box plots of flux control coefficient (FCC) for lactate production for each enzymatic step in glycolysis (FCC = dlnJlac/dln Ei), where Jlac is the rate of pyruvate conversion to lactate, and Ei is the ith enzyme in glycolysis for each step of glycolysis. (right) Box plots of flux control coefficient (FCC) for lactate production, oxygen consumption (OxPhos), and ATP consumption (ATP). Shestov et al., ibid
The left-hand side of Figure 4 shows that two of the key enzymes that are thermodynamically favored in glycolysis, PFK (phosphofructokinase) and HK (hexokinase), both driven by ATP hydrolysis, have essentially negative flux coefficients, so they are NOT key in driving flux toward lactate. Only one enzyme, GAPDH, has a positive flux coefficient. (Remember, we are talking about flux coefficients, not the Warburg effect factor W.)
Also important, as mentioned above, is the concentration of F1,6BP (FBP in the figure below). The model and data show that high levels of FBP and associated higher concentrations of the reactants in the first half of glycolysis (denoted by ↑↑ a large font size). A corresponding depletion of substrates in the bottom half (denoted by ↓↓) actually causes a bottleneck in glycolysis and inhibits flux through GAPDH. Hence, GADPH determines the flux through glycolysis. This "bottleneck" is linked to the cell's redox and energy states. These outcomes are illustrated in Figure \(\PageIndex{1}\) below.
Figure \(\PageIndex{5}\):

Figure \(\PageIndex{5}\): A unified model of aerobic glycolysis. Shestov et al., ibid
When there is a balance of metabolites in the top and bottom halves of glycolysis (right-hand size), including both high levels in both top and bottom (denoted by ↑↑ and font size) or low levels in both (denoted by ↓↓ and font size), no bottleneck at GAPDH exists, and flux through glycolysis is determined by the usual "suspects", hexokinase and phosphofructokinase.
The results described above are those predicted by computational modeling. Do experimental data support the model? The only way to know is to test the model. This was done by using drugs to inhibit each enzyme in glycolysis. This offers an effective way to change the "effective" concentration or activity of the enzyme. From these data, flux changes due to changes at each step could be determined. These data supported the computation results: GADPH regulates aerobic metabolism in normal and proliferative conditions. When the top-half substrates were elevated, GADPH determined the flux blockade. In Chapter 13, we studied the glycolytic enzymes and the myriad of small molecules that control the activity of the three major enzymes with the biggest thermodynamic push, HK, PFK, and PK. GAPDH appears to be equally important. It is regulated by many mechanisms, including post-translational modifications such as nitrosylation and ROS-mediated modification of its active-site cysteine. This may help regulate the balance between anaerobic and aerobic glycolysis. Also, GAPDH is highly expressed in cells engaged in aerobic glycolysis.
Recent Updates: August 2, 2026
The following interactive graph and problems were created using Claude (Anthropic).
Interactive Graph and Problems - Flux Control Coefficient
Explore the interactive graph and questions below to better understand the Flux Control Coefficient
p>
Here are the answers.
Here they are.
- Answer
-
Using the model J = u₁u₂/(u₁+u₂), so C1 = u₂/(u₁+u₂) and C2 = u₁/(u₁+u₂):
1. u₁=0.2, u₂=8 → C1=0.976, C2=0.024. E1 is scarce relative to its partner, so nearly all flux control sits with it — matches the "rate-limiting" intuition: when one enzyme's activity is far below its partner's, flux is almost entirely sensitive to that one enzyme.
2. u₁=u₂=1 → C1=C2=0.5. Control is split evenly: a 1% change in either enzyme's activity moves flux by the same 0.5%. Neither enzyme alone sets the output — control is a property of the pair, not either enzyme individually.
3. u₁=10, u₂=1 → C1=1/11=0.091. As u₁ grows, J approaches its asymptote (J→u₂=1), so the curve flattens and dJ/du₁→0. E1 now has excess capacity relative to E2, so adding more of it barely changes flux — E2 has become the effective bottleneck. Control has shifted almost entirely to C2.
4. Algebraically, C1+C2 = u₂/(u₁+u₂) + u₁/(u₁+u₂) = (u₁+u₂)/(u₁+u₂) = 1, for any u₁, u₂ > 0 — so the sum is 1 no matter where the sliders sit (e.g., u₁=3, u₂=0.4 gives C1=0.118, C2=0.882, sum=1). This is the Summation Theorem falling directly out of the algebra.
5. u₁=1.5, u₂=4 → C1=4/5.5=0.727. The ln–ln tangent slope equals this same 0.727, since d(ln J)/d(ln u₁) = (dJ/du₁)(u₁/J) = C1 by definition — the log-log slope and the FCC are the same number by construction.
6. For E1 to behave like GAPDH, it needs low activity/capacity relative to its "partner" (u₁ small, u₂ large) — the same regime as question 1 — so its FCC sits near 1 even though nothing about ΔG entered the calculation. HK and PFK, despite large negative ΔG, would correspond to enzymes with ample spare capacity relative to their local partners, giving them small FCCs: thermodynamic favorability doesn't guarantee kinetic control. One caveat: this model is a simple unbranched chain, so all its FCCs stay between 0 and 1. The negative FCCs Shestov et al. found require the branching, feedback, and cofactor coupling (NAD+/NADH) that a two-enzyme linear model can't produce — worth noting as a limitation of the analogy.
Summary
(Summary written by Claude, Sonnet 4.6, Anthropic)
This chapter develops metabolic control analysis (MCA) as a rigorous quantitative framework for understanding how flux through complex, interconnected metabolic pathways is controlled, challenging the intuitive but oversimplified notion that a single "rate-limiting" enzyme governs the output of an entire pathway.
The central quantitative tool introduced is the Flux Control Coefficient (\(C_{Ei}^{J}\)), defined as the fractional change in steady-state pathway flux J relative to the fractional change in the concentration or activity of enzyme i. Mathematically, it equals the slope of a log-log plot of J versus enzyme activity, evaluated at a given operating point. A key constraint on these coefficients is the Summation Theorem (\(\sum_{i=1}^{n} C_{E i}^{J}=1\)), which states that the flux control coefficients of all enzymes in a pathway must sum to exactly 1. This theorem has a profound implication: if one enzyme were truly and completely rate-limiting, its coefficient would be 1, and all others would be 0. Yet this is mechanistically implausible for interconnected pathways, because any change in the activity of one enzyme propagates through the steady-state concentrations of all intermediates, thereby affecting all other enzymes. Control is therefore distributed throughout the system, and the coefficients change as flux and enzyme activities change — there is no fixed "rate-limiting step." The classic example of feedback inhibition reinforces this point: the last enzyme in a pathway that removes the end-product inhibitor of the first enzyme indirectly controls that first enzyme's activity, even though it is nowhere near the "committed step."
This distributional nature of control is demonstrated dramatically by sensitivity analyses of the yeast glycolysis model. A table of flux control coefficients shows that perturbing any single glycolytic enzyme alters the fluxes of all others; adjacent unbranched steps share identical steady-state fluxes (as required by mass balance); the sum of coefficients across any row equals 1; and — most counterintuitively — the three enzymes traditionally emphasized as glycolytic regulators (hexokinase, PFK, and pyruvate kinase), which all proceed with large negative ΔG values, have surprisingly small flux control coefficients. Experimental confirmation of this came from the finding that overexpressing PFK 3.5-fold in yeast produced no measurable change in ethanol production flux.
The chapter then extends this framework to aerobic glycolysis and the Warburg effect — the preferential conversion of glucose to lactate even under aerobic conditions, observed in rapidly proliferating cancer cells and other tissues with high growth rates. The Warburg ratio W = JLac/Jox quantifies this effect; healthy tissues typically maintain W < 0.1–0.3, while cancer cells often achieve W > 1. The metabolic drivers of high W include elevated glucose uptake rates, high ATP hydrolysis demands, rapid biosynthesis, and — critically — the need to reoxidize cytoplasmic NADH to NAD⁺ under aerobic conditions so that glycolytic flux can continue. Computational modeling of aerobic glycolysis in yeast (Shestov et al.) combined with experimental flux measurements using ¹³C-labeled lactate and selective enzymatic inhibition identified an unexpected result: GAPDH, the enzyme separating the upper and lower halves of glycolysis, carries the largest positive flux control coefficient and is the primary determinant of lactate production flux. Hexokinase and PFK, by contrast, have negative or near-zero flux control coefficients for lactate flux under aerobic conditions. The mechanistic explanation involves a metabolic bottleneck: when the upper half of glycolysis produces intermediates — particularly fructose-1,6-bisphosphate — faster than the lower half can process them, GAPDH becomes the rate-determining node. This bottleneck is tied to the cellular redox state (NAD⁺/NADH ratio) and energy state, and GAPDH activity is regulated by multiple post-translational modifications including nitrosylation and oxidation of its active-site cysteine by ROS — mechanisms that may underlie the metabolic switch between aerobic and anaerobic glycolysis. The chapter concludes by reaffirming that computational modeling validated by experimental data is indispensable for identifying true flux controllers in complex pathways, and that biochemical intuition based on thermodynamics or regulatory complexity alone is insufficient and often misleading.
This page titled 14.3: The Flux Control Coefficient was last modified on Sat, 12 Sep 2026 23:41:28 GMT and is shared under a not declared license and was authored, remixed, and/or curated by Henry Jakubowski and Patricia Flatt.
The book could not be loaded just now.