Opening the book…
Overview
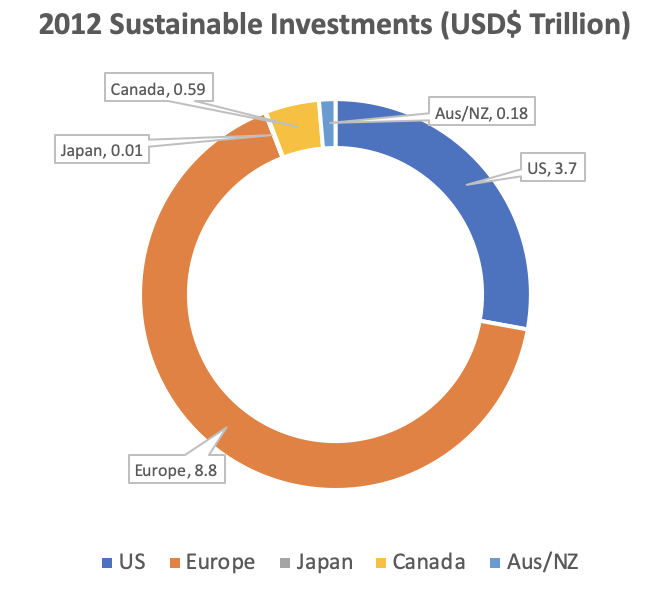
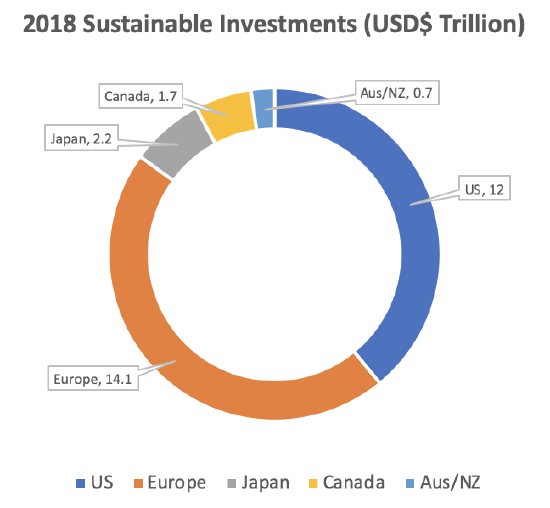
Climate change is the major focus of conversation across many different disciplines and interest groups. With a huge array of global sustainability challenges both now and in the future, investors are starting to re-evaluate where they want to spend their money. Today, sustainable investing is increasing exponentially! The graph below displays the global growth in sustainable investments between 2012 and 2018:
Questions
- What kind of graphs are these?
- What major differences are there between the 2012 graph and the 2018 graph?
- Which country(ies) is the major leader for sustainable investments?
- Are there any countries/regions that are not represented on the graph that you would have predicted would be there?
- Is there anything that surprises you about the results displayed in these graphs? Explain your answer.
Raw Data From Above Graph(s)
Table \(\PageIndex{a}\): Raw data from 2012 and 2018 global sustainable investments. Graph by Rachel Schleiger (CC-BY-NC) modified from data in Global Sustainable Investment Alliance 2019.
| Country/Continent | 2012 Investments (USD$ Trillion) | 2018 Investments (USD$ Trillion) |
|---|---|---|
| United States | 3.7 | 12 |
| Europe | 8.8 | 14.1 |
| Japan | 0.01 | 2.2 |
| Canada | 0.59 | 1.7 |
| Australia/New Zealand | 0.18 | 0.7 |
Attributions
Rachel Schleiger (CC-BY-NC)
This page titled 22.7: Data Dive- Sustainable Investments was last modified on Mon, 05 Sep 2022 19:40:39 GMT and is shared under a not declared license and was authored, remixed, and/or curated by Melissa Ha and Rachel Schleiger (ASCCC Open Educational Resources Initiative) .
The book could not be loaded just now.