Opening the book…
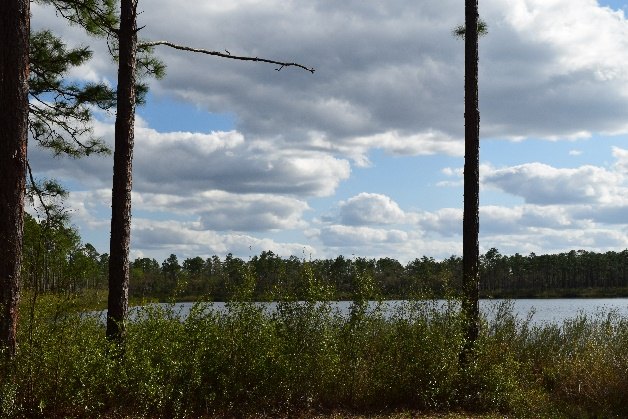
PPFD is the number of photosynthetically active photons that fall on a square meter of surface each second. This works well for instant readings – for recording what is happening “right now.” Two readings taken only minutes apart can vary greatly is a thick cloud obscured the sun for one of the measures but not the other (Figure 5-14). However, plant growth and development depend on what happening over longer periods of time – day, week, and month – so PPFD is not a great for determining how plants will respond.
Instead of PPFD, a measure referred to as the daily light integral (DLI) is used. It measures the number of PAR photons that accumulate in a square meter over the course of the day. The units of this measurement are moles per meter square per day (mol/m2/day).
The DLI range will vary from location to location and month to month. The map in Figure 5-15 shows the ranges of DLI for each month for the US. For most of Georgia, the DLI ranges from a low of 15-20 mol/m2/day (Dec & Jan) to a high of 40-45 mol/m2/day (April-July). As you move northward the DLI is lower particularly in the winter months. Although the northern latitudes (northern Canada and Alaska) experience only a few months of high DLI, their DLI during those months is high (50-55 mol/m2/day) due to their long day length.

The longer days of summer and shorter days of winter can account for the seasonal changes in DLI. The changes are most significant at the poles. This is demonstrated in Figure 5-16. The lines represent the apparent “path” of the sun across the horizon through the course of the day for an observer at 56°N latitude (just north of Port Moller Alaska and Moscow, Russia). The y-axis describes how far above the horizon the sun appears. Imagine you are standing outside at 56°N and are watching the sun rise and the set at different times of the year. On the Winter solstice (blue line, lowest line), the shortest day of the year in the Northern hemisphere, the sun rises only 40 degrees east of north and sets only 40 degrees west of north. Additionally, it only rises to a maximum of 10 degrees about the horizon. This means not only is there a very short window of light it is of extremely low quality as it passes through a significant thickness of the atmosphere. In contrast, at Summer solstice, the longest day of the year the sun rises sun rises only 120 degrees east of north and sets 120 degrees west of north (red line, upper most). The sun crests the sky about 60 degrees above the horizon. This makes it the longest day and the day with the greatest solar intensity at this latitude (although still lower than what would happen at the equator).

This page titled 5.3.1: Daily Light integral was last modified on Fri, 13 Nov 2026 15:04:27 GMT and is shared under a CC BY-NC-SA 4.0 license and was authored, remixed, and/or curated by .
The book could not be loaded just now.