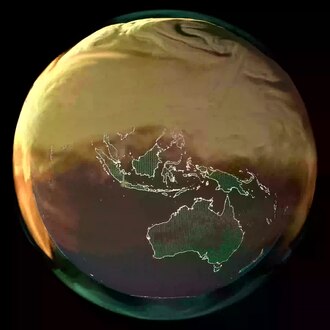
Atmospheric Carbon Dioxide Tagged by Source (SVS5110 - JanToDec2021 TaggedCO2 4-20-2023a co2 foursources sphere australasia decal 2160p30)
NASA's Scientific Visualization Studio - Andrew J Christensen, Mark SubbaRao, Brenda Lopez-Silva, Helen-Nicole Kostis, Lesley Ott, Ian Jones, Laurence Schuler
Space
Make a clip
Public domain · NASA's Scientific Visualization Studio - Andrew J Christensen, Mark SubbaRao, Brenda Lopez-Silva, Helen-Nicole Kostis, Lesley Ott, Ian Jones, Laurence Schuler
Up to 60 seconds, at most the picture size of the copy it is cut from. The clip carries the title, the credit, the licence and a link back here. It is made in this browser, and nothing is sent to this site.
Or send the moment itself: https://invisiblenetwork.ai/watch/archive/commons/137051872?play=1&t=0
Parts
About
This view highlights CO2 sources and sinks over Asia and Australia. The most notable feature is fossil fuel emissions from China, which contribute to the increasing atmospheric burden of CO2 over the course of 2021. In contrast, drawdown from the land biosphere is visible over Australia for much of the year because emissions and population density are much lower. By the end of the animation, fossil fuel emissions which are released predominantly in the Northern Hemisphere are mixing southward obscuring Australia.
Human-made No record of this work says a model made it. What this means.
- Archive
- Wikimedia Commons, in Wikimedia Commons
- Licence or status
- Public domain, as the Wikimedia Commons states it.
- Rights statement
- Public domain
- Credit
- NASA's Scientific Visualization Studio - Andrew J Christensen, Mark SubbaRao, Brenda Lopez-Silva, Helen-Nicole Kostis, Lesley Ott, Ian Jones, Laurence Schuler
- Who can watch
- The archive gives no rating. Invisible Network shows it to Tweens profiles and older, judged from its collection and subjects. How films are placed
More from Wikimedia Commons
 Short
Curiosity's Seven Minutes of Terror
 Short
Launch Recap NASA and SpaceX fly Astronauts to the Space Station
 Short
Space Station Live - Cultivating Plant Growth in Space
 Short
STS-132 Liftoff Space Shuttle Atlantis
 Short
Narrated Distributed Water Balance of the Nile Basin
 Short
Moon Phase and Libration, 2020 South Up 4K UHD
 Short
NASA's Mars 2020 Perseverance Rover Landing Animations-rzmd7RouGrM
 Short
Alexander Gerst’s Earth timelapses (2017 reissue)
 Feature
Restored Apollo 11 Moonwalk - Original NASA EVA Mission Video - Walking on the Moon
 Short
First 8K Video from Space - Ultra HD VP9
 Cartoon
Galaxy Collision Animation- James Webb Space Telescope Science
 Short