Opening the book…
To perform linear regression in R, we use the lm() function. Let’s generate some data and use this function to compute the linear regression solution.
npoints <- 100
intercept = 10
# slope of X/Y relationship
slope=0.5
# this lets us control the strength of the relationship
# by varying the amount of noise added to the y variable
noise_sd = 0.6

regression_data <- tibble(x = rnorm(npoints)) %>%
  mutate(y = x*slope + rnorm(npoints)*noise_sd + intercept)

ggplot(regression_data,aes(x,y)) +
  geom_point()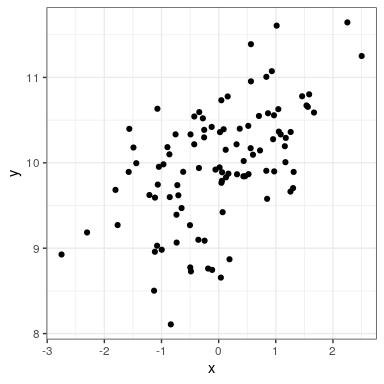
We can then apply lm() to these data:
lm_result <- lm(y ~ x, data=regression_data)
summary(lm_result)
##
## Call:
## lm(formula = y ~ x, data = regression_data)
##
## Residuals:
## Min 1Q Median 3Q Max
## -1.5563 -0.3042 -0.0059 0.3804 1.2522
##
## Coefficients:
## Estimate Std. Error t value Pr(>|t|)
## (Intercept) 9.9761 0.0580 172.12 < 2e-16 ***
## x 0.3725 0.0586 6.35 6.6e-09 ***
## ---
## Signif. codes: 0 '***' 0.001 '**' 0.01 '*' 0.05 '.' 0.1 ' ' 1
##
## Residual standard error: 0.58 on 98 degrees of freedom
## Multiple R-squared: 0.292, Adjusted R-squared: 0.284
## F-statistic: 40.4 on 1 and 98 DF, p-value: 6.65e-09We should see three things in the lm() results:
- The estimate of the Intercept in the model should be very close to the intercept that we specified
- The estimate for the x parameter should be very close to the slope that we specified
- The residual standard error should be roughly similar to the noise standard deviation that we specified
This page titled 27.1: Linear Regression (Section 26.1) was last modified on Mon, 11 Jan 2021 05:14:05 GMT and is shared under a CC BY-NC 4.0 license and was authored, remixed, and/or curated by Russell A. Poldrack via source content that was edited to the style and standards of the LibreTexts platform.
The book could not be loaded just now.