Opening the book…
In Minitab, specifying the mixed model is a little different.
In Stat > ANOVA > General Linear Model > Fit General Linear Model
we complete the dialog box:
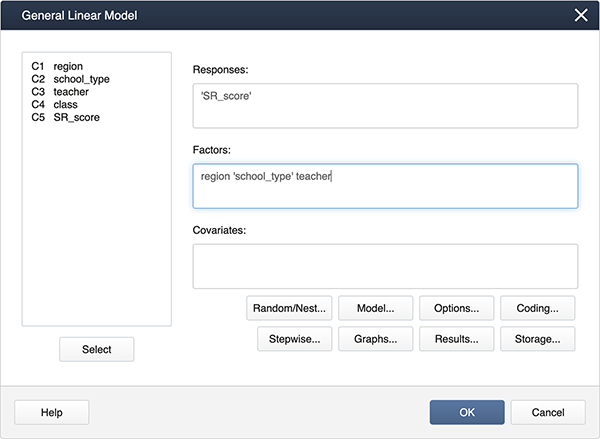
We can create interaction terms under Model… by selecting "region" and "school_type" and clicking Add.

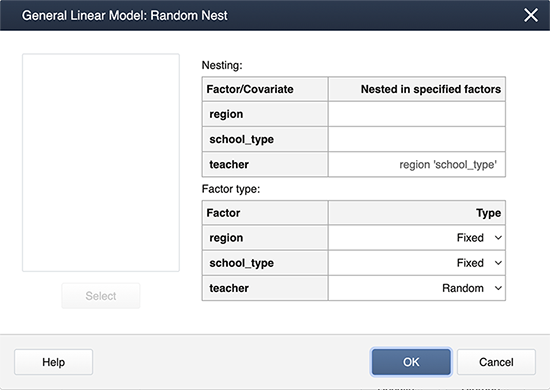
Finally, we create nested terms and effects are random under Random/Nest…:
Minitab Output for the mixed model:
Factor Information
| Factor | Type | Levels | Values |
|---|---|---|---|
| region | Fixed | 2 | EastUS, WestUS |
| school_type | Fixed | 2 | Private, Public |
| teacher(region school_type) | Random | 8 | 1(EastUS,Private), 2(EastUS,Private,) 1(EastUS,Public), 2(EastUS, Public), 1(WestUS, Private), 2(WestUS, Private), 1(WestUS,Public), 2(WestUS,Public) |
Analysis of Variance
| Source | DF | Seq SS | Adj SS | Adj MS | F-Value | P-Value |
|---|---|---|---|---|---|---|
| region | 1 | 564.06 | 564.06 | 564.06 | 24.07 | 0.008 |
| school_type | 1 | 76.56 | 76.56 | 76.56 | 3.27 | 0.145 |
| region*school_type | 1 | 264.06 | 264.06 | 264.06 | 11.27 | 0.028 |
| teacher(region schoo_type) | 4 | 93.75 | 93.75 | 23.44 | 5.00 | 0.026 |
| Error | 8 | 37.50 | 37.50 | 4.69 | ||
| Total | 15 | 1035.94 |
Model Summary
| S | R-sq | R-sq(adj) | R-sq(pred) |
|---|---|---|---|
| 2.16506 | 96.38% | 93.21% | 85.52% |
Minitab's results are in agreement with SAS Proc Mixed.
This page titled 6.7.1: Using Minitab was last modified on Mon, 02 Jan 2023 23:40:32 GMT and is shared under a CC BY-NC 4.0 license and was authored, remixed, and/or curated by Penn State's Department of Statistics.
The book could not be loaded just now.