14.8: Global Life Expectancy and Mortality Statistics
Cultural Anthropology · LibreTexts
0%
Contents
Text
Size
From LibreTexts, under CC BY-SA 4.0, as the source states it; its equations are written in TeX, which the PDF shows typeset. This page at LibreTexts.
14.8: Global Life Expectancy and Mortality Statistics
Opening the book…
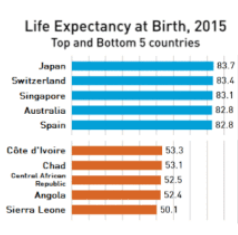
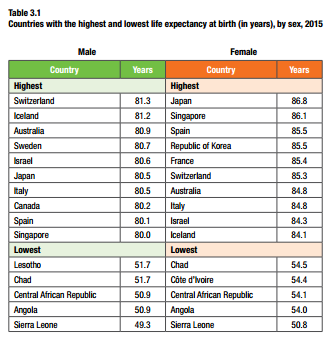
Figure \(\PageIndex{1}\) - Life Expectancy at Birth, 2015. Top and Bottom 5 Countries. Source: World Health Organization (WHO) World Health Statistics 2016: Monitoring health for the SDGs PublicationFigure \(\PageIndex{2}\) - Countries with the highest and lowest life expectancy at birth (in years), by sex, 2015. Source: World Health Organization (WHO) World Health Statistics 2016: Monitoring health for the SDGs Publication
Global Life Expectancy
Global life expectancy in 2015 was 71.4 years. On average, women live longer than men. Female life expectancy is 73.8 years. Male life expectancy is 69.1 years.
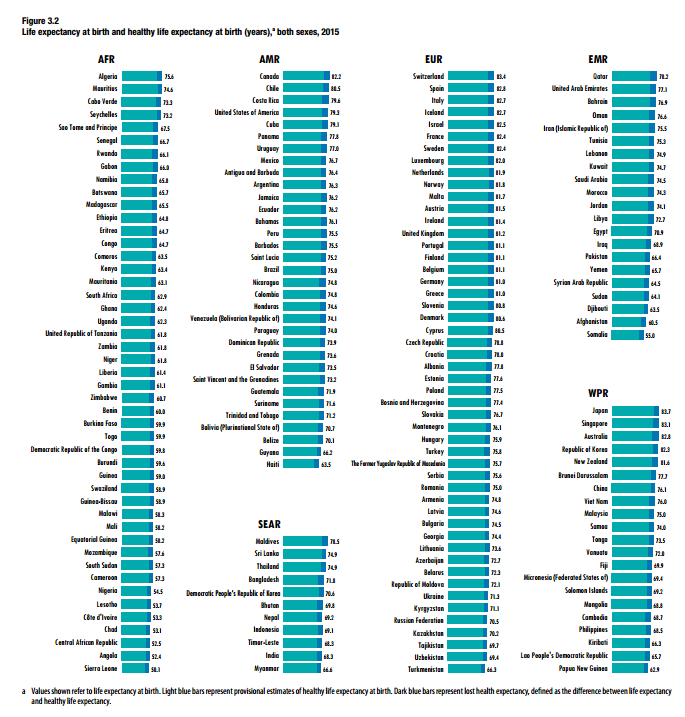
Figure \(\PageIndex{3}\) - Life expectancy at birth and healthy life expectancy at birth (years), both sexes, 2015. Source: World Health Organization (WHO) World Health Statistics 2016: Monitoring health for the SDGs Publication
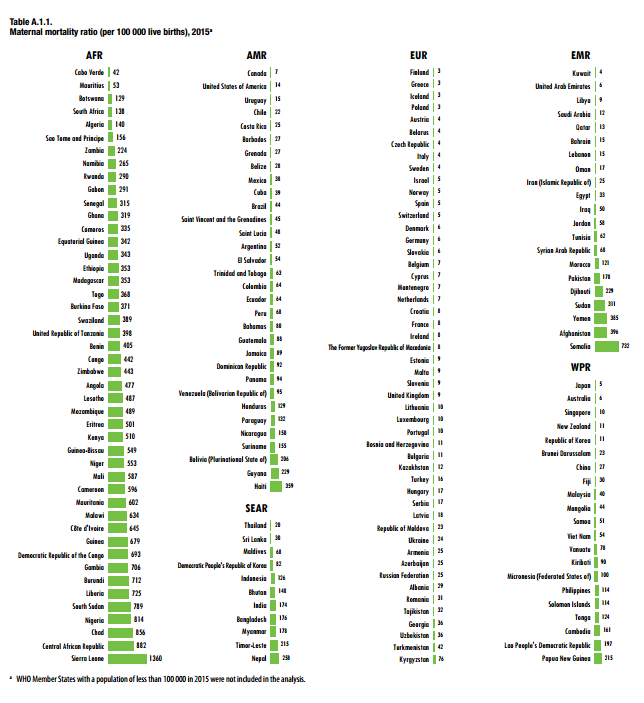
Maternal Mortality
Mothers are more likely to die in Africa due to complications from childbirth and pregnancy.
Hemorrhage, hypertension, and infection are most likely causes of death.
Most of these deaths are preventable.
Figure \(\PageIndex{4}\) - Maternal mortality ratio (per 100 000 live births), 2015: Source World Health Organization (WHO) World Health Statistics 2016: Monitoring health for the SDGs Publication
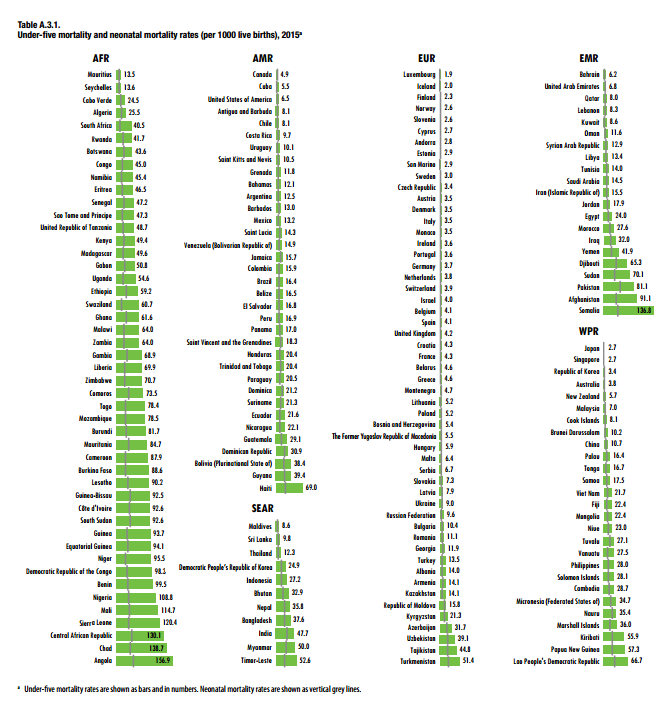
Under-Five Mortality and Neonatal Mortality
In 2015, 45% of deaths that occurred to children under-five were newborn. Main causes of neonatal deaths are prematurity, sepsis and birth-related complications.
Main causes of post neonatal deaths are pneumonia, diarrhea, injuries and malaria.
Figure \(\PageIndex{5}\) - Under-five mortality and neonatal mortality rates (per 1000 live births), 2015: Source World Health Organization (WHO) World Health Statistics 2016: Monitoring health for the SDGs Publication