From LibreTexts, under CC BY 4.0, as the source states it; its equations are written in TeX, which the PDF shows typeset. This page at LibreTexts.
8.4: Venn Diagrams
Opening the book…
To visualize the interaction of sets, John Venn in 1880 thought to use overlapping circles, building on a similar idea used by Leonhard Euler in the 18th century. These illustration show called Venn Diagrams.
Definition: Venn Diagrams
A Venn diagram represents each set by a circle, usually drawn inside of a containing box representing the universal set. Overlapping areas indicate elements common to both sets.
Basic Venn diagrams can illustrate the interaction of two or three sets.
Example 1
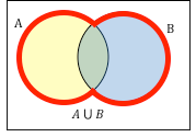
Create Venn diagrams to illustrate A ⋃ B, A ⋂ B, and Ac ⋂ B A ⋃ B contains all elements in either set.
Figure 10. Circles A & B
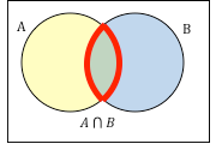
A ⋂ B contains only those elements in both sets – in the overlap of the circles.
Figure 11. Circles A & B
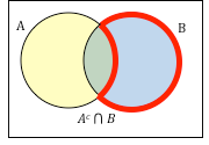
Ac will contain all elements not in the set A. Ac ⋂ B will contain the elements in set B that are not in set A.
Figure 12. Circles A & B
Example 2
Use a Venn diagram to illustrate (H ⋂ F)c ⋂ W
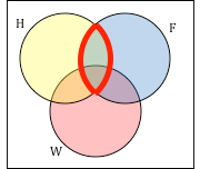
We’ll start by identifying everything in the set H ⋂ F
Figure 13. Circles H, F, & W
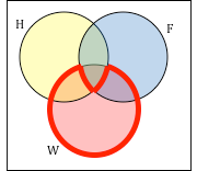
Now, (H ⋂ F)c ⋂ W will contain everything not in the set identified above that is also in set W.
Figure 14. Circles H, F, & W
Example 3
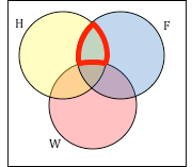
Create an expression to represent the outlined part of the Venn diagram shown.
The elements in the outlined set are in sets H and F, but are not in set W. So we could represent this set as H ⋂ F ⋂ Wc
Figure 15. Circles H, F, & W
Try it Now
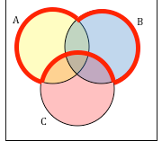
Create an expression to represent the outlined portion of the Venn diagram shown