From LibreTexts, under CC BY 4.0, as the source states it; its equations are written in TeX, which the PDF shows typeset. This page at LibreTexts.
11.4: Income and Wealth
Opening the book…
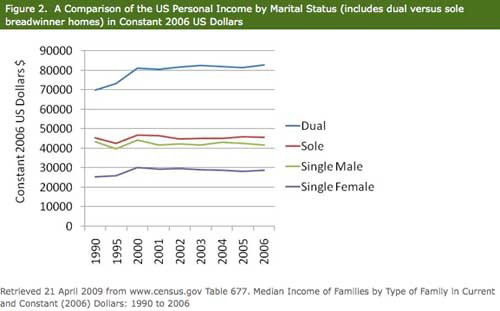
Figure \(\PageIndex{1}\)shows a comparison of income for single and dual-earner married households and also for single males and females. The data are presented in constant 2006 U.S. dollars which simply means they are adjusted for cost of living changes for each year. The first thing you see is that dual-earner marrieds (both husband and wife work in labor force) by far had the highest income levels every year from 1990 until 2006. Sole-earner married (husband only in labor force) comes in next followed closely by single males. Single females reported the lowest income.
Figure \(\PageIndex{1}\). A Comparison of the US Personal Income by Marital Status (includes dual versus sole breadwinner homes) in Constant 2006 US Dollars.11
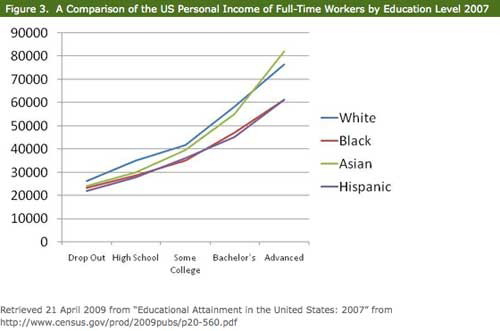
Figure \(\PageIndex{2}\) shows stratification in the U.S. by educational level. Keep in mind that the higher the education, the higher the annual income. This is typically true year after year. Income levels are higher for Whites and Asians followed by Blacks and Hispanics, but the layers are clearly visible by education level.
Figure \(\PageIndex{2}\). A Comparison of the US Personal Income of Full-Time Workers by Education Level 2007
Not all economic disadvantage results from our choices. In the U.S. non-Whites, non-Asians, and non-males are more likely to be found in the lower layers. Figure \(\PageIndex{3}\) portrays what the layering of society might look like if the U.S. population were divided into three groups; the top \(10 \%\) wealthy-elite, the next \(20 \%\) upper-class, and the remaining \(70 \%\) middle and lower classes. The top 10\% owns the lion's share of all the wealth available to be owned in the U.S. They own as much as 100 times the average U.S. person's wealth. For a relative few, they make more in a year than most of us make in a lifetime. Theirs is the life of high levels of property, power, and prestige. The next \(20 \%\) upper-class holds the high ranking jobs, they run for elected office, and they hold CEO-level positions in major corporations. These types of jobs pay more, require more education, require more abstract thought, and allow for more self-directed autonomy in their daily activities. The largest category includes the remainder of us. We fall into some layer of upper-middle class, middle class, working class, labor class, and poor.
Figure \(\PageIndex{3}\): Portrayal of United States' Economic Layering 12