Opening the book…
In a previous exercise, we saw that changing the threshold for rejection affects both the hit rate (the proportion of artifacts detected) and the false alarm rate (the proportion of non-artifact trials that are flagged for rejection). If you change the threshold to make one better, this inevitably makes the other one worse. However, there is something you can change that can improve both the hit rate and the false alarm rate. Specifically, you can use an artifact detection algorithm that is better designed to isolate blinks from other kinds of voltage deflections.
The simple voltage threshold algorithm that we have used so far in this chapter is an overly simplistic way of detecting blinks. It treats any large voltage as a blink, not taking into account the shape of the blink waveforms. Depending on the threshold you choose, it will typically either flag some trials that don’t contain blinks or miss some of the true blinks. We can improve blink detection by taking into account the fact that blinks are relatively short-term changes in voltage that typically last ~200 ms. In this exercise, we’ll look at two artifact detection algorithms that take this into account and work much better for blink detection.
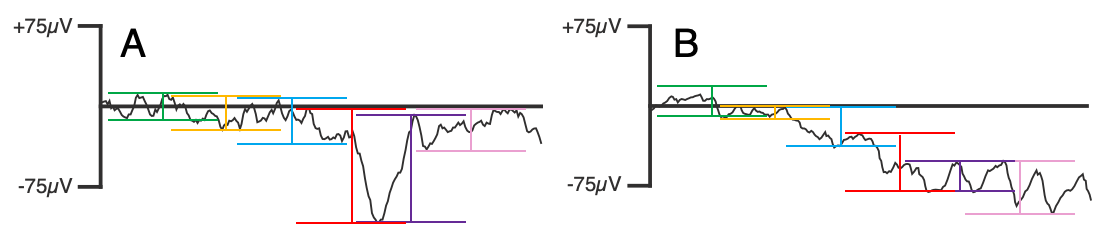
The first is called the moving window peak-to-peak algorithm, and it’s illustrated in Figure 8.3. With default parameters and an epoch of -200 to 800 ms, this algorithm will start by finding the difference in amplitude between the most positive and most negative points (the peak-to-peak voltage) between -200 and 0 ms (a 200-ms window). Then, the window will move 100 ms to the right, and the algorithm will find the peak-to-peak voltage between -100 and 100 ms. The window will keep moving by 100 ms, finding the peak-to-peak amplitude from 0 to 200 ms, 100 to 300 ms, and so on until 600-800 ms. This yields 9 different peak-to-peak amplitudes. The largest of these 9 peak-to-peak amplitudes is then compared to the rejection threshold to determine if this epoch should be marked for rejection.
Figure 8.3A illustrates the application of this algorithm to a trial with a blink. You get a large peak-to-peak amplitude during the period of the blink because of the relatively sudden change in voltage. However, the algorithm isn’t “fooled” by the slow drift shown in Figure 8.3.B.
Let’s try it. Select 1_MMN_preprocessed_interp_be in the EEGsets panel and then go to the Artifact Detection panel and select Moving window peak-to-peak in the Algorithms menu. Set it up as shown in Screenshot 8.6, with a window width of 200 ms and a window step of 100 ms (so that we get a 200-ms window every 100 ms). Set the threshold to 100 and the channel to 33 (VEOG-bipolar). Click Run to run the algorithm and accept the recommended name for the new ERPset (1_MMN_preprocessed_interp_be_ar).

Screenshot 8.6
A summary window will appear indicating that a total of 28.15% of trials have been flagged for rejection across the two bins. That’s a lot more than we had with the absolute voltage threshold; we’ll discuss the reasons for that in a moment.
If you scroll through the data starting at epoch 100, you’ll see that every clear blink has now been flagged (including Epochs 104 and 170, which were missed by the absolute threshold algorithm). However, some trials with muscle noise have now been flagged for rejection (e.g., Epochs 107 and 108). Here’s why: Imagine that the muscle noise causes the voltage to vary from -55 to +55 µV between 200 and 400 ms. This doesn’t exceed the absolute threshold of ±100 µV, but it creates a peak-to-peak amplitude of 110 µV, exceeding our threshold for the peak-to-peak amplitude. One way to solve this would be to increase the threshold to something like 120 µV. However, this would cause us to start missing real blinks.
Another approach would be to apply a low-pass filter prior to artifact detection. Let’s give that a try. Select 1_MMN_preprocessed_interp_be again in the EEGsets panel and then go back to the Artifact Detection panel and but check the box labeled Prefilter at and enter a cutoff of 30 in the corresponding text box. This option creates a hidden copy of the dataset, applies a low-pass filter to it with the cutoff you specified (30 Hz in this case), and applies the artifact detection algorithm to this hidden copy. The artifact detection flags are then copied to the original dataset. This will suppress most of the EEG activity, allowing you to avoid flagging epochs with large EMG, but you end up with your original unfiltered data.
Click Run and name the resulting EEGset 1_MMN_preprocessed_interp_be_ar2. You’ll see that only 12.99% of trials are flagged for rejection (compared to 28.15% without prefiltering). If you scroll through the data starting at epoch 100, you’ll see that all the clear blinks are flagged, but the trials with EMG noise are not (e.g., Epochs 107 and 108). If you check the data quality for this EEGset using the Compute Data Quality Metrics panel, you'll see that it was better for this EEGset than for the best of the EEGsets for which we used the absolute voltage threshold (1_MMN_preprocessed_interp_be_ar150).
So, the moving window peak-to-peak algorithm is definitely superior to the absolute voltage threshold algorithm. It doesn’t make a huge difference with this participant, but it makes a big difference for some participants and some experimental paradigms. However, in many cases, you’ll want to use the low-pass prefilter option.
Now let’s look at another algorithm that works even better but doesn’t require any low-pass filtering. I call this algorithm the step function, because I developed it to detect the step-shaped voltage deflections produced by saccadic eye movements in N2pc paradigms. I eventually discovered that it also works great for detecting blinks.
The step function also involves a moving window, with somewhere between 200 and 400 ms as a reasonable default value for most studies. Within a 400-ms window, this algorithm calculates the difference between the mean voltage in the first half of the window and the mean voltage in the second half of the window. It then finds the largest of these differences for all the windows in a given epoch, and it compares the absolute value of this difference to the rejection threshold. You can use a lower detection threshold with the step function than with the other algorithms, which helps avoid false alarms. Also, you will get the largest voltage from a blink if the center of the window is just slightly before the start of the blink, and a smaller step size (e.g., 10 ms) tends to be better.
Let’s try it. Select 1_MMN_preprocessed_interp_be in the EEGset panel and then go to the Artifact Detection panel and select Step-like artifacts in the Algorithms menu. Set the parameters as shown in Screenshot 8.7. Specifically, set the window width to 400 and the window step to 10 (so that we get a 400-ms window every 10 ms). Set the threshold to 50 and the channel to 33. Turn off the prefiltering checkbox. Click Run and name the resulting EEGset 1_MMN_preprocessed_interp_be_step50. Click Save in the EEGsets panel to save this EEGset to disk; you'll need it for the next exercise.

Screenshot 8.7
You should first note that 13.38% of trials have been flagged for rejection. This is a little more than what we obtained when we used the moving window peak-to-peak algorithm with the prefiltering option. But note that no filtering is required with the step function: when the step function algorithm averages across each half of the 200-ms window, high-frequency activity is virtually eliminated. And if you scroll through the data, you'll see that the step function algorithm has flagged a couple of epochs that were previously missed (e.g., Epochs 266 and 331). Moreover, if you check the data quality for this EEGset using the Compute Data Quality Metrics panel, you'll see that it was even better than what we obtained with the moving window peak-to-peak algorithm.
In my experience, the step function works slightly better than the moving average peak-to-peak algorithm (especially when there is a lot of EMG noise) and significantly better than absolute voltage thresholds. It’s what I recommend for detecting blinks in most cases.
This page titled 8.10: Exercise- Better Blink Detection was last modified on Thu, 01 Oct 2026 18:52:48 GMT and is shared under a CC BY-NC 4.0 license and was authored, remixed, and/or curated by Steven J Luck directly on the LibreTexts platform.
The book could not be loaded just now.