Explorations Lab and Activities Manual · LibreTexts
0%
Contents
Text
Size
From LibreTexts, under CC BY-NC 4.0, as the source states it; its equations are written in TeX, which the PDF shows typeset. This page at LibreTexts.
16.3: Global Distribution of BMI
Opening the book…
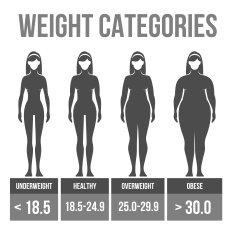
Body Mass Index categories. Women Body Mass Index by unknown is in the public domain.
Format: In-person or online
Author: Nelson, Katie
Time needed: 40-60 minutes
Learning Objectives
Chart and analyze global BMI data.
Identify trends in global BMI data.
Calculate one’s own BMI and relate it to larger global and national trends.
Supplies Needed
Scale and measuring tape
Worksheet (provided)
Graphing software or PowerPoint
Readings
Namie, Joylin. Chapter 16: Contemporary Topics: Human Biology and Health. Explorations.
Introduction
In this activity, students use global Body Mass Index (BMI) data compiled by the World Health Organization (WHO) to create a chart that represents the average (mean) BMI for multiple countries from 1975 to 2015. Students also calculate their own BMI and relate it to larger global and national trends.This activity prompts students to reflect on the relationship between one’s environment and biology in determining health.
Steps
Students will weigh themselves and measure their height, documenting these data in pounds and feet/inches.
Students select six countries to track. They then access these countries, using WHO data and list the percentage of each country’s population that have a BMI of 30 or greater by year.
Using a charting software or PowerPoint chart feature, students input the BMI data from all of their six countries into a single chart, including data from 1975, 1985, 1995, 2005, 2015. They then project what the BMI will be for each country in 2025.
Students analyze the data, discuss trends, and hypothesize why there are differences between countries and changes over time.
Students reflect on their own BMI in relation to country trends.
Review Questions
Why do BMI differ so much from country to country?
What could be the causes of the progressive increase in BMI in most countries since 1975?
Who benefits from the global obesity epidemic? Think about the following industries and institutions: How might the medical establishment profit from obesity? The fitness industry? The diet industry? Fashion? Pharmaceutical companies? Food manufacturers? Advertisers?
Tips and Suggestions
Some students may be uncomfortable disclosing their weight and height. If this is the case, you may wish to modify this activity. One way to do so is to allow students to omit their own raw BMI data and instead only answer the questions in which they reflect on their BMI as it compares to national data and in general, rather than specific, terms.
Adapting for Online Learning
If this is an in-person lab, rank how adaptable to online learning it would be(mark in bold): Easy to adapt
Namie, Joylin. 2019. “Chapter 16: Contemporary Topics: Human Biology and Health.” In Explorations: An Open Invitation to Biological Anthropology, edited by Beth Shook, Katie Nelson, Kelsie Aguilera, and Lara Braff. Arlington, VA: American Anthropological Association. http://explorations.americananthro.org/
This page titled 16.3: Global Distribution of BMI was last modified on Fri, 03 Jul 2026 04:54:32 GMT and is shared under a CC BY-NC 4.0 license and was authored, remixed, and/or curated by Katie Nelson via source content that was edited to the style and standards of the LibreTexts platform.