Opening the book…
3.7.1 Discrete Spectra
Model
Shade in the spectrum tube based on the color without using the diffraction grating. Then, sketch the spectrum of the light using the diffraction grating. If you do not have physical tools, you can do this using the Spectroscopy Simulator from the Foothill AstroSims website: https://foothillastrosims.github.io/Spectroscopy-Demonstrator/
Hydrogen

Hydrogen discharge tube and observed emission spectrum through a diffraction grating.
Helium
Helium discharge tube and observed emission spectrum through a diffraction grating.
- Does the light from these tubes contain all of the colors?
- Are the lines from each source the same or different?
- How many lines did each source emit?
Summary
The emission spectrum that you observed is different from the blackbody spectrum that we explored earlier:
An emission spectrum contains ________________________________________________.
An emission spectrum depends on the ____________________ of the object and does not depend on the ____________________ of the object.
A blackbody spectrum contains ________________________________________________.
A blackbody spectrum depends on the ____________________ of the object and does not depend on the ____________________ of the object.
3.7.2 Atomic Orbitals
Model

Two atoms showing electron energy levels and orbital transitions for comparison.
Image Credit: Astronomy Ranking Task from Rica Sirbaugh French at MiraCosta College (https://home.miracosta.edu/rfrench/facultyshare/RTs.html)
- Is the lowest energy state near the nucleus of the atom or far away from the nucleus of the atom?
- Which atom will need to absorb more energy to transfer an electron from its ground state (lowest energy state) to the first excited state? How much energy does this process take in each atom?
- How much energy is gained or lost (identify one) when an electron transitions from C to B in each atom?
- When atoms lose energy, they give off light with a wavelength determined by the amount of energy lost. Will these two atoms have the same spectral lines? Explain your thinking.
Summary
The ground state is the ________________________________________________.
The first excited state is ________________________________________________.
When atoms absorb photons electrons transition closer to / farther from the ground state: ________________________________________________.
When atoms emit photons electrons transition closer to / farther from the ground state: ________________________________________________.
The energy levels are ____________________ for different atoms, which is why atoms have ____________________ spectra.
3.7.3 Emission
Model
The lines below represent similar energy levels as the previous model. The bottom line is the ground state, closest to the nucleus of the atom. The length of the arrows represents the amount of energy released by the atom as a photon.

Electron energy level diagram showing emission transitions and photon energies.
Image Credit: Astronomy Ranking Task from Rica Sirbaugh French at MiraCosta College (https://home.miracosta.edu/rfrench/facultyshare/RTs.html)
- As you get farther from the ground state (bottom), are the lines closer together or farther apart?
- Which transitions end on the ground state?
- Which transitions end on the first excited state?
- Which transitions are the largest?
- Complete the sentence: Higher energy photons are released for transitions that end at the ____________________ state.
3.7.4 Absorption
Model
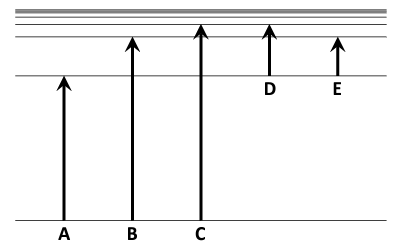
Electron energy level diagram showing absorption transitions to higher states.
Image Credit: Astronomy Ranking Task from Rica Sirbaugh French at MiraCosta College (https://home.miracosta.edu/rfrench/facultyshare/RTs.html)
- Are these transitions to lower or higher energy states?
- If an atom absorbs a low-energy photon, what transitions might occur?
- If an atom absorbs a high-energy photon, what transitions might occur?
- Electrons typically remain at the ground state. If that is the case, which transition would represent the minimum amount of energy needed to change the state of the electron?
3.7.5 Electron Transitions
The models below represent different transitions within a single atom.

Electron transition diagram with labeled paths for absorption and emission analysis.
Image Credit: Astronomy Ranking Task from Rica Sirbaugh French at MiraCosta College (https://home.miracosta.edu/rfrench/facultyshare/RTs.html)
- Which letters represent absorption of light? Rank them from largest to smallest amount of energy gained.
- Which letters represent emission of light? Rank them from largest to smallest amount of energy gained.
This page titled 3.7: Spectroscopy was last modified on Sat, 01 Aug 2026 14:37:30 GMT and is shared under a CC BY 4.0 license and was authored, remixed, and/or curated by Andrew Totah-McCarty.
The book could not be loaded just now.