Opening the book…
For the following exercises, find the average rate of change of the functions from \(x=1\) to \(x=2\).
24. \(f(x)=4 x-3\)
25. \(f(x)=10 x^{2}+x\)
26. \(f(x)=-\frac{2}{x^{2}}\)
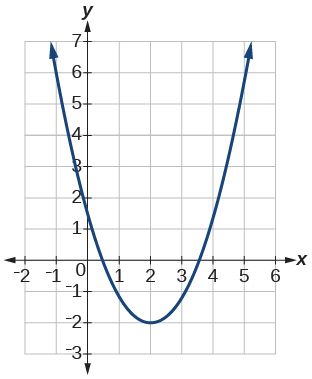
For the following exercises, use the graphs to determine the intervals on which the functions are increasing, decreasing, or constant.
27
28.
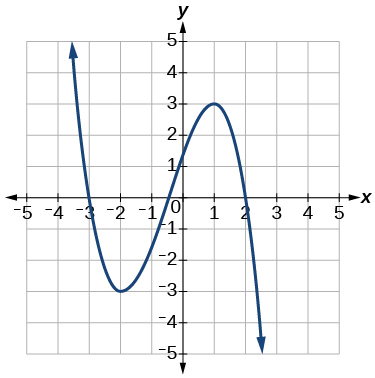
29.
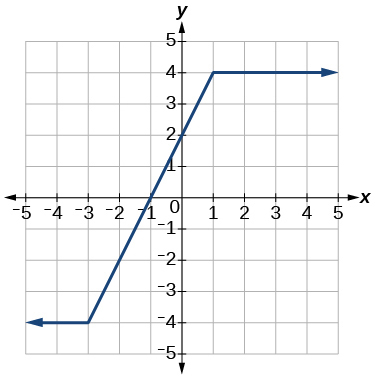
30. Find the local minimum of the function graphed in Exercise 3.27 .
31. Find the local extrema for the function graphed in Exercise 3.28 .
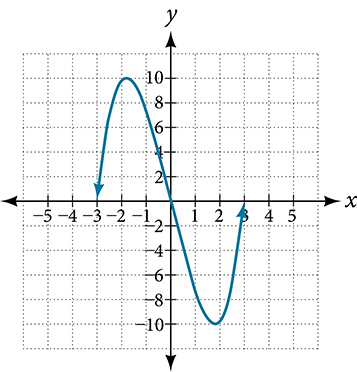
32. For the graph in Figure \(\PageIndex{3}\), the domain of the function is [-3,3] . The range is [-10,10] . Find the absolute minimum of the function on this interval.
33. Find the absolute maximum of the function graphed in Figure \(\PageIndex{3}\).
This page titled 3.4E: Rates of Change and Behavior of Graphs (Exercises) was last modified on Tue, 08 Feb 2022 17:56:23 GMT and is shared under a CC BY 4.0 license and was authored, remixed, and/or curated by OpenStax via source content that was edited to the style and standards of the LibreTexts platform.
The book could not be loaded just now.