Opening the book…
1.
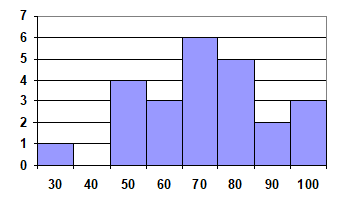
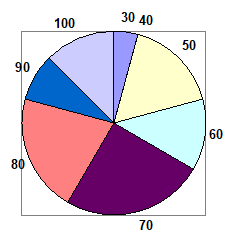
- Different tables are possible
\(\begin{array}{|l|l|}
\hline \text { Score } & \text { Frequency } \\
\hline 30 & 1 \\
\hline 40 & 0 \\
\hline 50 & 4 \\
\hline 60 & 3 \\
\hline 70 & 6 \\
\hline 80 & 5 \\
\hline 90 & 2 \\
\hline 100 & 3 \\
\hline
\end{array}\)
- This is technically a bar graph, not a histogram:
3.
- \(5+3+4+2+1=15\)
- \(5 / 15=0.3333=33.33 \%\)
5. Bar is at \(25 \% .25 \%\) of \(20=5\) students earned an \(A\)
7.
- \((7.25+8.25+9.00+8.00+7.25+7.50+8.00+7.00) / 8=\$ 7.781\)
- In order, 7.50 and 8.00 are in middle positions. Median \(=\$ 7.75\)
- \(0.25 * 8=2\) \(\mathrm{Q} 1\) is average of \(2^{\mathrm{nd}}\) and \(3^{\mathrm{rd}}\) data values: \(\$ 7.375 \quad 0.75 * 8=6 . \mathrm{Q} 3\) is average of \(6^{\mathrm{th}}\) and \(7^{\mathrm{th}}\) data values: \(\$ 8.125\) 5-number summary: \(\$ 7.00, \$ 7.375, \$ 7.75, \$ 8.125, \$ 9.00\)
- \(0.637\)
9.
- \((5 \times 0+3 \times 1+4 \times 2+2 \times 3+1 \times 5) / 15=1.4667\)
- Median is 8th data value: 1 child
- \(0.25 \times 15=3.75 .\) Q1 is 4 \(^{\text {th}}\) data value: 0 children \(0.75 \times 15=11.25 .\) Q 3 is \(12^{\text {th}}\) data value: 2 children 5 -number summary: 0,0 1,2,5

11. Kendra makes $90,000. Kelsey makes $40,000. Kendra makes $50,000 more.
This page titled 18.11: Describing Data was last modified on Sat, 02 Jan 2021 09:26:47 GMT and is shared under a CC BY-SA 3.0 license and was authored, remixed, and/or curated by David Lippman (The OpenTextBookStore) via source content that was edited to the style and standards of the LibreTexts platform.
The book could not be loaded just now.