Opening the book…
So which classification method to use? There are generally two answers: (1) this (these) which work(s) best with your data and (2) as many as possible. The second makes the perfect sense because human perception works the same way, using all possible models until it reaches stability in recognition. Remember some optical illusions (e.g., the famous duck-rabbit image, Figure \(\PageIndex{1}\)) and Rorschach inkblot test. They illustrate how flexible is human cognition and how many models we really use to recognize objects.
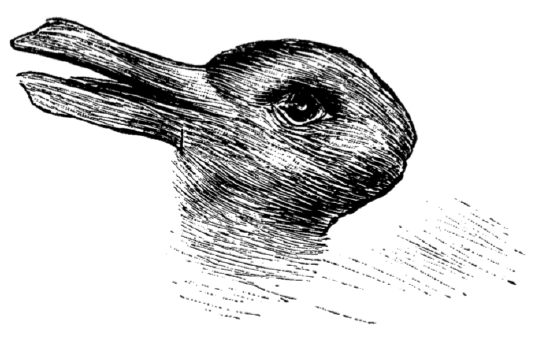 Figure \(\PageIndex{1}\) Duck-rabbit image presents two alternative recognition models.
At the end of the chapter, we decided to place the decision tree (Figure \(\PageIndex{2}\)) which allows to select some most important multivariate methods. Please note that if you decide to transform your data (for example, make a distance matrix from it), then you might access other methods:
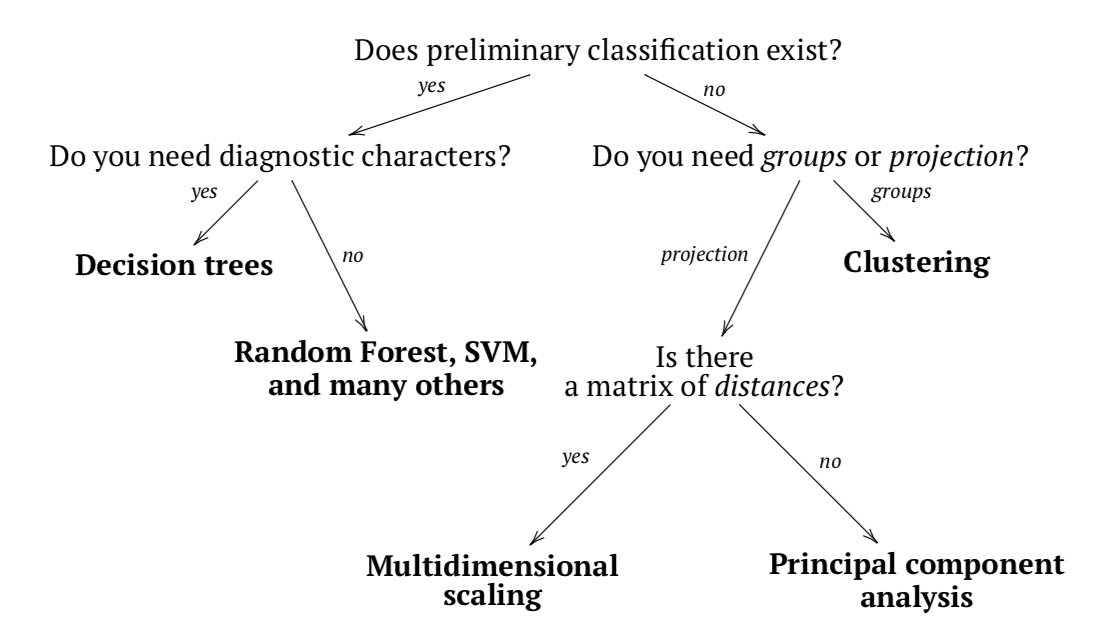 Figure \(\PageIndex{2}\) How to find the correct multivariate method.
This page titled 1.6.8.6: How to choose the right method was last modified on Fri, 17 Jan 2020 14:27:50 GMT and is shared under a Public Domain license and was authored, remixed, and/or curated by Alexey Shipunov.
The book could not be loaded just now.