Opening the book…
Reading Questions
- What is a phase shift and what does it represent on a graph?
- What is the midline of a trigonometric function?
- For the general function \(f(x) = A\text{trig}(Bx+C)+D\), which parameter determines the midline?
- What is the formula for the phase shift of the function \(y = A\sin(Bx+C)\)?
- How can you find the midline of a sinusoidal graph if you know its maximum and minimum values?
- When graphing a function like \(y = \sin(x+\frac{\pi}{3})\), does the graph shift to the left or to the right?
- Before finding the phase shift for a function like \(y = \cos(-2x + \pi)\), what is the necessary first step?
- The text shows that the graph of \(y = \cos(\frac{\pi}{2} - x)\) is identical to the graph of \(y = \sin(x)\). What transformation of the cosine graph produces the sine graph?
- When finding the equation of a sinusoidal function from its graph, why is it helpful to identify the vertical shift first?
- When finding the period of a tangent function from its graph, what graphical feature can you measure the distance between?
Homework
Vocabulary Check
-
The ___ tells us the \( x \)-value of where the original initial number in the principal cycle has moved.
-
Given the function \( f(x) = A \, \mathrm{trig}\left( Bx + C \right) + D \), the graph of the equation \( y = D \) is called the ___ of the trigonometric function.
-
Given the function \( f(x) = A \, \mathrm{trig}\left( Bx + C \right) + D \), \( D \) represents the ___.
Concept Check
-
Write an equation for a cosine function with midline \(-5\).
-
Write an equation for a sine function with midline 2.
-
Which of the following functions are the same? Explain your answer.\[f(x)=\cos \left(2 x-\dfrac{\pi}{3}\right), \quad g(x)=(\cos 2 x)-\dfrac{\pi}{3}, \quad h(x)=\cos 2 x-\cos \dfrac{\pi}{3}\nonumber \]
-
Which of the following functions are the same? Explain your answer.\[f(x)=\sin \left(2 x-\dfrac{\pi}{3}\right), \quad g(x)=\sin \left[2\left(x-\dfrac{\pi}{6}\right)\right], \quad h(x)=2 \sin \left(x-\dfrac{\pi}{6}\right)\nonumber \]
True or False? For the following exercises, determine if the statement is true or false. If true, cite the definition or theorem stated in the text supporting your claim. If false, explain why it is false and, if possible, correct the statement.
-
The phase shift is also known as the horizontal shift.
-
The amplitude of \( f(x) = -3 \tan\left( 2x - 1 \right) \) is \( 3 \).
-
The phase shift of the function \( f(x) = -3 \tan\left( 2x - 1 \right) \) is \( 1 \).
-
The phase shift of the function \( f(x) = -3 \tan\left( 2x - 1 \right) \) is \( -1 \).
-
The functions \( y = 2 \cos\left( \pi x - 4 \right) \) and \( y = -3 \sin\left( \pi\left( x - \frac{4}{\pi} \right) \right) \) have the same phase shift.
Basic Skills
For the following exercises, calculate the phase shift.
-
\(y=-2 \sin \left(3 x-\frac{\pi}{4}\right)\)
-
\(y=6 \cos \left(2 x+\frac{3 \pi}{4}\right)\)
-
\(y=12 \cos \left(\frac{t}{3}+0.8\right)\)
-
\(y=-5 \sin \left(\frac{t}{4}-0.6\right)\)
For the following exercises, state the amplitude, period, and midline of the graph.
-
\(y=-3+2 \sin \left(x\right)\)
-
\(y=4-3 \cos \left(x\right)\)
-
\(y=1-\cos \left(\pi x\right)\)
-
\(y=2+\sin \left(2 \pi x\right)\)
For the following exercises,
(a) Sketch the graphs of \( f \) and \( g \) on the same axes.
(b) State the phase shift from \( f \) to \( g \).
(c) Find all values of \( x \) for which \( g(x) = 1 \) for \( -\pi \leq x \leq \pi \).
(d) Find all values of \( x \) for which \( g(x) = 0 \) for \( -\pi \leq x \leq \pi \).
-
\(f(x) = \sin \left(x\right)\) and \(g(x) = \sin \left( x - \frac{\pi}{3} \right)\).
-
\(f(x)=\cos \left(x\right)\) and \(g(x)=\cos \left(x+\frac{\pi}{3}\right)\).
-
\(f(x)=\tan \left(x\right)\) and \(g(x)=\tan \left(x+\frac{\pi}{4}\right)\).
-
\(f(x)=\tan \left(x\right)\) and \(g(x)=\tan \left(x-\frac{\pi}{2}\right)\).
For the following exercises,
(a) What are the amplitude and phase shift of the given function?
(b) Sketch the graph.
(c) Find all values of \( x \) for which \( f(x) = 0 \) for \( 0 \leq x \leq 2\pi \).
-
\(f(x) =-2 \cos \left(x+\frac{\pi}{6}\right)\)
-
\(f(x)=-6 \sin \left(x-\frac{2 \pi}{3}\right)\)
-
\( f(x) = \frac{1}{2} \tan\left( x + \frac{\pi}{5} \right) \)
-
\( f(x) = -\frac{3}{7} \cos\left( x - \frac{\pi}{4} \right) \)
For the following exercises,
(a) What are the period and phase shift of the given function?
(b) Sketch the graph.
(c) Find all values of \( x \) for which \( f(x) = 1 \) for \( 0 \leq x \leq 2\pi \).
(d) Find all values of \( x \) for which \( f(x) = 0 \) for \( 0 \leq x \leq 2\pi \).
-
\(f(x)=\cos \left(2 x-\frac{\pi}{3}\right)\)
-
\(f(x)=\sin \left(3 x+\frac{\pi}{2}\right)\)
-
\(f(x)=\sin \left(\pi x+\frac{\pi}{3}\right)\)
-
\(f(x)=\cos \left(\pi x-\frac{\pi}{3}\right)\)
For the following exercises,
(a) What are the midline, period, phase shift, and amplitude of the given function?
(b) Sketch the graph.
(c) Find all values of \( x \) for which \( f(x) = 1 \) for \( 0 \leq x \leq 2\pi \).
(d) Find all values of \( x \) for which \( f(x) = k \) for \( 0 \leq x \leq 2\pi \), where \( k \) is stated within the problem.
-
\(y=3 \sin \left(\frac{x}{2}-\frac{\pi}{6}\right)+4\), \( k = 4 \)
-
\(y=2 \cos \left(\frac{x}{3}-\frac{\pi}{4}\right)-1\), \( k = -1 \)
For the following exercises,
(a) State the amplitude.
(b) State the period.
(c) State the step size.
(d) State the phase shift.
(e) State the vertical shift.
(f) Use this information to create an accurate graph of a single cycle of the trigonometric function. Be sure to label any asymptotes and all key points.
-
\(y = 2 - 5 \cos \left(2t\right)\)
-
\(y = -2 + 4 \sin \left(3t\right)\)
-
\(y = 1 + 3 \cos \left(\frac{t}{2}\right)\)
-
\(y = -2 -3 \sin \left(\frac{t}{4}\right)\)
-
\(y=4+2 \tan \left(3 x\right)\)
-
\(y=3-\tan \left(\frac{x}{4}\right)\)
-
\(y=1-2 \tan \left(\frac{x}{3}\right)\)
-
\( y = 2\sin\left( 2x - \pi \right) + 1 \)
-
\( y = -1 + 3 \cos\left( 2x + \pi \right) \)
-
\( y = -2 - \tan\left( 3x - \frac{\pi}{2} \right) \)
-
\( y = \frac{3}{2} - \frac{1}{2} \cos\left( 3x + \pi \right) \)
-
\( y = -\frac{1}{3} \sin\left( \pi x + \frac{3\pi}{2} \right) + 2 \)
-
\( y = -3 \tan\left( 2x - 1 \right) + 1 \)
-
\( y = -4 \cos\left( \pi x - 3 \right) - 4 \)
For the following exercises, state the equation of the function.
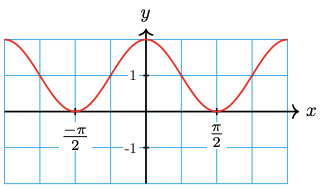
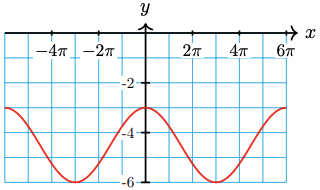
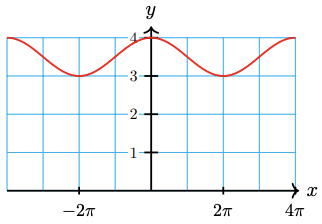
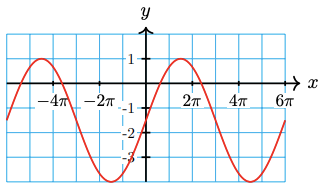
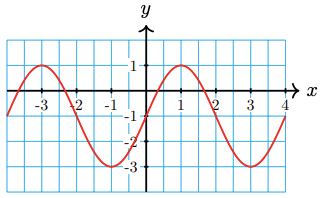
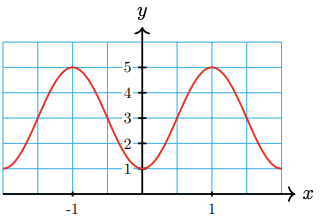
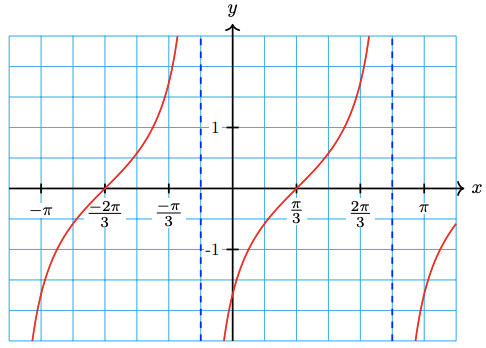
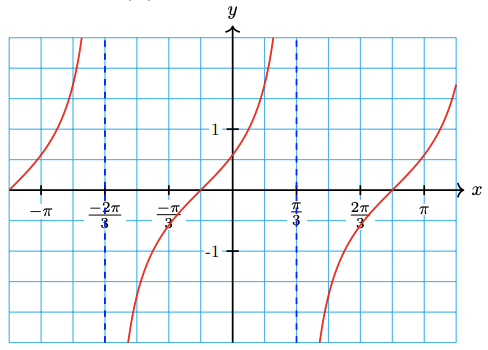
For the following exercises, find a formula for the graph of the given function in terms of
(a) sine
(b) cosine
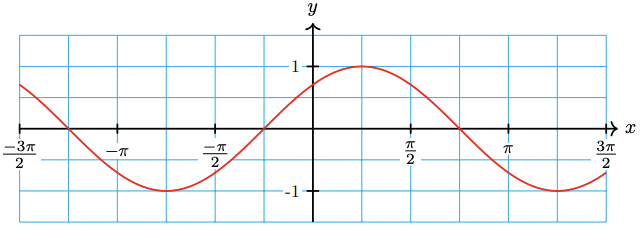
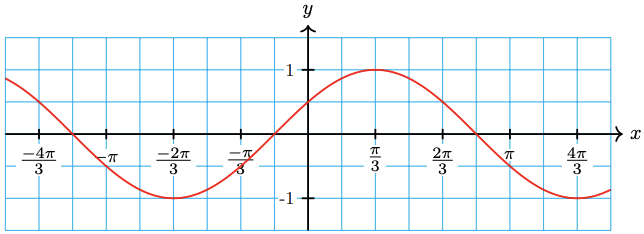
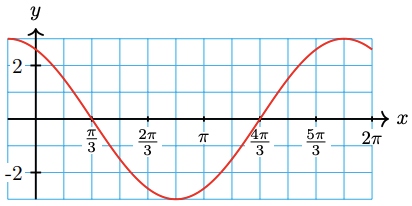
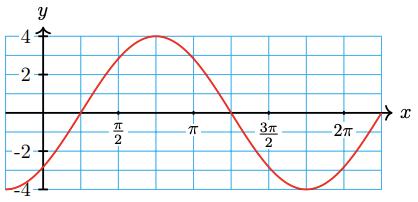
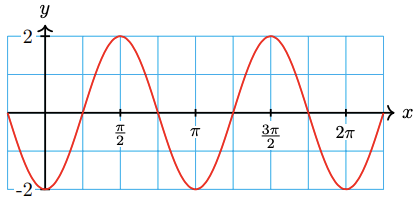
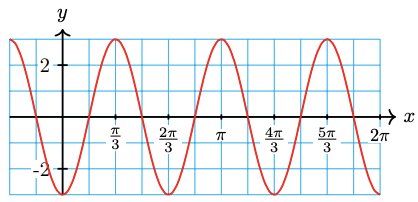
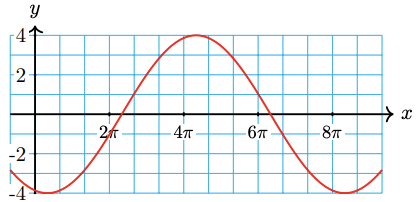
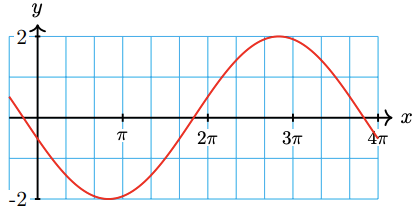
For the following exercises, find and graph a single cycle of a sinusoidal function with the given properties.
-
Amplitude of 2, a period of 3, and is shifted 4 units to the left and 5 units upwards compared with the sine function.
-
Amplitude of 3, a period of 24, and is shifted 2 units to the right and 4 units upwards compared with the cosine function.
-
Amplitude of 5, a period of 360, its midline at \(y=12\), and passes through (0,7).
-
Amplitude of 50, a period of 30, its midline at \(y=50\), and passes through (0,100).
For the following exercises, label the scales on the axes for the graph.
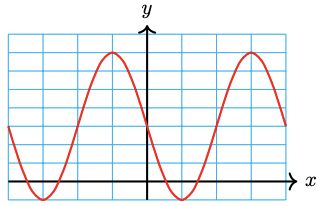
-
\(y=3-4 \sin \left(2 x\right)\)
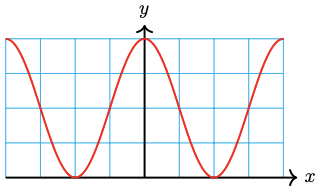
-
\(y=2 \cos \left(5 x\right)+2\)
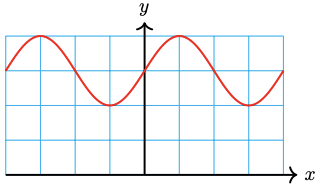
-
\(y=\frac{1}{2} \sin \left(3 x\right)+\frac{3}{2}\)
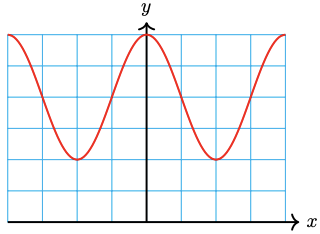
-
\(y=\frac{2}{5} \cos \left(6 x\right)+\frac{4}{5}\)
-
\(50-30 \sin \left(\frac{x}{4}\right)\)
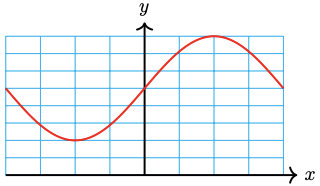
-
\(25 \cos \left(\frac{x}{3}\right)+15\)
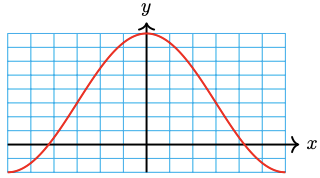
-
\(y=4 \sin \left(\pi x\right)-3\)
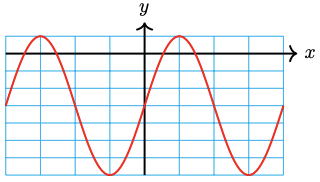
-
\(y=\frac{1}{2} \cos \left(\frac{\pi x}{2}\right)+2\)
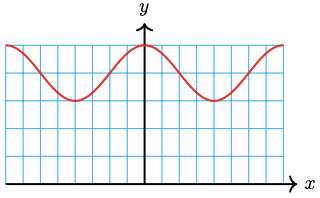
Synthesis Questions
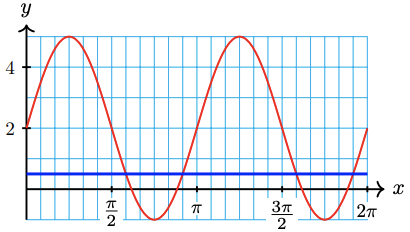
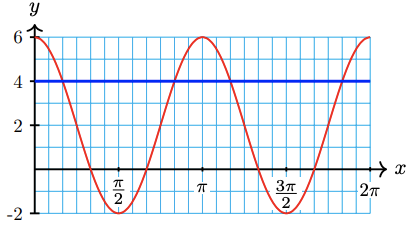
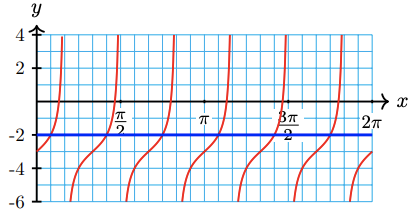
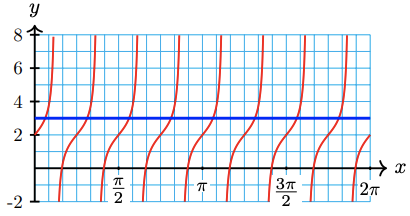
For the following exercises, use the graph to find all solutions between 0 and \(2 \pi\).
-
\(2+3 \sin \left(2 x\right)=0.5\)
-
\(2+4 \cos \left(2 x\right)=4\)
-
\(-3+\tan \left(3 x\right)=-2\)
-
\(2+\tan \left(4 x\right)=3\)
For the following exercises,
(i) Use a calculator to graph the function for \(0 \leq x \leq 2 \pi\).
(ii) Use the intersect feature to find all solutions between 0 and \(2 \pi\). Round your answers to hundredths.
-
-
\(h(x)=2-4 \cos \left(\frac{x}{4}\right)\)
-
\(2-4 \cos \left(\frac{x}{4}\right)=0\)
-
-
-
\(H(x)=3+2 \sin \left(\frac{x}{2}\right)\)
-
\(3+2 \sin \left(\frac{x}{2}\right)=5\)
-
-
-
\(G(x)=-1+3 \cos \left(3 x\right)\)
-
\(-1+3 \cos \left(3 x\right)=1\)
-
-
-
\(F(x)=4-3 \sin \left(2 x\right)\)
-
\(4-3 \sin \left(2 x\right)=2.5\)
-
For the following exercises, give the coordinates of the points on the graph.
-
\(f(\theta) = -3 + \cos \theta\)
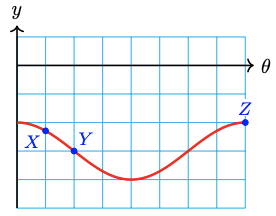
-
\(f(\theta) = 1 + \sin \theta\)

Applications
-
The tide in Yorktown is approximated by the function\[h(t)=1.4-1.4 \cos (0.51 t)\nonumber \]measured in feet above low tide, where \(t\) is the number of hours since the last low tide.
-
What are the midline, period, and amplitude?
-
Graph \(h(t)\) for two periods, labeling the points that correspond to high tide and low tide.
-
If the last low tide occurred at 5:00 am, predict when the next high and low tides will occur.
-
-
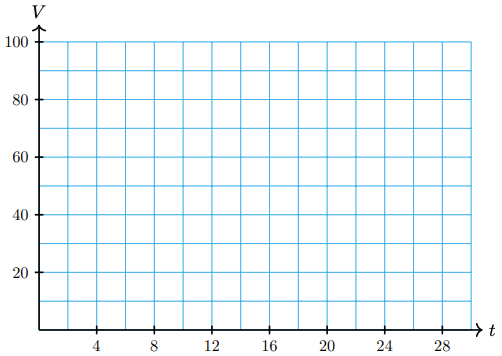
When observed from Earth, the moon looks like a disk that is partially visible and partially in shadow. The percentage of the disk that is visible can be approximated by\[V(t)=50 \cos (0.21 t)+50\nonumber \]where \(t\) is the number of days since the last full moon.
-
Graph \(V(t)\) in the window\[X_{\text{min}} = 0, X_{\text{max}} = 30\nonumber \]\[Y_{\text{min}} = 0, Y_{\text{max}} = 120\nonumber \]
-
Sketch the graph on the grid.
-
Label on your graph the points that correspond to full moon, half moon, and new moon. (New moon occurs when the part of the moon receiving sunlight is facing directly away from the Earth.)
-
At what times during the lunar month is \(25 \%\) of the moon visible? Mark those points on your graph.
-
During which days is less than \(50 \%\) of the moon visible? Mark the corresponding points on your graph.
-
-
The tide in Malibu is approximated by the function\[h(t)=2.5-2.5 \cos (0.5 t)\nonumber \]measured in feet above low tide, where \(t\) is the number of hours since the last low tide.
-
Graph \(h(t)\) in the window\[X_{\text{min}} = 0, X_{\text{max}} = 25\nonumber \]\[Y_{\text{min}} = 0, Y_{\text{max}} = 6\nonumber \]

-
Sketch the graph on the grid.
-
Label on your graph the points that correspond to high tide and low tide.
-
How high is high tide, and at what times does it occur?
-
At what times during the 25-hour period is the tide 4 feet above low tide? Mark those points on your graph.
-
Kathie walks along the beach only when the tide is below 1 foot. Find the intervals on your graph when the tide is below 1 foot.
-
-
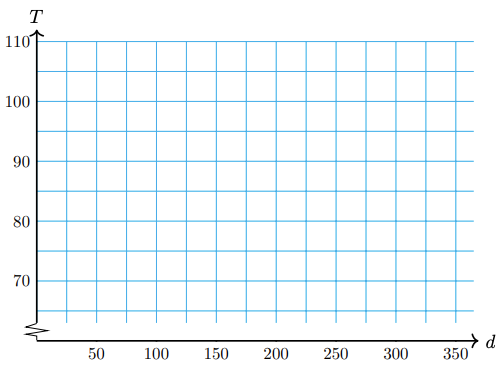
The average daily high temperature in the town of Beardsley, Arizona is approximated by the function\[T(d)=85.5-19.5 \cos (0.0175 d-0.436)\nonumber \]where the temperature is measured in degrees Fahrenheit, and \(d\) is the number of days since January 1.
-
Graph \(T(d)\) in the window\[X_{\text{min}} = 0, X_{\text{max}} = 365\nonumber \]\[Y_{\text{min}} = 0, Y_{\text{max}} = 110\nonumber \]
-
Sketch the graph on the grid.
-
Label on your graph the points that correspond to highest and lowest average temperature.
-
What is the hottest day and what is its average temperature? What is the day with the lowest average temperature, and what is that temperature?
-
At what times during the year are average high temperatures above \(90^{\circ}\)? Mark those points on your graph.
-
-
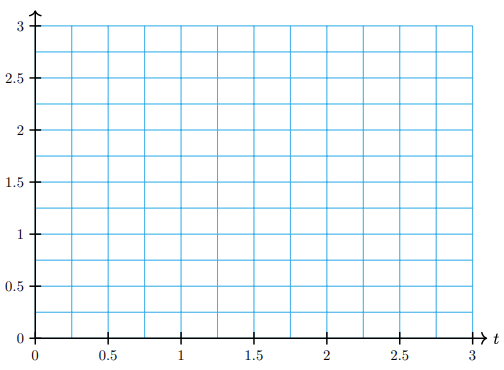
A weight is suspended from the ceiling on a spring. The weight is pushed straight up, compressing the spring, then released. The height of the weight above the ground is given by the function\[H(t)=2+0.5 \cos (6 t)\nonumber \]where the height is measured in meters, and \(t\) is the number of seconds since the mass was released.
-
Graph \(H(t)\) in the window\[X_{\text{min}} = 0, X_{\text{max}} = 3\nonumber \]\[Y_{\text{min}} = 0, Y_{\text{max}} = 3\nonumber \]
-
Sketch the graph on the grid.
-
Label on your graph the points that correspond to highest and lowest positions of the mass.
-
How high is highest point, and when is that height attained during the first 3 seconds?
-
How high is lowest point, and when is that height attained during the first 3 seconds?
-
Find the intervals during the first 3 seconds when the mass is less than 2 meters above the ground.
-
For the following exercises, write an equation for the sinusoidal function whose graph is shown.
-
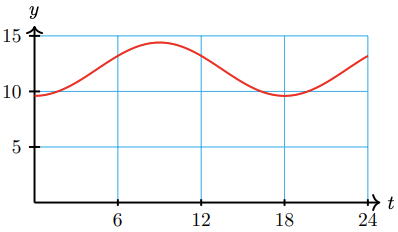
The number of hours of daylight in Salt Lake City varies from a minimum of 9.6 hours on the winter solstice to a maximum of 14.4 hours on the summer solstice. Time is measured in months, starting at the winter solstice.
-
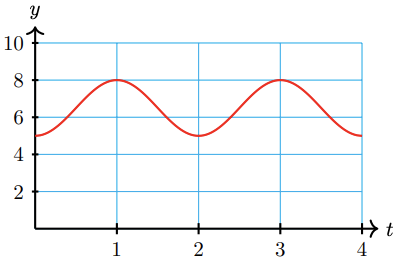
A weight is 6.5 feet above the floor, suspended from the ceiling by a spring. The weight is pulled down to 5 feet above the floor and released, rising past 6.5 feet in 0.5 seconds before attaining its maximum height of feet. The weight oscillates between its minimum and maximum height.
-
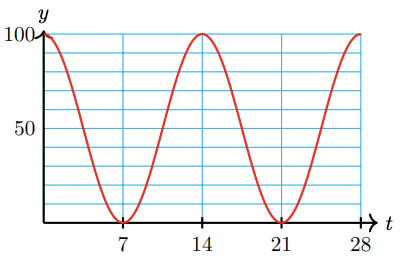
Although the moon is spherical, what we see from Earth looks like a disk, sometimes only partly visible. The percentage of the moon’s disk that is visible varies between 0 (at new moon) to 100 (at full moon), over a 28-day cycle.
This page titled 8.3.2: Homework was last modified on Tue, 08 Jul 2025 17:45:19 GMT and is shared under a not declared license and was authored, remixed, and/or curated by Roy Simpson.
The book could not be loaded just now.