Opening the book…
Most differentiable functions are made out of four different pieces all connected in various locations and various orders.

We say these two curves above with positive second derivative are concave up.
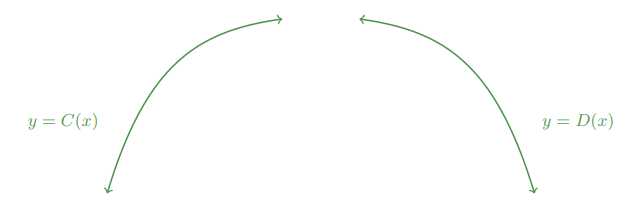
We say these two curves above with negative second derivative are concave down.
As long as you know where your function has a positive or negative first derivative (where it is increasing and decreasing), and you know where it has positive or negative second derivative (where it is concave up or concave down), then you can tell what shape the curve makes there.
Remember critical points (where \(f'(x)=0\) or DNE) separated where a function is increasing and decreasing. Similarly, we say that where \(f''(x)=0\) or DNE we have an inflection point, which separates where \(f''\) can change signs and make the concavity change.
Memorizing these four shapes will help us to draw almost any function (as long as we can differentiate it and handle any algebra that gets in our way).
1. Find \(f'(x)\) and critical points (\(f'(x)=0\) or \(f'(x)=\)DNE)
2. Find \(f''(x)\) and inflection points (\(f''(x)=0\) or \(f''(x)=\)DNE)
3. Create a sign chart for both of \(f'\) and \(f''\)
4. Plot any inflection or critical points.
5. Consider any horizontal or vertical asymptotes the graph may have.
6. Connect the dots.
Lets start with an easy example, \(\textcolor{red}{f(x)=x^2-2x} \)
For step 1, we differentiate: \(\textcolor{green}{f'(x)=2x-2} \).
This always exists and \(2x-2=0 \longrightarrow x=1\)
So the critical points are just \(x=1\)
For step 2, we differentiate again: \(\textcolor{blue}{f''(x)=2}\)
This always exists and \(2=0 \longrightarrow \emptyset\) is never satisfied.
So there are no inflection points.
Step 3 is to make a sign chart, we make a dividing line for all critical and inflection points.
Once we fill in the \(+\) and \(-\), below we draw which of the four shapes go there.

Step 4, we plug in \(x=1\) to find our height: \(\textcolor{red}{f(1)=1^2-2\cdot 1=-1}\)
There are no asymptotes for polynomials, so we can skip Step 5.
Lastly we draw our sketch by plotting the point \((1,-1)\) and using the curves from the sign chart:

Lets try another polynomial before making things more difficult:
Sketch \(\textcolor{red}{f(x)=3x^4-4x^3-12x^2+16} \)
Solution
Start with \(\textcolor{brown}{f'(x)=12x^3-12x^2-24x}\)
\(12x^3-12x^2-24x=0 \longrightarrow 12x(x^2-x-2)=0 \longrightarrow 12x(x-2)(x+1)=0 \longrightarrow x=0,2,-1\)
\(f'\) always exists, so these are all of the critical points.
Next we see \(\textcolor{purple}{f''(x)=36x^2-24x-24} \)
\(36x^2-24x-24=0 \longrightarrow 12(3x^2-2x-2)=0 \longrightarrow x=\displaystyle{ \frac{1 \pm \sqrt{7}}{3} }\) (quadratic formula)
\(f''\) always exists, so these are our two inflection points.
Now we put these all in order on the sign chart again:

Plugging each of these critical points in give us:
\(\textcolor{red}{f(-1)=3\cdot(-1)^4-4\cdot(-1)^3-12\cdot(-1)^2+16=11} \)
\(\textcolor{red}{f(0)=3\cdot 0^4-4\cdot 0^3-12\cdot 0^2+16=16} \)
\(\textcolor{red}{f(2)=3\cdot 2^4-4\cdot 2^3-12\cdot 2^2+16=-16} \)
The inflection points look a bit too ugly to find the exact height of, and there are no asymptotes since this is again a polynomial. Lets sketch:

Lets try a rational function.
Sketch \(g(x)=\displaystyle{\frac{2x}{x^2-4}}\)
Solution
First derivative: \(\textcolor{blue}{g'(x)=\displaystyle{ \frac{(x^2-4)\cdot 2- 2x\cdot(2x)}{(x^2-4)^2}=\frac{-2x^2-8}{(x^2-4)^2}}}\)
\( g'(x)=0 \longrightarrow -2x^2-8=0 \longrightarrow \emptyset \)
\( g'(x)=DNE \longrightarrow (x^2-4)^2=0 \longrightarrow x=\pm 2 \)
CP: \(x=2,-2\)
Second derivative: \(\textcolor{brown}{g''(x)=\displaystyle{ \frac{(x^2-4)^2\cdot (-4x)-(-2x^2-8)\cdot \left[ 2\cdot(x^2-4)\cdot2x\right]}{(x^2-4)^4}=\frac{4x^3+48x }{(x^2-4)^3}}}\)
\( g''(x)=0 \longrightarrow 4x^3+48x=0 \longrightarrow 4x(x^2+12)=0 \longrightarrow x=0 \)
\( g''(x)=DNE \longrightarrow (x^2-4)^3=0 \longrightarrow x=\pm 2 \)
IP: \(x=0,2,-2\)
Once again we make a sign chart and determine which shape goes to each region:

Plugging in \(x=0\) is simple: \(\textcolor{red}{g(0)=\displaystyle{\frac{2\cdot0}{0^2-4}=0}} \)
\(g(2)\) and \(g(-2)\) do not exist, but limits on each side determine how our graph acts near each.
\(\displaystyle{ \lim_{x\to 2^+} g(x)=\frac{4}{0^+}=+\infty}\) and \(\displaystyle{ \lim_{x\to 2^-} g(x)=\frac{4}{0^-}=-\infty}\)
so vertical asymptote at \(x=2\)
\(\displaystyle{ \lim_{x\to -2^+} g(x)=\frac{-4}{0^-}=+\infty}\) and \(\displaystyle{ \lim_{x\to -2^-} g(x)=\frac{-4}{0^+}=-\infty}\)
so vertical asymptote at \(x=-2\)
While we are at it, lets check for horizontal asymptotes:
\( \displaystyle{\lim_{x\to \infty}g(x)=\lim_{x\to \infty} \frac{2x}{x^2}=\lim_{x\to \infty} \frac{2}{x}=\frac{2}{\infty}=0} \)
\( \displaystyle{\lim_{x\to -\infty}g(x)=\lim_{x\to -\infty} \frac{2x}{x^2}=\lim_{x\to -\infty} \frac{2}{x}=\frac{2}{-\infty}=0}\)
So horizontal asymptote at \(y=0\)
Finally we draw all this and connect the dots:

Lets try an exotic one.
Sketch \(h(x)=\displaystyle{\frac{2e^x+3e}{e^x-e}}\)
Solution
\(h'(x)\displaystyle{ =\frac{-5e\cdot e^x}{(e^x-e)^2} }\)
Setting top and bottom equal to zero, we get critical points: \(x=1\)
\(h''(x)\displaystyle{ =\frac{5e\cdot e^x(e^x+e)}{(e^x-e)^3} }\)
Setting top and bottom equal to zero, we get inflection points: \(x=1\)
Lots of algebra but just quotient rule then set the top and bottom equal to zero
Now a sign chart:
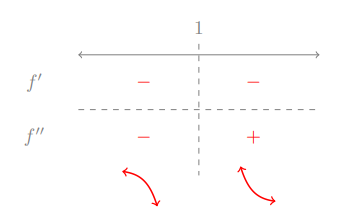
\(h(1)=\displaystyle{\frac{2e^1+3e}{e^1-e}=\frac{5e}{0}}=DNE\) so there are no points to plot
\(\displaystyle{\lim_{x\to 1^+} h(x)=\frac{5e}{0^+}=+\infty}\) and \(\displaystyle{\lim_{x\to 1^-} h(x)=\frac{5e}{0^-}=-\infty} \)
Therefore there is a vertical asymptote at \(x=1\)
\(\displaystyle{\lim_{x\to \infty} h(x)\stackrel{LH}{=}\lim_{x\to \infty} \frac{2e^x}{e^x}=\lim_{x\to \infty} 2=2}\)
\(\displaystyle{\lim_{x\to -\infty} h(x)=\frac{2\cdot 0+3e}{0-e}=\frac{3e}{-e}=-3}\)
Notice: for \(x\to -\infty\), you cannot use L'Hopital's Rule since it is not an indeterminate form
This means there are horizontal asymptotes at \(y=2\) and \(y=-3\)

Some functions have a natural domain to consider.
Sketch \(y=x\sqrt{4-2x^2}\)
Solution
\(\displaystyle{y'= \frac{4-4x^2}{\sqrt{4-2x^2}}}\), means we have critical points: \(x=\pm 1, \pm \sqrt{2}\)
\(\displaystyle{y''= \frac{8x^3-24x}{(4-2x^2)^{\frac{3}{2}}} }\), means we have inflection points; \(x=0,\pm \sqrt{2}, \pm \sqrt{3}\)
The original function only exists when \(4-2x^2\ge 0\), or \(x\in \left[ -\sqrt{2},\sqrt{2}\right]\)
So we ignore everything outside of this domain for our sign chart:

We plug in each critical and inflection point:
\(y(\sqrt{2})=\sqrt{2}\cdot \sqrt{ 4- 2\cdot (\sqrt{2})^2}=0\)
\(y(1)=1\cdot \sqrt{ 4- 2\cdot 1^2}=\sqrt{2}\)
\(y(0)=0\cdot \sqrt{ 4- 2\cdot 0^2}=0\)
\(y(-1)=-1\cdot \sqrt{ 4- 2\cdot (-1)^2}=-\sqrt{2}\)
\(y(-\sqrt{2})=-\sqrt{2}\cdot \sqrt{ 4- 2\cdot (-\sqrt{2})^2}=0\)
This is continuous on its domain, so no vertical asymptotes.
Since the domain is closed, there is no limit to either infinity (so no horizontal asymptotes either)
We just plot each point and connect the dots:

Just remember to use limits whenever anything gets weird!
Sketch \(f(x)=\displaystyle{\tan^{-1}\left( \frac{1}{x^2}\right)}\)
Solution
\(\displaystyle{f'(x)=\frac{1}{1+\left(x^{-2}\right)^2}\cdot (-2x^{-3})=-\frac{2x}{x^4+1}}\)
So we have critical point \(x=0\)
\(\displaystyle{f''(x)=\frac{6x^4-2}{(x^4+1)^2} } \)
So there are inflection points \(x=\pm \sqrt[4]{3}\)
Even though \(x=0\) is not in the domain of \(f\), the derivative exists on either side of it so we will include it in the sign chart (and explore exactly what happens with limits shortly).

We have a discontinuity at \(x=0\), but what kind?
\(\displaystyle{ \lim_{x\to 0} f(x)=\tan^{-1}\left(\frac{1}{0^+}\right)=\tan^{-1}(+\infty)=\frac{\pi}{2}}\)
\(\displaystyle{ f\left( \pm \sqrt[4]{\frac{1}{3}}\right)=\tan^{-1} \left( \frac{1}{\left(\pm 3^{-\frac{1}{4}}\right)^2}\right)=\tan^{-1}\left(\sqrt{3}\right)=\frac{\pi}{3}}\)
There is a removable discontinuity at \(x=0\), forming a hole at \(\displaystyle{\left(0,\frac{\pi}{2}\right)}\)
\( \displaystyle{\lim_{x\to \infty} f(x)=\tan^{-1}\left(\frac{1}{\infty}\right)=\tan^{-1}(0)=0}\)
\( \displaystyle{\lim_{x\to -\infty} f(x)=\tan^{-1}\left(\frac{1}{\infty}\right)=\tan^{-1}(0)=0} \)
This means we have a horizontal asymptote at \(y=0\)

This page titled 11.6: Curve Sketching was last modified on Thu, 13 Mar 2025 20:04:48 GMT and is shared under a CC BY-NC-SA 4.0 license and was authored, remixed, and/or curated by Kenn Huber.
The book could not be loaded just now.