Opening the book…
- Build an exponential growth model
- Build an exponential decay model
- Use a model to solve application problems
In previous sections of this chapter, we were either given a function explicitly to graph or evaluate. In this section, we will use as set of data to "model" the situation with an exponential function. Then, we can use that function to answer questions about that particular problem.
Do not be confused by the word model. In mathematics, we often use the terms function, equation, and model interchangeably, even though they each have their own formal definition. The term model is typically used to indicate that the equation or function approximates a real-world situation.
We will concentrate on two types of models in this section: exponential growth and exponential decay. Having already worked with each of these functions gives us an advantage. Knowing their formal definitions, the behavior of their graphs, and some of their real-world applications gives us the opportunity to deepen our understanding. As each regression model is presented, key features and definitions of its associated function are included for review. Take a moment to rethink each of these functions, reflect on the work we’ve done so far, and then explore the ways regression is used to model real-world phenomena.
Building an Exponential Model from Data
As we’ve learned, there are a multitude of situations that can be modeled by exponential functions, such as investment growth, radioactive decay, atmospheric pressure changes, and temperatures of a cooling object. What do these phenomena have in common? For one thing, all the models either increase or decrease as time moves forward. But that’s not the whole story. It’s the way data increase or decrease that helps us determine whether it is best modeled by an exponential equation. Knowing the behavior of exponential functions in general allows us to recognize when to use exponential regression, so let’s review exponential growth and decay.
Recall that exponential functions have the form \(y=Ca^x\) or \(y=Ce^{kx}\). When performing regression analysis, we use the form most commonly used on graphing utilities, \(y=Ca^x\). Take a moment to reflect on the characteristics we’ve already learned about the exponential function \(y=Ca^x\) (assume \(a>0\)):
- \(a\) must be greater than zero and not equal to one.
- The initial value of the model is \(y=C\).
- If \(a>1\), the function models exponential growth. As \(x\) increases, the outputs of the model increase slowly at first, but then increase more and more rapidly, without bound.
- If \(0<a<1\), the function models exponential decay. As \(x\) increases, the outputs for the model decrease rapidly at first and then level off to become asymptotic to the x-axis. In other words, the outputs never become equal to or less than zero.
In real-world applications, we need to model the behavior of a function. In mathematical modeling, we choose a familiar general function with properties that suggest that it will model the real-world phenomenon we wish to analyze. In the case of rapid growth, we may choose the exponential growth function:
\[y=Ce^{kt}\]
where \(C\) is equal to the value at time zero, \(e\) is Euler’s constant, and \(k\) is a positive constant that determines the rate (percentage) of growth. We may use the exponential growth function in applications involving doubling time, the time it takes for a quantity to double. Such phenomena as wildlife populations, financial investments, biological samples, and natural resources may exhibit growth based on a doubling time. In some applications, however, as we will see when we discuss the logistic equation, the logistic model sometimes fits the data better than the exponential model.
On the other hand, if a quantity is falling rapidly toward zero, without ever reaching zero, then we should probably choose the exponential decay model. Again, we have the form \(y=Ce^{kt}\) where \(C\) is the starting value, and \(e\) is Euler’s constant. Now \(k\) is a negative constant that determines the rate of decay. We may use the exponential decay model when we are calculating half-life, or the time it takes for a substance to exponentially decay to half of its original quantity. We use half-life in applications involving radioactive isotopes.
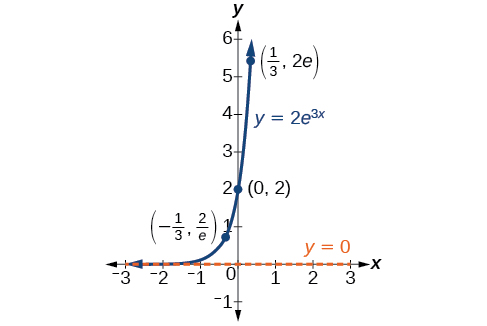
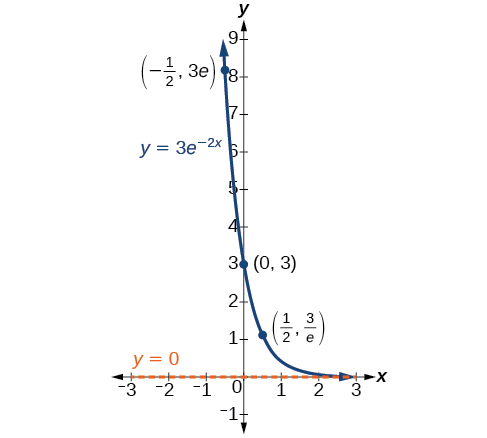
In our choice of a function to serve as a mathematical model, we often use data points gathered by careful observation and measurement to construct points on a graph and hope we can recognize the shape of the graph. Exponential growth and decay graphs have a distinctive shape, as we can see in Figure \(\PageIndex{2}\) and Figure \(\PageIndex{3}\). It is important to remember that, although parts of each of the two graphs seem to lie on the \(x\)-axis, they are really a tiny distance above the \(x\)-axis.
Exponential growth and decay often involve very large or very small numbers. To describe these numbers, we often use orders of magnitude. The order of magnitude is the power of ten, when the number is expressed in scientific notation, with one digit to the left of the decimal. For example, the distance to the nearest star, Proxima Centauri, measured in kilometers, is \(40,113,497,200,000\) kilometers. Expressed in scientific notation, this is \(4.01134972 × 10¹³\). So, we could describe this number as having order of magnitude \(1013\).
An exponential function with the form \(y=Ce^{kt}\) has the following characteristics:
- one-to-one function
- horizontal asymptote: \(y=0\)
- domain: \((–\infty, \infty)\)
- range: \((0,\infty)\)
- \(x\) intercept: none
- \(y\)-intercept: \((0,C)\)
- increasing if \(k>0\)
- decreasing if \(k<0\)
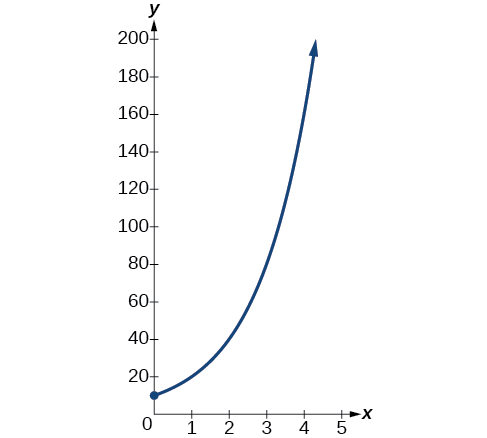
A population of bacteria doubles every hour. If the culture started with \(10\) bacteria, graph the population as a function of time.
Solution
When an amount grows at a fixed percent per unit time, the growth is exponential. To find \(C\) we use the fact that \(C\) is the amount at time zero, so \(C=10\). To find \(k\), use the fact that after one hour \((t=1)\) the population doubles from \(10\) to \(20\).The formula is derived as follows
\[\begin{align*} 20&= 10e^{k\cdot 1}\\ 2&= e^k \qquad \text{Divide by 10}\\ \ln2&= k \qquad \text{Take the natural logarithm} \end{align*}\]
so \(k=\ln(2)\). Thus the equation we want to graph is \(y=10e^{(\ln2)t}=10{(e^{\ln2})}^t=10·2^t\). The graph is shown in Figure \(\PageIndex{5}\).
Analysis
The population of bacteria after ten hours is \(10,240\). We could describe this amount is being of the order of magnitude \(10^4\). The population of bacteria after twenty hours is \(10,485,760\) which is of the order of magnitude \(10^7\), so we could say that the population has increased by three orders of magnitude in ten hours.
Calculating Doubling Time
For decaying quantities, we determined how long it took for half of a substance to decay. For growing quantities, we might want to find out how long it takes for a quantity to double. As we mentioned above, the time it takes for a quantity to double is called the doubling time.
Given the basic exponential growth equation \(y=Ce^{kt}\), doubling time can be found by solving for when the original quantity has doubled, that is, by solving \(2C=Ce^{kt}\).
The formula is derived as follows:
\[\begin{align*} 2A_0&= Ce^{kt}\\ 2&= e^{kt} \qquad \text{Divide by } C\\ \ln2&= kt \qquad \text{Take the natural logarithm}\\ t& =\dfrac{\ln2}{k} \qquad \text{Divide by the coefficient of t} \end{align*}\]
Thus the doubling time is
\[t=\dfrac{\ln2}{k}\]
According to Moore’s Law, the doubling time for the number of transistors that can be put on a computer chip is approximately two years. Give a function that describes this behavior.
Solution
The formula is derived as follows:
\[\begin{align*} t&= \dfrac{\ln2}{k} \qquad \text{The doubling time formula}\\ 2&= \dfrac{\ln2}{k} \qquad \text{Use a doubling time of two years}\\ k&= \dfrac{\ln2}{2} \qquad \text{Multiply by k and divide by 2}\\ y&= Ce^{\tfrac{\ln2}{2}t} \qquad \text{Substitute k into the continuous growth formula} \end{align*}\]
The function is \(y=Ce^{(\dfrac{\ln2}{2})t}\).
Recent data suggests that, as of 2013, the rate of growth predicted by Moore’s Law no longer holds. Growth has slowed to a doubling time of approximately three years. Find the new function that takes that longer doubling time into account.
- Answer
-
\(f(t)=Ce^{\tfrac{\ln2}{3}t}\)
Half-Life
We now turn to exponential decay. One of the common terms associated with exponential decay, as stated above, is half-life, the length of time it takes an exponentially decaying quantity to decrease to half its original amount. Every radioactive isotope has a half-life, and the process describing the exponential decay of an isotope is called radioactive decay.
To find the half-life of a function describing exponential decay, solve the following equation:
\(\dfrac{1}{2}C=Ce^{kt}\)
We find that the half-life depends only on the constant \(k\) and not on the starting quantity \(C\).
The formula is derived as follows
\[\begin{align*} \dfrac{1}{2}A_0&= Ce^{kt}\\ \dfrac{1}{2}&= e^{kt} \qquad \text{Divide by } C\\ \ln \left (\dfrac{1}{2} \right )&= ktv \qquad \text{Take the natural log}\\ -\ln(2)&= kt \qquad \text{Apply laws of logarithms}\\ -\ln(2)k&= t \qquad \text{Divide by k} \end{align*}\]
Since \(t\), the time, is positive, \(k\) must, as expected, be negative. This gives us the half-life formula
\[t=−\dfrac{\ln(2)}{k}\]
- Write \(y=Ce^{kt}\).
- Replace \(y\) by \(\dfrac{1}{2}C\) and replace \(t\) by the given half-life.
- Solve to find \(k\). Express \(k\) as an exact value (do not round).
Note: It is also possible to find the decay rate using \(k=−\ln(2)t\).
The half-life of carbon-14 is \(5,730\) years. Express the amount of carbon-14 remaining as a function of time, \(t\).
Solution
This formula is derived as follows.
\[\begin{align*} y&= Ce^{kt} \qquad \text{The continuous growth formula}\\ 0.5C&= Ce^{k\cdot 5730} \qquad \text{Substitute the half-life for t and } 0.5A_0 \text{ for } f(t)\\ 0.5&= e^{5730k} \qquad \text{Divide by } C\\ \ln(0.5)&= 5730k \qquad \text{Take the natural log of both sides}\\ k&= \dfrac{\ln(0.5)}{5730} \qquad \text{Divide by the coefficient of k}\\ y&= Ce^{ \left (\tfrac{\ln(0.5)}{5730} \right ) t} \qquad \text{Substitute for r in the continuous growth formula} \end{align*}\]
The function that describes this continuous decay is \(f(t)=Ce^{\left (\tfrac{\ln(0.5)}{5730} \right )t}\). We observe that the coefficient of \(t\), \(\dfrac{\ln(0.5)}{5730}≈−1.2097×10^{−4}\) is negative, as expected in the case of exponential decay.
The half-life of plutonium-244 is \(80,000,000\) years. Find function gives the amount of carbon-14 remaining as a function of time, measured in years.
- Answer
-
\(f(t)=Ce^{−0.0000000087t}\)
Radiocarbon Dating
The formula for radioactive decay is important in radiocarbon dating, which is used to calculate the approximate date a plant or animal died. Radiocarbon dating was discovered in 1949 by Willard Libby, who won a Nobel Prize for his discovery. It compares the difference between the ratio of two isotopes of carbon in an organic artifact or fossil to the ratio of those two isotopes in the air. It is believed to be accurate to within about \(1\%\) error for plants or animals that died within the last \(60,000\) years.
Carbon-14 is a radioactive isotope of carbon that has a half-life of \(5,730\) years. It occurs in small quantities in the carbon dioxide in the air we breathe. Most of the carbon on Earth is carbon-12, which has an atomic weight of \(12\) and is not radioactive. Scientists have determined the ratio of carbon-14 to carbon-12 in the air for the last \(60,000\) years, using tree rings and other organic samples of known dates—although the ratio has changed slightly over the centuries.
As long as a plant or animal is alive, the ratio of the two isotopes of carbon in its body is close to the ratio in the atmosphere. When it dies, the carbon-14 in its body decays and is not replaced. By comparing the ratio of carbon-14 to carbon-12 in a decaying sample to the known ratio in the atmosphere, the date the plant or animal died can be approximated.
Since the half-life of carbon-14 is \(5,730\) years, the formula for the amount of carbon-14 remaining after \(t\) years is
\(y≈Ce^{\left (\tfrac{\ln(0.5)}{5730} \right )t}\)
where
- \(y\) is the amount of carbon-14 remaining
- \(C\) is the amount of carbon-14 when the plant or animal began decaying.
This formula is derived as follows:
\[\begin{align*} y&= Ce^{kt} \qquad \text{The continuous growth formula}\\ 0.5C&= Ce^{k\cdot 5730} \qquad \text{Substitute the half-life for t and } 0.5C \text{ for f(t)}\\ 0.5&= e^{5730k} \qquad \text{Divide by } C\\ \ln(0.5)&= 5730k \qquad \text{Take the natural log of both sides}\\ k&= \dfrac{\ln(0.5)}{5730} \qquad \text{Divide by the coefficient of k}\\ y&= Ce^{\left (\tfrac{\ln(0.5)}{5730} \right )t} \qquad \text{Substitute for r in the continuous growth formula}\\ \end{align*}\]
To find the age of an object, we solve this equation for \(t\):
\(t=\dfrac{\ln \left (\dfrac{y}{C} \right )}{−0.000121}\)
Out of necessity, we neglect here the many details that a scientist takes into consideration when doing carbon-14 dating, and we only look at the basic formula. The ratio of carbon-14 to carbon-12 in the atmosphere is approximately \(0.0000000001%\). Let \(r\) be the ratio of carbon-14 to carbon-12 in the organic artifact or fossil to be dated, determined by a method called liquid scintillation. From the equation \(y≈Ce^{−0.000121t}\) we know the ratio of the percentage of carbon-14 in the object we are dating to the percentage of carbon-14 in the atmosphere is \(r=\dfrac{y}{C}≈e^{−0.000121t}\). We solve this equation for \(t\), to get
\(t=\dfrac{\ln(r)}{−0.000121}\)
- Express the given percentage of carbon-14 as an equivalent decimal, \(k\).
- Substitute for \(k\) in the equation \(t=\dfrac{\ln(r)}{−0.000121}\) and solve for the age, \(t\).
A bone fragment is found that contains \(20\%\) of its original carbon-14. To the nearest year, how old is the bone?
Solution
We substitute \(20\%=0.20\) for \(k\) in the equation and solve for \(t\):
\[\begin{align*} t&= \dfrac{\ln(r)}{-0.000121} \qquad \text{Use the general form of the equation}\\ &= \dfrac{\ln(0.20)}{-0.000121} \qquad \text{Substitute for r}\\ &\approx 13301 \qquad \text{Round to the nearest year} \end{align*}\]
The bone fragment is about \(13,301\) years old.
Analysis
The instruments that measure the percentage of carbon-14 are extremely sensitive and, as we mention above, a scientist will need to do much more work than we did in order to be satisfied. Even so, carbon dating is only accurate to about \(1\%\), so this age should be given as \(13,301\) years \(\pm 1\%\) or \(13,301\) years \(\pm 133\) years.
Cesium-137 has a half-life of about \(30\) years. If we begin with \(200\) mg of cesium-137, will it take more or less than \(230\) years until only \(1\) milligram remains?
- Answer
-
less than \(230\) years, \(229.3157\) to be exact
This page titled 6.7: Applications of Exponential Functions was last modified on Thu, 19 Dec 2024 17:21:40 GMT and is shared under a CC BY 4.0 license and was authored, remixed, and/or curated by Leif Jordan (College of the Desert) via source content that was edited to the style and standards of the LibreTexts platform.
The book could not be loaded just now.