From LibreTexts, under not declared, as the source states it; its equations are written in TeX, which the PDF shows typeset. This page at LibreTexts.
5.4.2: Homework
Opening the book…
Reading Questions
If a point \((x,y)\) is on the terminal side of an angle \(\theta\) on a circle of radius \(r\), what are the formulas for \(x\) and \(y\) in terms of \(r\) and \(\theta\)?
In the sinusoidal model \(f(t) = A \sin(Bt + C) + D\), what does each parameter (\(A, B, C, D\)) represent in terms of the graph's properties?
What is the difference between ordinary frequency and angular frequency?
How is the period of a sinusoidal function related to its ordinary frequency?
What is the difference between a phase angle and a phase shift?
If a sinusoidal model has a maximum value of 50 and a minimum value of 10, what are its amplitude and midline?
If a Ferris wheel completes 2 revolutions in 120 seconds, what is its period in seconds?
Using the period from the previous question, what would be the angular frequency, \(B\), for a sinusoidal model of the Ferris wheel's motion?
When building a sinusoidal model from data, what feature of the data helps you determine the vertical shift (midline)?
When building a sine model (\(A>0\)) from data, what feature of the data helps you determine the phase shift?
Homework
Vocabulary Check
Change in position is also known as ___.
The period of a function measures the number of ___ per ___.
The ordinary frequency (or, simply, frequency) of a sinusoid measures the number of ___ per ___.
The unit for frequency is the ___.
In the function\[ f(t) = A\,\sin\left( Bt + C \right) + D, \nonumber \]\( B \) is called the ___, \( C \) is called the ___, and \( -\frac{C}{B} \) is called the ___.
Concept Check
True or False? For the following exercises, determine if the statement is true or false. If true, cite the definition or theorem stated in the text supporting your claim. If false, explain why it is false and, if possible, correct the statement.
The following questions concern the sinusoidal function\[ f(t) = A \, \sin\left( Bt + C \right) + D. \nonumber \]
\( B \) is the period
\( C \) is the phase shift
\( y = D \) is the midline
\( -\frac{C}{B} \) is the phase shift
If \( T \) is the period of the sinusoid and \( f \) is the frequency, \( f = \frac{1}{T} \).
Basic Skills
For the following exercises,
(a) Estimate the amplitude, period, and midline of a sinusoidal function that fits the data.
(b)Write a formula for the function.
\(t\)
0
0.25
0.5
0.75
1
1.25
1.5
1.75
2
2.25
2.5
\(f(t)\)
5.2
4.26
2
-0.26
-1.2
-0.26
2
4.26
5.2
4.26
2
\(s\)
0
1
2
3
4
5
6
7
8
9
10
\(g(s)\)
3
2.58
2.4
2.58
3
3.42
3.6
3.42
3
2.58
2.4
\(x\)
0
0.1
0.2
0.3
0.4
0.5
0.6
0.7
0.8
\(H(x)\)
5
7.9
9.8
9.8
7.9
5
2.1
0.2
0.2
\(t\)
0
0.79
1.57
2.36
3.14
3.93
4.71
5.50
6.28
\(V(t)\)
1
-0.17
-3
-5.8
-7
-5.3
-3
-0.17
1
Applications
The sounds we hear are made up of mechanical waves. The note "A" above the note "middle C" is a sound wave with ordinary frequency\[f=440 \text { Hertz }=440 \frac{\text { cycles }}{\text { second }}.\nonumber \]Find a sinusoid which models this note, assuming that the amplitude is 1 and the phase shift is 0.
The average daily high temperature in Fairbanks, Alaska can be approximated by a sinusoidal function with a period of 12 months. The low temperature of \(-1.6^{\circ}\) occurs in January, and the high temperature of \(72.3^{\circ}\) in July.
What are the midline, period, and amplitude?
Write a formula for the average daily high temperature \(T(m)\), where \(m\) is the number of months since January.
What is the displacement of the temperature?
What is the ordinary frequency?
What is the angular frequency?
Graph \(T(m)\) for two periods, labeling the points that correspond to highest and lowest average temperature.
Depending on its phase, the moon looks like a disk that is partially visible and partially in shadow. The visible fraction ranges from \(0 \%\) to \(100 \%\) and can be approximated by a sinusoidal function \(V(t)\), where \(t\) is the number of days since the last full moon. The time between successive full moons (a lunar month) is 29.5 days.
What are the period, midline, and amplitude of \(V(t)\)?
Write a formula for \(V(t)\).
What is the ordinary frequency?
What is the angular frequency?
Graph your function over two periods, labeling the points that correspond to full moon, half moon, and new moon.
The height of a child’s toy suspended at the end of a spring is approximated by a sinusoidal function. The toy’s height ranges between 200 centimeters and 260 centimeters above the ground, and it completes one up-and-down cycle every 0.8 seconds.
What are the midline, period, and amplitude?
Let \(h(t)\) be the height of the toy in centimeters, where \(t = 0\) seconds corresponds to a time when the object was at the midline and moving upwards. Graph \(h(t)\) for two periods, labeling the points that correspond to the high and low positions of the toy.
What is the ordinary frequency of \( h(t) \)?
What is the angular frequency of \( h(t) \)?
When does the toy reach its maximum height the second time?
The voltage, \(V\), in an alternating current source has amplitude \(220 \sqrt{2}\) and ordinary frequency \(f=60 \text { Hertz}\). Find a sinusoid which models this voltage. Assume that the phase is 0.
The London Eye is a popular tourist attraction in London, England and is one of the largest Ferris Wheels in the world. It has a diameter of 135 meters and makes one revolution (counterclockwise) every 30 minutes. It is constructed so that the lowest part of the Eye reaches ground level, enabling passengers to simply walk on and off the ride. Find a sinusoid which models the height \(h\) of the passenger above the ground in meters \(t\) minutes after they board the Eye at ground level.
Repeat the previous problem, but find a sinusoid which models the horizontal displacement, \(x\), of the passenger from the center of the Eye in meters \(t\) minutes after they board the Eye. Here we take \(x(t) \gt 0\) to mean the passenger is to the right of the center, while \(x(t) \lt 0\) means the passenger is to the left of the center.
The average daily maximum temperature in Stockholm, Sweden is \(30^{\circ}\)F in January and \(72^{\circ}\)F in July.
Sketch a sinusoidal graph of \(S(t)\), the average maximum temperature in Stockholm as a function of time, for one year.
Give the period, midline, and amplitude of your graph.
Write an equation for the function.
The average daily maximum temperature in Riyadh, Saudi Arabia is \(86^{\circ}\)F in January and \(113^{\circ}\)F in July.
Sketch a sinusoidal graph of \(R(t)\), the average maximum temperature in Riyadh as a function of time, for one year.
Give the period, midline, and amplitude of your graph.
Write an equation for the function.
The height of the tide in Cabot Cove can be approximated by a sinusoidal function. At 5 am on July 23, the water level reached its high mark at the 20-foot line on the pier, and at 11 am, the water level was at its lowest at the 4-foot line.
Sketch a graph of \(W(t)\), the water level as a function of time, from 5 am on July 23 to 5 am on July 24.
Give the period, midline, amplitude of your graph.
State the phase angle and phase shift.
State the ordinary frequency and angular frequency.
Write an equation for the function.
The population of mosquitoes at Marsh Lake is a sinusoidal function of time. The population peaks around June 1 at about 6000 mosquitoes per square kilometer, and is smallest on December 1, at 1000 mosquitoes per square kilometer.
Sketch a graph of \(M(t)\), the number of mosquitoes as a function of the month, where \(t=0\) on June 1.
Give the period, midline, amplitude of your graph.
State the phase angle and phase shift.
State the ordinary frequency and angular frequency.
Write an equation for the function.
The paddlewheel on the Delta Queen steamboat is 28 feet in diameter, and is rotating once every ten seconds. The bottom of the paddlewheel is 4 feet below the surface of the water.
The ship's logo is painted on one of the paddlewheel blades. At \(t=0\), the blade with the logo is at the top of the wheel. Sketch a graph of the logo's height above the water as a function of \(t\).
Give the period, midline, amplitude of your graph.
State the phase angle and phase shift.
State the ordinary frequency and angular frequency.
Write an equation for the function.
Min’s bicycle wheel is 24 inches in diameter, and she has a light attached to the spokes 10 inches from the center of the wheel. It is dark, and she is cycling home slowly from work. The bicycle wheel makes one revolution every second.
At \(t=0\), the light is at its highest point the bicycle wheel. Sketch a graph of the light's height as a function of \(t\).
Give the period, midline, amplitude of your graph.
State the phase angle and phase shift.
State the ordinary frequency and angular frequency.
Write an equation for the function.
You are performing the yo-yo trick, "Around the World," in which the yo-yo is thrown so it sweeps out a vertical circle. Suppose the yo-yo string is 28 inches and it completes one revolution in 3 seconds. If the closest the yo-yo ever gets to the ground is 2 inches, find a sinusoid which models the height, \(h\), of the yo-yo above the ground in inches \(t\) seconds after it leaves its lowest point.
The table below lists the average temperature of Lake Erie as measured in Cleveland, Ohio on the first of the month for each month during the years 1971 – 2000. For example, \(t = 3\) represents the average of the temperatures recorded for Lake Erie on every March 1 for the years 1971 through 2000.\[\begin{array}{|l|r|r|r|r|r|r|r|r|r|r|r|r|}
\hline \begin{array}{l} \text { Month } \\ \text { Number, } t \end{array} & 1 & 2 & 3 & 4 & 5 & 6 & 7 & 8 & 9 & 10 & 11 & 12 \\[6pt] \hline \begin{array}{l} \text { Temperature } \\ \left({ }^{\circ} \mathrm{F}\right), T \end{array} & 36 & 33 & 34 & 38 & 47 & 57 & 67 & 74 & 73 & 67 & 56 & 46 \\ \hline
\end{array}\nonumber\]
Fit a sinusoid to these data.
Using graphing technology, graph your model along with the data set to judge the reasonableness of the fit.
Use the model you found in part (a) to predict the average temperature recorded for Lake Erie on April 15th and September 15th during the years 1971–2000.
Compare your results to those obtained using graphing technology.
The fraction of the moon illuminated at midnight Eastern Standard Time on the \(t^{\text {th}}\) day of June, 2009 is given in the table below.\[\begin{array}{|l|r|r|r|r|r|r|r|r|r|r|}
\hline \begin{array}{l} \text { Day of } \\ \text { June, } t \end{array} & 3 & 6 & 9 & 12 & 15 & 18 & 21 & 24 & 27 & 30 \\[6pt] \hline \begin{array}{l} \text { Fraction } \\ \text{ Illuminated }, F \end{array} & 0.81 & 0.98 & 0.98 & 0.83 & 0.57 & 0.27 & 0.04 & 0.03 & 0.26 & 0.58 \\ \hline
\end{array}\nonumber\]
Fit a sinusoid to these data.
Using graphing technology, graph your model along with the data set to judge the reasonableness of the fit.
Use the model you found in part (a) to predict the fraction of the moon illuminated on June 1, 2009.
Compare your results to those obtained using graphing technology.
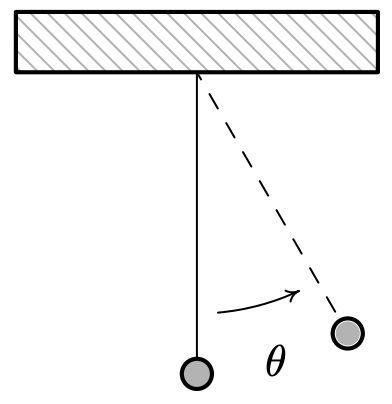
Consider the pendulum below. Ignoring air resistance, the angular displacement of the pendulum from the vertical position, \( \theta \), can be modeled as a sinusoid.
The amplitude of the sinusoid is the same as the initial angular displacement, \( \theta_0 \), of the pendulum and the period of the motion is given by\[T=2 \pi \sqrt{\dfrac{l}{g}},\nonumber\]where \(l\) is the length of the pendulum and \(g \approx 9.8 \frac{\text{m}}{\text{s}^2}\) is the acceleration due to gravity.
Find a sinusoid which gives the angular displacement \(\theta\) as a function of time, \(t\). Arrange things so \(\theta(0)=\theta_{0}\).
Suppose Sang's Seth-Thomas antique schoolhouse clock needs a period of \(T = \frac{1}{2}\) second and she can adjust the length of the pendulum via a small dial on the bottom of the bob. At what length should she set the pendulum?
Continuing with part (b) and assuming the initial displacement of the pendulum is \(15^{\circ}\), find a sinusoid which models the displacement of the pendulum, \(\theta\), as a function of time, \(t\), in seconds.
This page titled 5.4.2: Homework was last modified on Thu, 03 Jul 2025 07:15:28 GMT and is shared under a not declared license and was authored, remixed, and/or curated by Roy Simpson.