Opening the book…
- Determine the shape and behavior of the solutions of the first order differential equation \(y′=f(x,y)\).
- Obtain approximate solutions using the slope field of \(y′=f(x,y)\) at a point \((x_0,y_0)\).
The general first order equation we are studying looks like
\[ y' = f(x,y) \nonumber \]
In general, we cannot simply solve these kinds of equations explicitly. It would be nice if we could at least figure out the shape and behavior of the solutions, or if we could find approximate solutions. At this point it may be good to first try the Lab I and/or Project I from the IODE website.
Slope fields
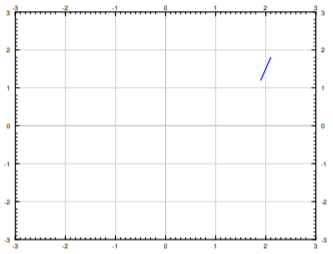
The equation \(y' = f(x,y)\) gives you a slope at each point in the \((x,y)\)-plane. And this is the slope a solution \(y(x)\) would have at \(x\) if its value was \(y\). In other words, \(f(x,y)\) is the slope of a solution whose graph runs through the point \((x,y)\). At a point \((x,y)\), we plot a short line with the slope \(f(x,y)\). For example, if \(f(x,y) = xy\), then at point \((2,1.5)\) we draw a short line of slope \(xy = 2 \times 1.5 = 3\). So, if \(y(x)\) is a solution and \(y(2) = 1.5\), then the equation mandates that \(y'(2) = 3\). See Figure \(\PageIndex{1}\).
To get an idea of how solutions behave, we draw such lines at lots of points in the plane, not just the point \((2,1.5)\). We would ideally want to see the slope at every point, but that is just not possible. Usually we pick a grid of points fine enough so that it shows the behavior, but not too fine so that we can still recognize the individual lines. We call this picture the of the equation. See Figure \(\PageIndex{2}\) for the slope field of the equation \(y' = xy\). Usually in practice, one does not do this by hand, but has a computer do the drawing.
Suppose we are given a specific initial condition \(y(x_0) = y_0\). A solution, that is, the graph of the solution, would be a curve that follows the slopes we drew. For a few sample solutions, see Figure \(\PageIndex{3}\). It is easy to roughly sketch (or at least imagine) possible solutions in the slope field, just from looking at the slope field itself. You simply sketch a line that roughly fits the little line segments and goes through your initial condition.
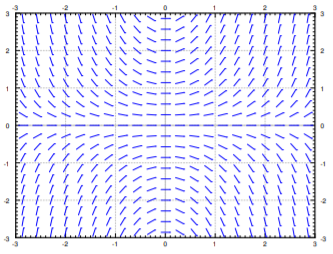
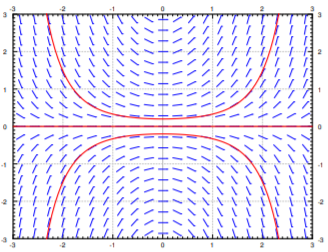
By looking at the slope field we get a lot of information about the behavior of solutions without having to solve the equation. For example, in Figure \(\PageIndex{3}\) we see what the solutions do when the initial conditions are \(y(0) > 0\), \(y(0) = 0\) and \(y(0) < 0\). A small change in the initial condition causes quite different behavior. We see this behavior just from the slope field and imagining what solutions ought to do.
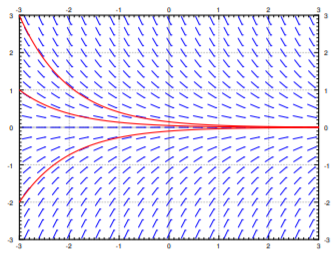
We see a different behavior for the equation \(y' = -y\). The slope field and a few solutions is in see Figure \(\PageIndex{4}\). If we think of moving from left to right (perhaps \(x\) is time and time is usually increasing), then we see that no matter what \(y(0)\) is, all solutions tend to zero as \(x\) tends to infinity. Again that behavior is clear from simply looking at the slope field itself.
We can use a computer software to obtain a slope field of a differential equation, such as the GeoGebra slope field generator below.
The video below shows how to use the GeoGebra slope field genereator to reproduce a slope field of a differential equation.
The video above was made by MathIsPower4u and is licensed under a Creative Commons Attribution-ShareAlike 3.0 Unported License.
Use the GeoGebra slope field generator below to practice reproducing slope fields. This applet will generate slope fields and approximate solution curves given initial values. Click and drag the initial point A to see its corresponding solution curve.
Credits: Originally created by Chip Rollinson.
This page titled 2.2: Slope Fields was last modified on Fri, 02 May 2025 15:50:45 GMT and is shared under a CC BY-SA 4.0 license and was authored, remixed, and/or curated by Jiří Lebl.
The book could not be loaded just now.