Opening the book…
Now we’ll simulate the trajectory of the baseball with a range of launch angles. First, we’ll take the code we have and wrap it in a function that takes the launch angle as an input variable, runs the simulation, and returns the distance the ball travels (Listing 13.1).
Listing 13.1: A function that takes the launch angle of a baseball and returns the distance it travels
function res = baseball_range(theta)
    P = [0; 1];
    v = 50;
    [vx, vy] = pol2cart(theta, v);

    V = [vx; vy];     % initial velocity in m/s
    W = [P; V];       % initial condition

    tspan = [0 10];
    options = odeset('Events', @event_func);
    [T, M] = ode45(@rate_func, tspan, W, options);

    res = M(end, 1);
end
The launch angle, theta, is in radians. The magnitude of velocity, v, is always 50 m/s. We use pol2cart to convert the angle and magnitude (polar coordinates) to Cartesian components, vx and vy.
After running the simulation we extract the final \(x\)-position and return it as an output variable.
We can run this function for a range of angles like this:
    thetas = linspace(0, pi/2);
    for i = 1:length(thetas)
        ranges(i) = baseball_range(thetas(i));
    end
And then plot ranges as a function of thetas:
plot(thetas, ranges)Figure 13.2 shows the result. As expected, the ball does not travel far if it’s hit nearly horizontal or vertical. The peak is apparently near 0.7 rad.
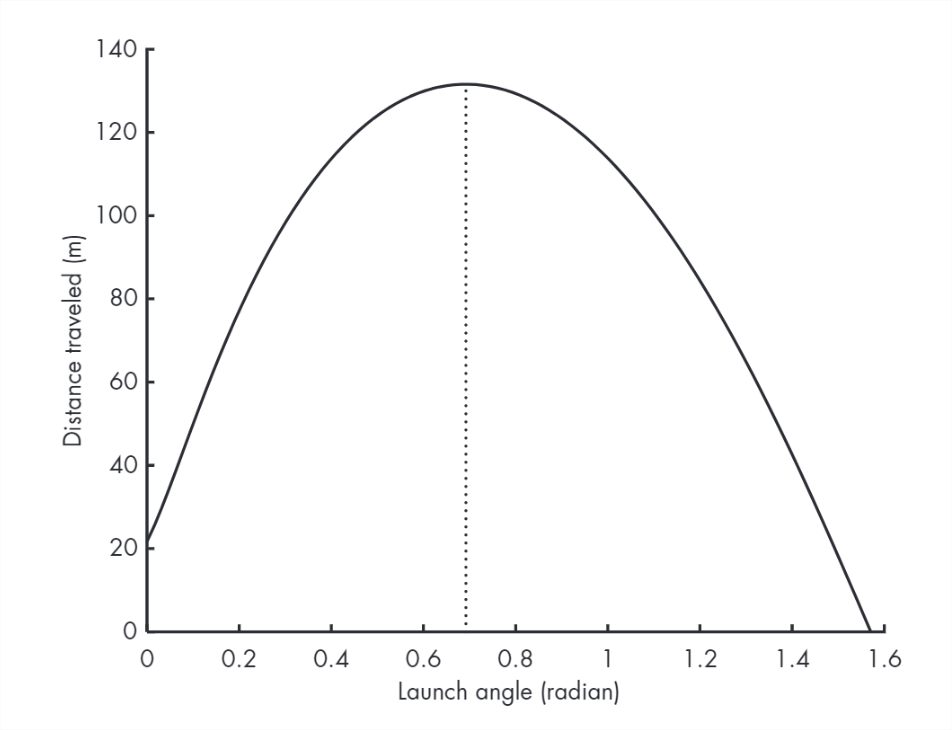 Figure 13.2: Simulated flight of a baseball plotted as a trajectory
Considering that our model is only approximate, this result might be good enough. But if we want to find the peak more precisely, we can use fminsearch.
This page titled 13.3: Range Versus Angle was last modified on Thu, 17 Nov 2022 18:20:12 GMT and is shared under a CC BY-NC 4.0 license and was authored, remixed, and/or curated by Allen B. Downey (Green Tea Press) via source content that was edited to the style and standards of the LibreTexts platform.
The book could not be loaded just now.