Opening the book…
Using the following experimental values 1, plot a distance-time graph and determine the equation, relating the distance and time for a moving object.
| Distance [m] | Time [s] |
| 0 | 0 |
| 24 | 5 |
| 48 | 10 |
| 72 | 15 |
| 96 | 20 |
Experimental data.
- Answer
-
Data can be entered as follows: distance=[0 24 48 72 96]; time=[0 5 10 15 20]; we can now plot the data by typing in plot(time,distance);title('Distance-Time Graph');xlabel('time');ylabel('distance'); at the MATLAB prompt. The following plot is generated, select Tools > Basic Fitting:
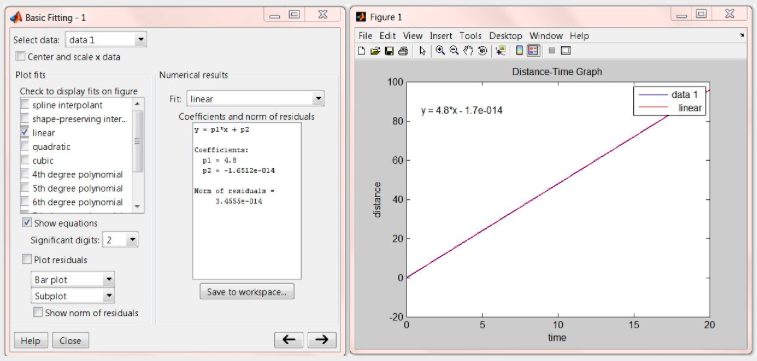
As shown above, the relationship between distance and time is:
\(y=4.8 x-1.7 \times 10^{-14}\)
or
Distance \(=4.8\) Time \(-1.7 \times 10^{-14}\)
Using the data set below, determine the relationship between temperature and internal energy.
| Temperature [C] | Internal Energy [kJ/kg] |
| 100 | 2506.7 |
| 150 | 2582.8 |
| 200 | 2658.1 |
| 250 | 2733.7 |
| 300 | 2810.4 |
| 400 | 2967.9 |
| 500 | 3131.6 |
An extract from Steam Tables
- Answer
-
Data can be entered as follows:temperature = [100, 150, 200, 250, 300, 400, 500]; energy = [2506.7, 2582.8, 2658.1, 2733.7, 2810.4, 2967.9, 3131.6]; we can now plot the data by typing in plot(temperature,energy);title('temperature vs. energy');xlabel('temperature');ylabel('energy'); at the MATLAB prompt. The following plot is generated, select Tools > Basic Fitting:
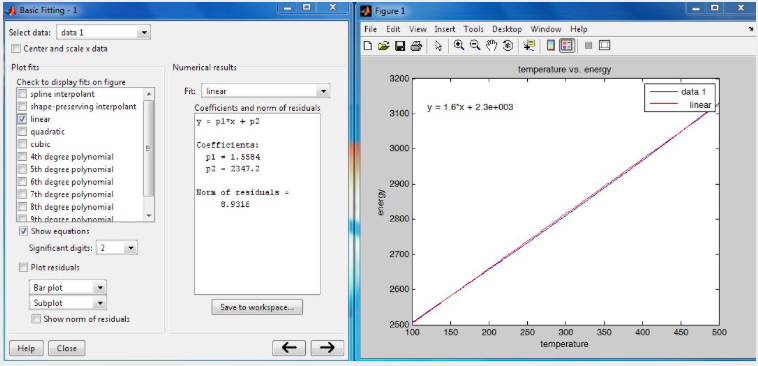
As shown above, the relationship between temperature and internal energy is:
\(y=1.6 x+2347.2\)
or
internal energy \(=1.6\) temperature \(+2347.2\)
Using the following experimental values 2, plot a velocity-time graph and determine the equation, relating the velocity and time for a moving object.
| Velocity [m/s] | Time [s] |
| 12 | 0 |
| 142 | 5 |
| 512 | 10 |
| 1122 | 15 |
| 1972 | 20 |
Experimental data.
- Answer
-
Data can be entered as follows: velocity=[12 142 512 1122 1972]; time=[0 5 10 15 20]; we can now plot the data by typing in plot(time,velocity);title('Velocity-Time Graph');xlabel('time');ylabel('velocity'); at the MATLAB prompt. The following plot is generated, select Tools > Basic Fitting, notice that we are choosing the quadratic option this time:
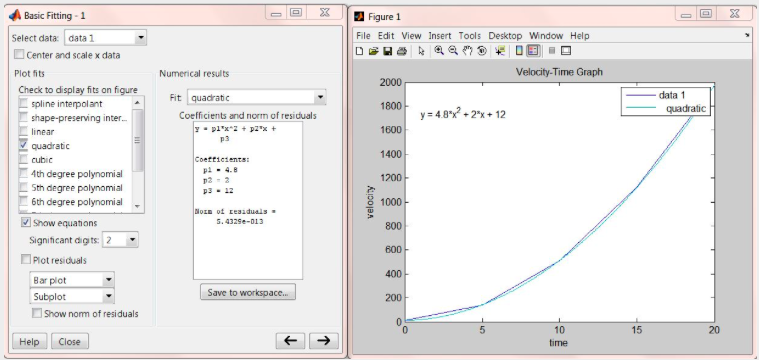
As shown above, the relationship between velocity and time is:
\(y=4.8 x^{2}+2 x+12\)
Footnotes
This page titled 1.7.1: Problem Set was last modified on Sat, 31 Jul 2021 15:49:12 GMT and is shared under a CC BY 4.0 license and was authored, remixed, and/or curated by Serhat Beyenir via source content that was edited to the style and standards of the LibreTexts platform.
The book could not be loaded just now.