Opening the book…
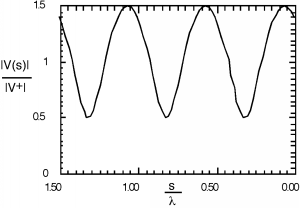
In making this plot, we have made use of the fact that the propagation constant can also be expressed as , and so for the independent variable, instead of showing in meters or whatever, we normalize the distance away from the load to the wavelength of the excitation signal, and hence show distance in wavelengths. What we are showing here is called a standing wave. There are places along the line where the magnitude of the voltage has a maximum value. This is where and are adding up in phase with one another, and places where there is a voltage minimum, where and add up out of phase. Since , the maximum value of the standing wave pattern is times and the minimum is times . Note that anywhere on the line, the voltage is still oscillating at , and so it is not a constant, it is just that the magnitude of the oscillating signal changes as we move down the line. If we were to put an oscilloscope across the line, we would see an AC signal, oscillating at a frequency .
A number of considerable interest is the ratio of the maximum voltage amplitude to the minimum voltage amplitude, called the voltage standing wave ratio, or VSWR for short. It is easy to see that:
Note that because , .
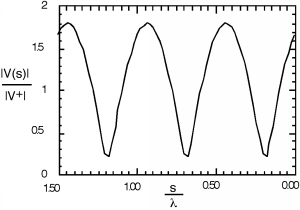
Although Figure \(\PageIndex{1}\) looks like the standing wave pattern is more or less sinusoidal, if we increase to 0.8, we see that it most definitely is not. There is also a temptation to say that the spacing between minima (or maxima) of the standing wave pattern is , the wavelength of the signal, but a closer inspection of either Figure \(\PageIndex{1}\) or Figure \(\PageIndex{2}\) shows that in fact the spacing between features is only half a wavelength, or . Why is this? Well, goes as and , and so every time increases by , decreases by and we have come one full cycle on the way behaves.
Now let's go back to the crank diagram. At the position shown, we are at a voltage maximum, and just equals the VSWR.
Note also that at this particular point, that the voltage and current phasors are in phase with one another (lined up in the same direction) and hence the impedance must be real or resistive.
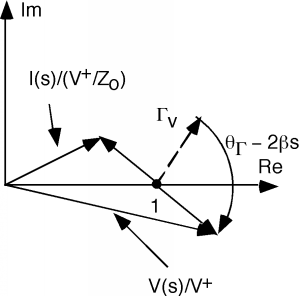
We can move further down the line, and now the phasor starts shrinking and the phasor starts to get bigger, as shown in Figure \(\PageIndex{3}\).
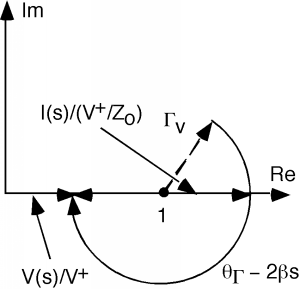
If we move even further down the line, we get to a point where the current phasor is now at a maximum value, and the voltage phasor is at a minimum value, as seen in Figure \(\PageIndex{4}\). We are now at a voltage minimum, the impedance is again real (the voltage and current phasors are lined up with one another, so they must be in phase) and
The only problem we have here is that except at a voltage minimum or maximum, finding from the crank diagram is not very straightforward, since the voltage and current are out of phase, and dividing the two vectors becomes somewhat tedious.
This page titled 6.6: Standing Waves/VSWR was last modified on Tue, 25 Aug 2026 20:54:08 GMT and is shared under a CC BY 1.0 license and was authored, remixed, and/or curated by Bill Wilson via source content that was edited to the style and standards of the LibreTexts platform.
The book could not be loaded just now.