Opening the book…
The subplot() function allows you to place more than 1 plot within a single figure.
These examples show its use. More information can be obtained by using "help subplot"
subplot() with 2 rows & 1 column
%% 2 Subplots

figure

subplot(2,1,1);

x = 0 : 0.1 : 13;

y1 = sin(x);

plot(x,y1)

grid on;
subplot(2,1,2);

y2 = cos(x);

plot(x,y2)

grid on;
Solution
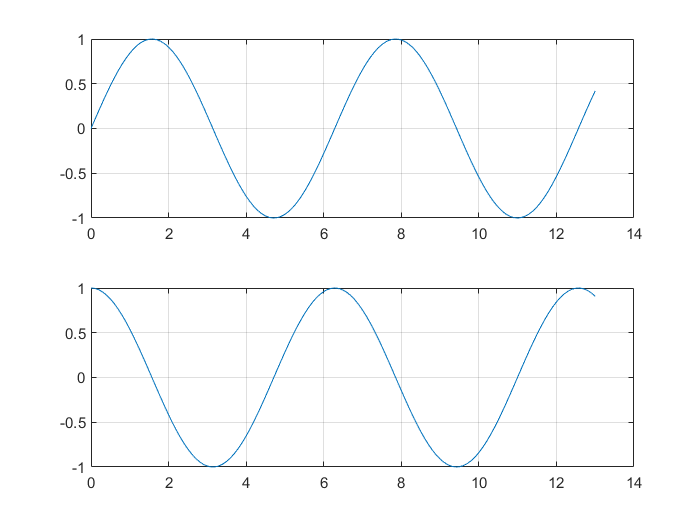
.
subplot() with 3 rows & 2 columns
%% 3x2 Subplots

figure

subplot(3,2,1);

x = 0 : 0.1 : 13;

ys1 = sin(x);

plot(x,ys1)

grid on;
subplot(3,2,3);

x = 0 : 0.1 : 13;

ys2 = sin(2*x);

plot(x,ys2)

grid on;
subplot(3,2,5);

x = 0 : 0.1 : 13;

ys3 = sin(3*x);

plot(x,ys3)

grid on;
subplot(3,2,2);

yc1 = cos(x);

plot(x,yc1)

grid on;
subplot(3,2,4);

yc2 = cos(2*x);

plot(x,yc2)

grid on;
subplot(3,2,6);

yc3 = cos(3*x);

plot(x,yc3)

grid on;
Solution
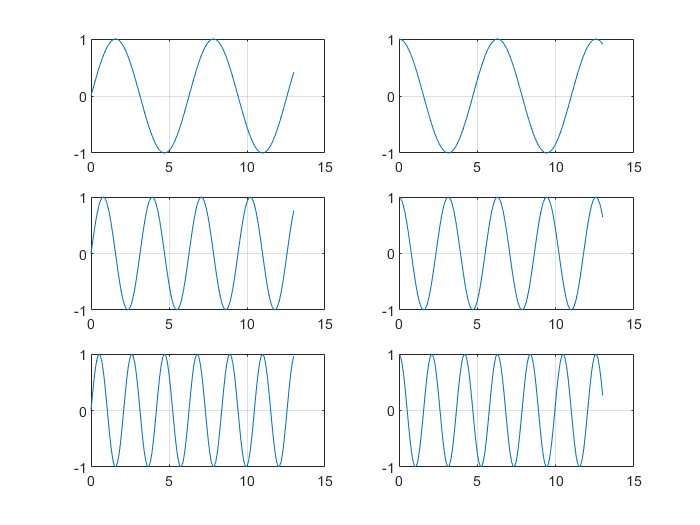
.
This page titled 14.5: Subplots was last modified on Sun, 04 Aug 2024 22:06:50 GMT and is shared under a CC BY-NC-SA license and was authored, remixed, and/or curated by Carey Smith.
The book could not be loaded just now.