From LibreTexts, under CC BY-NC-SA 4.0, as the source states it; its equations are written in TeX, which the PDF shows typeset. This page at LibreTexts.
11.5: A Set of Resulting Graphs
Opening the book…
13.5.1 Single Particle
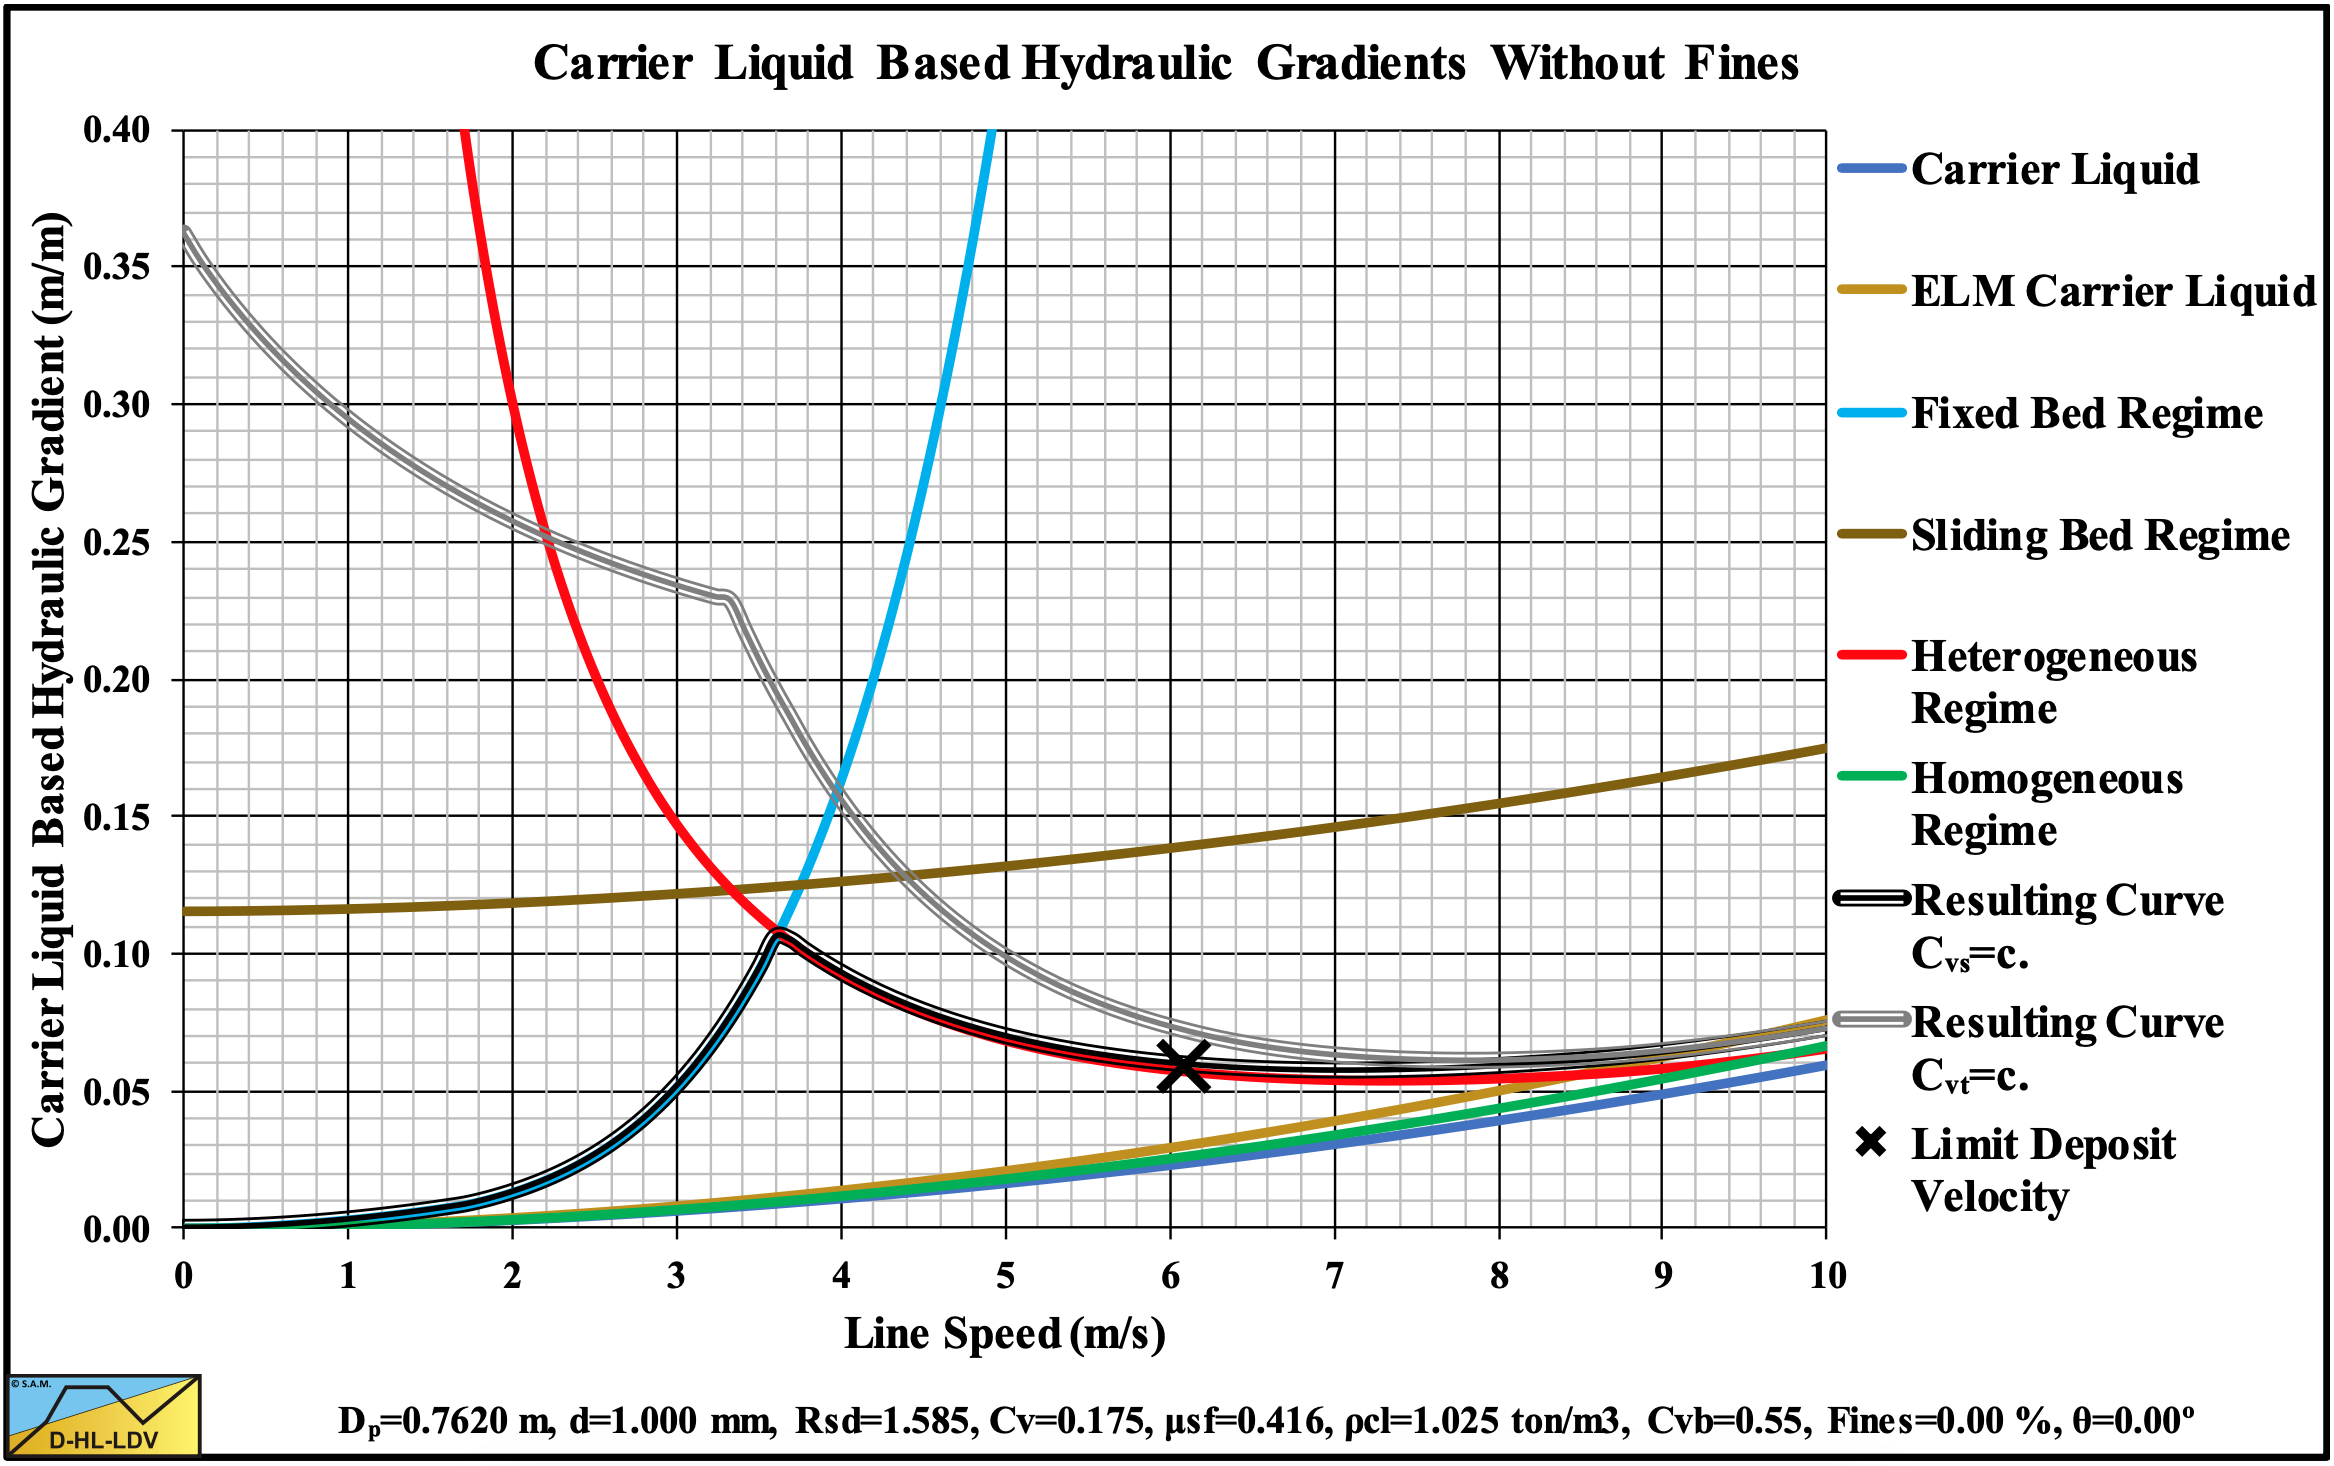
Figure 13.5-1: The hydraulic gradient versus the line speed.
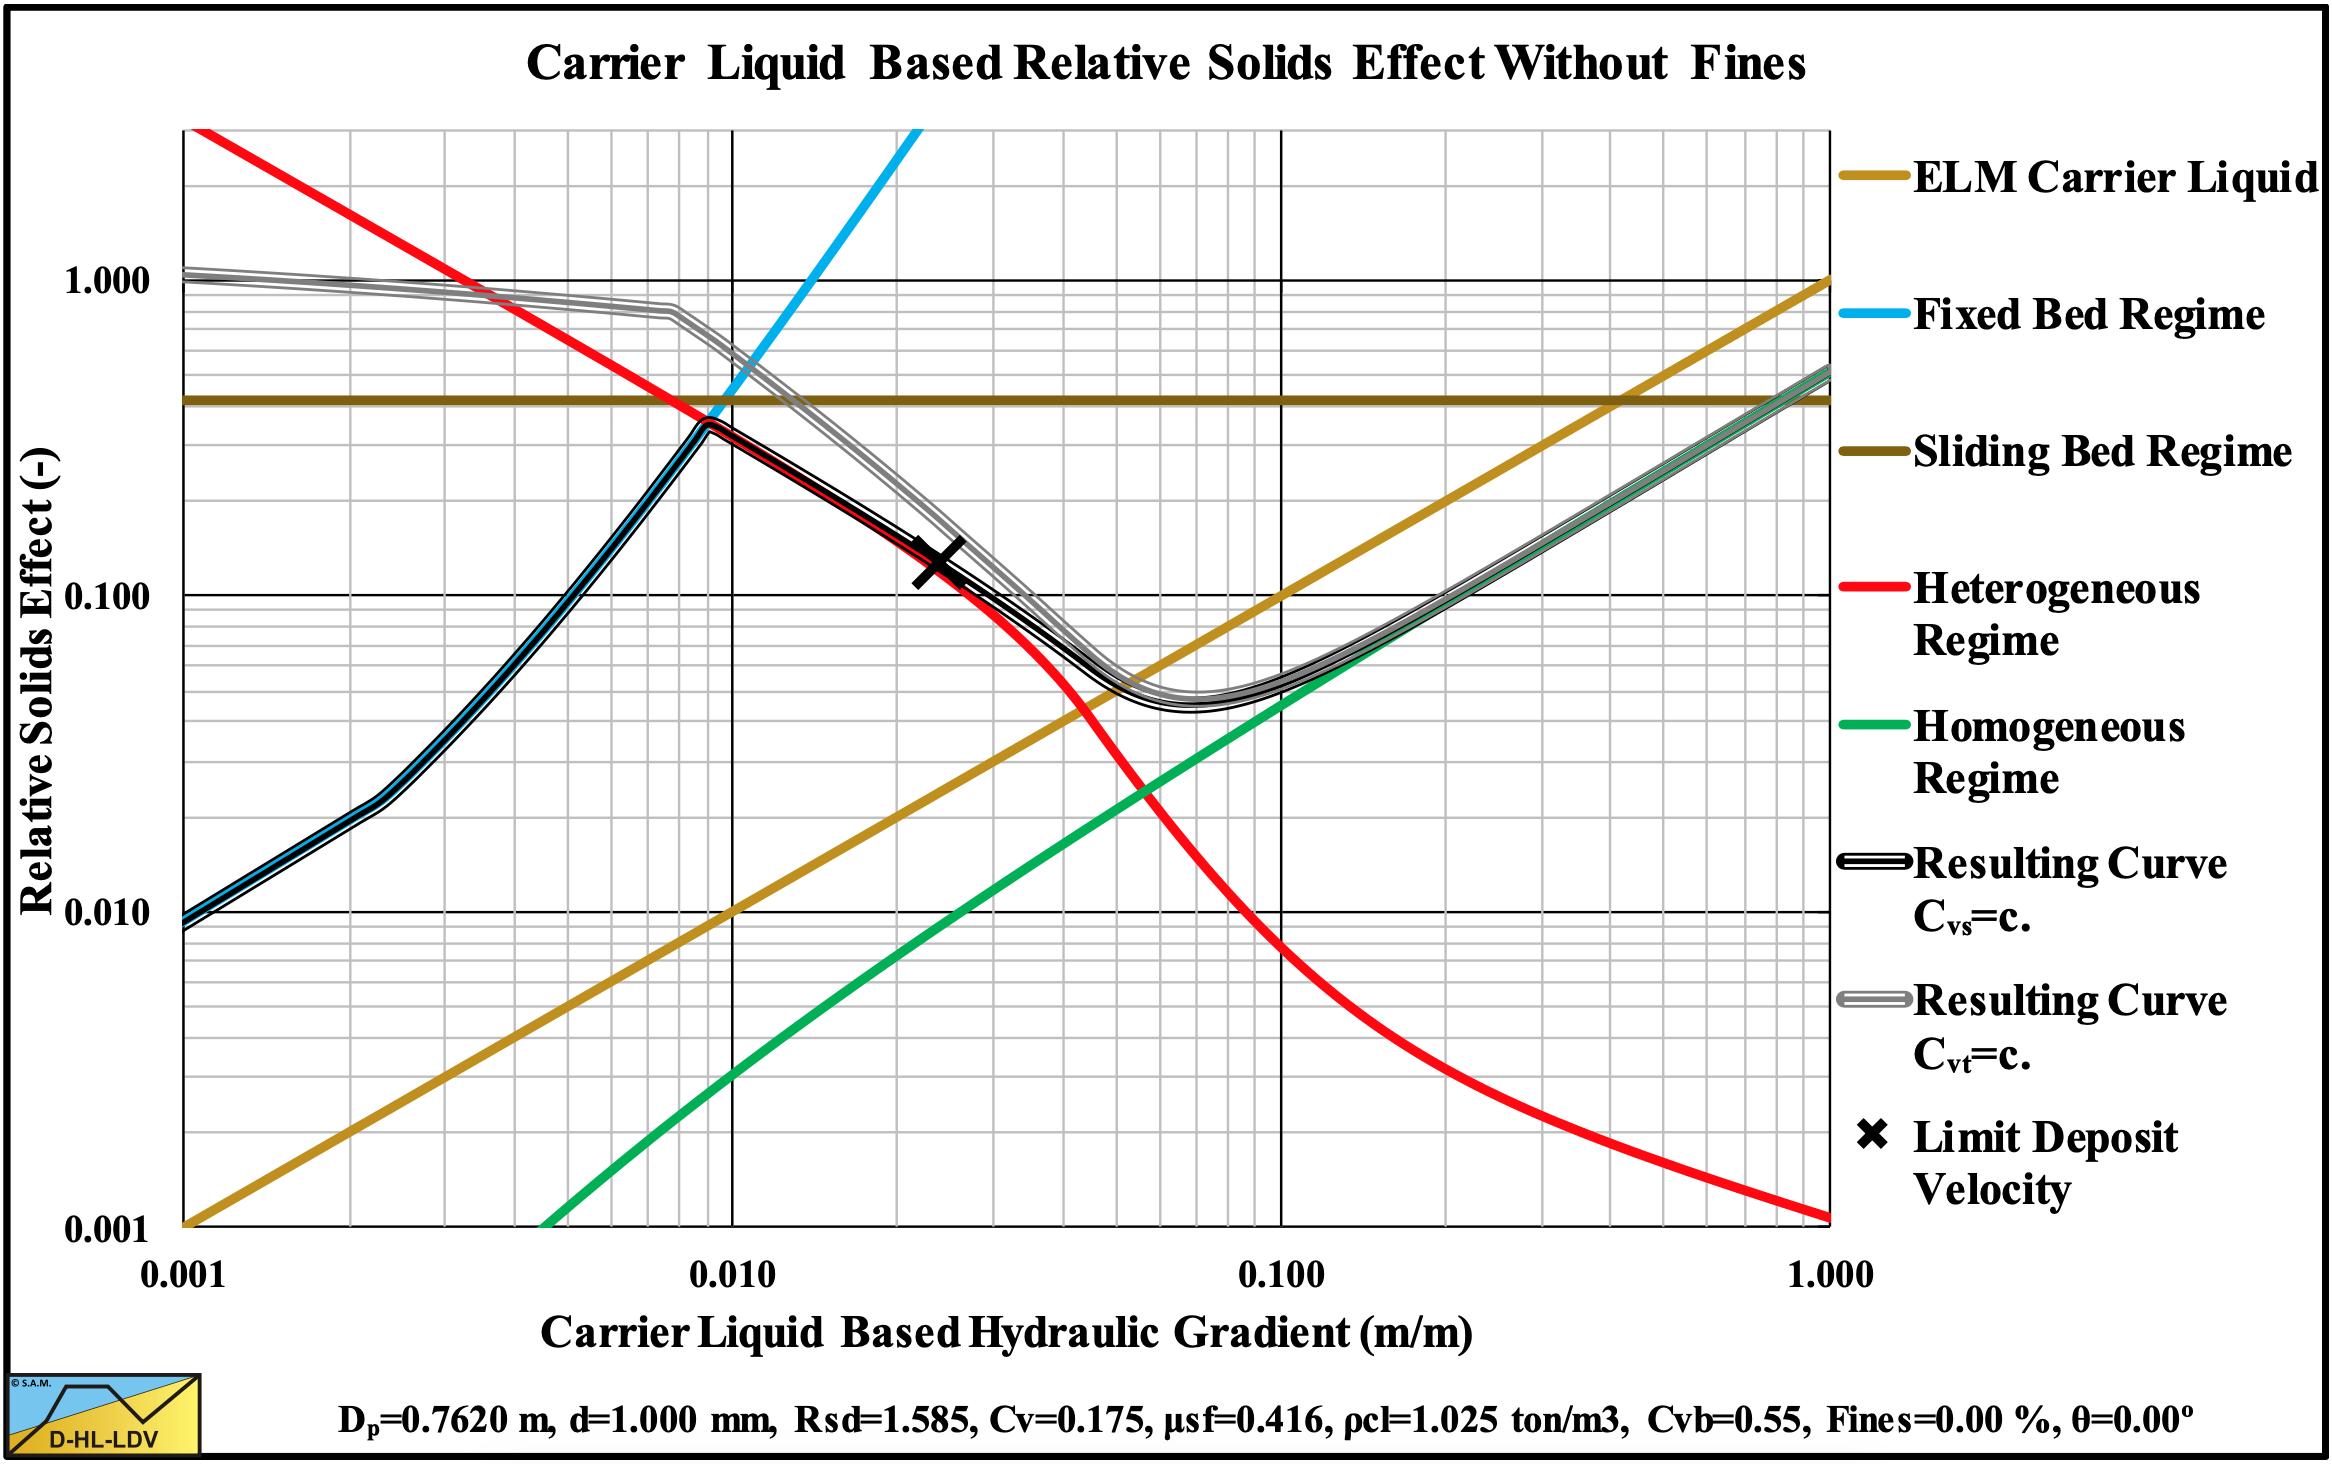
Figure 13.5-2: The relative excess hydraulic gradient versus the liquid hydraulic gradient.
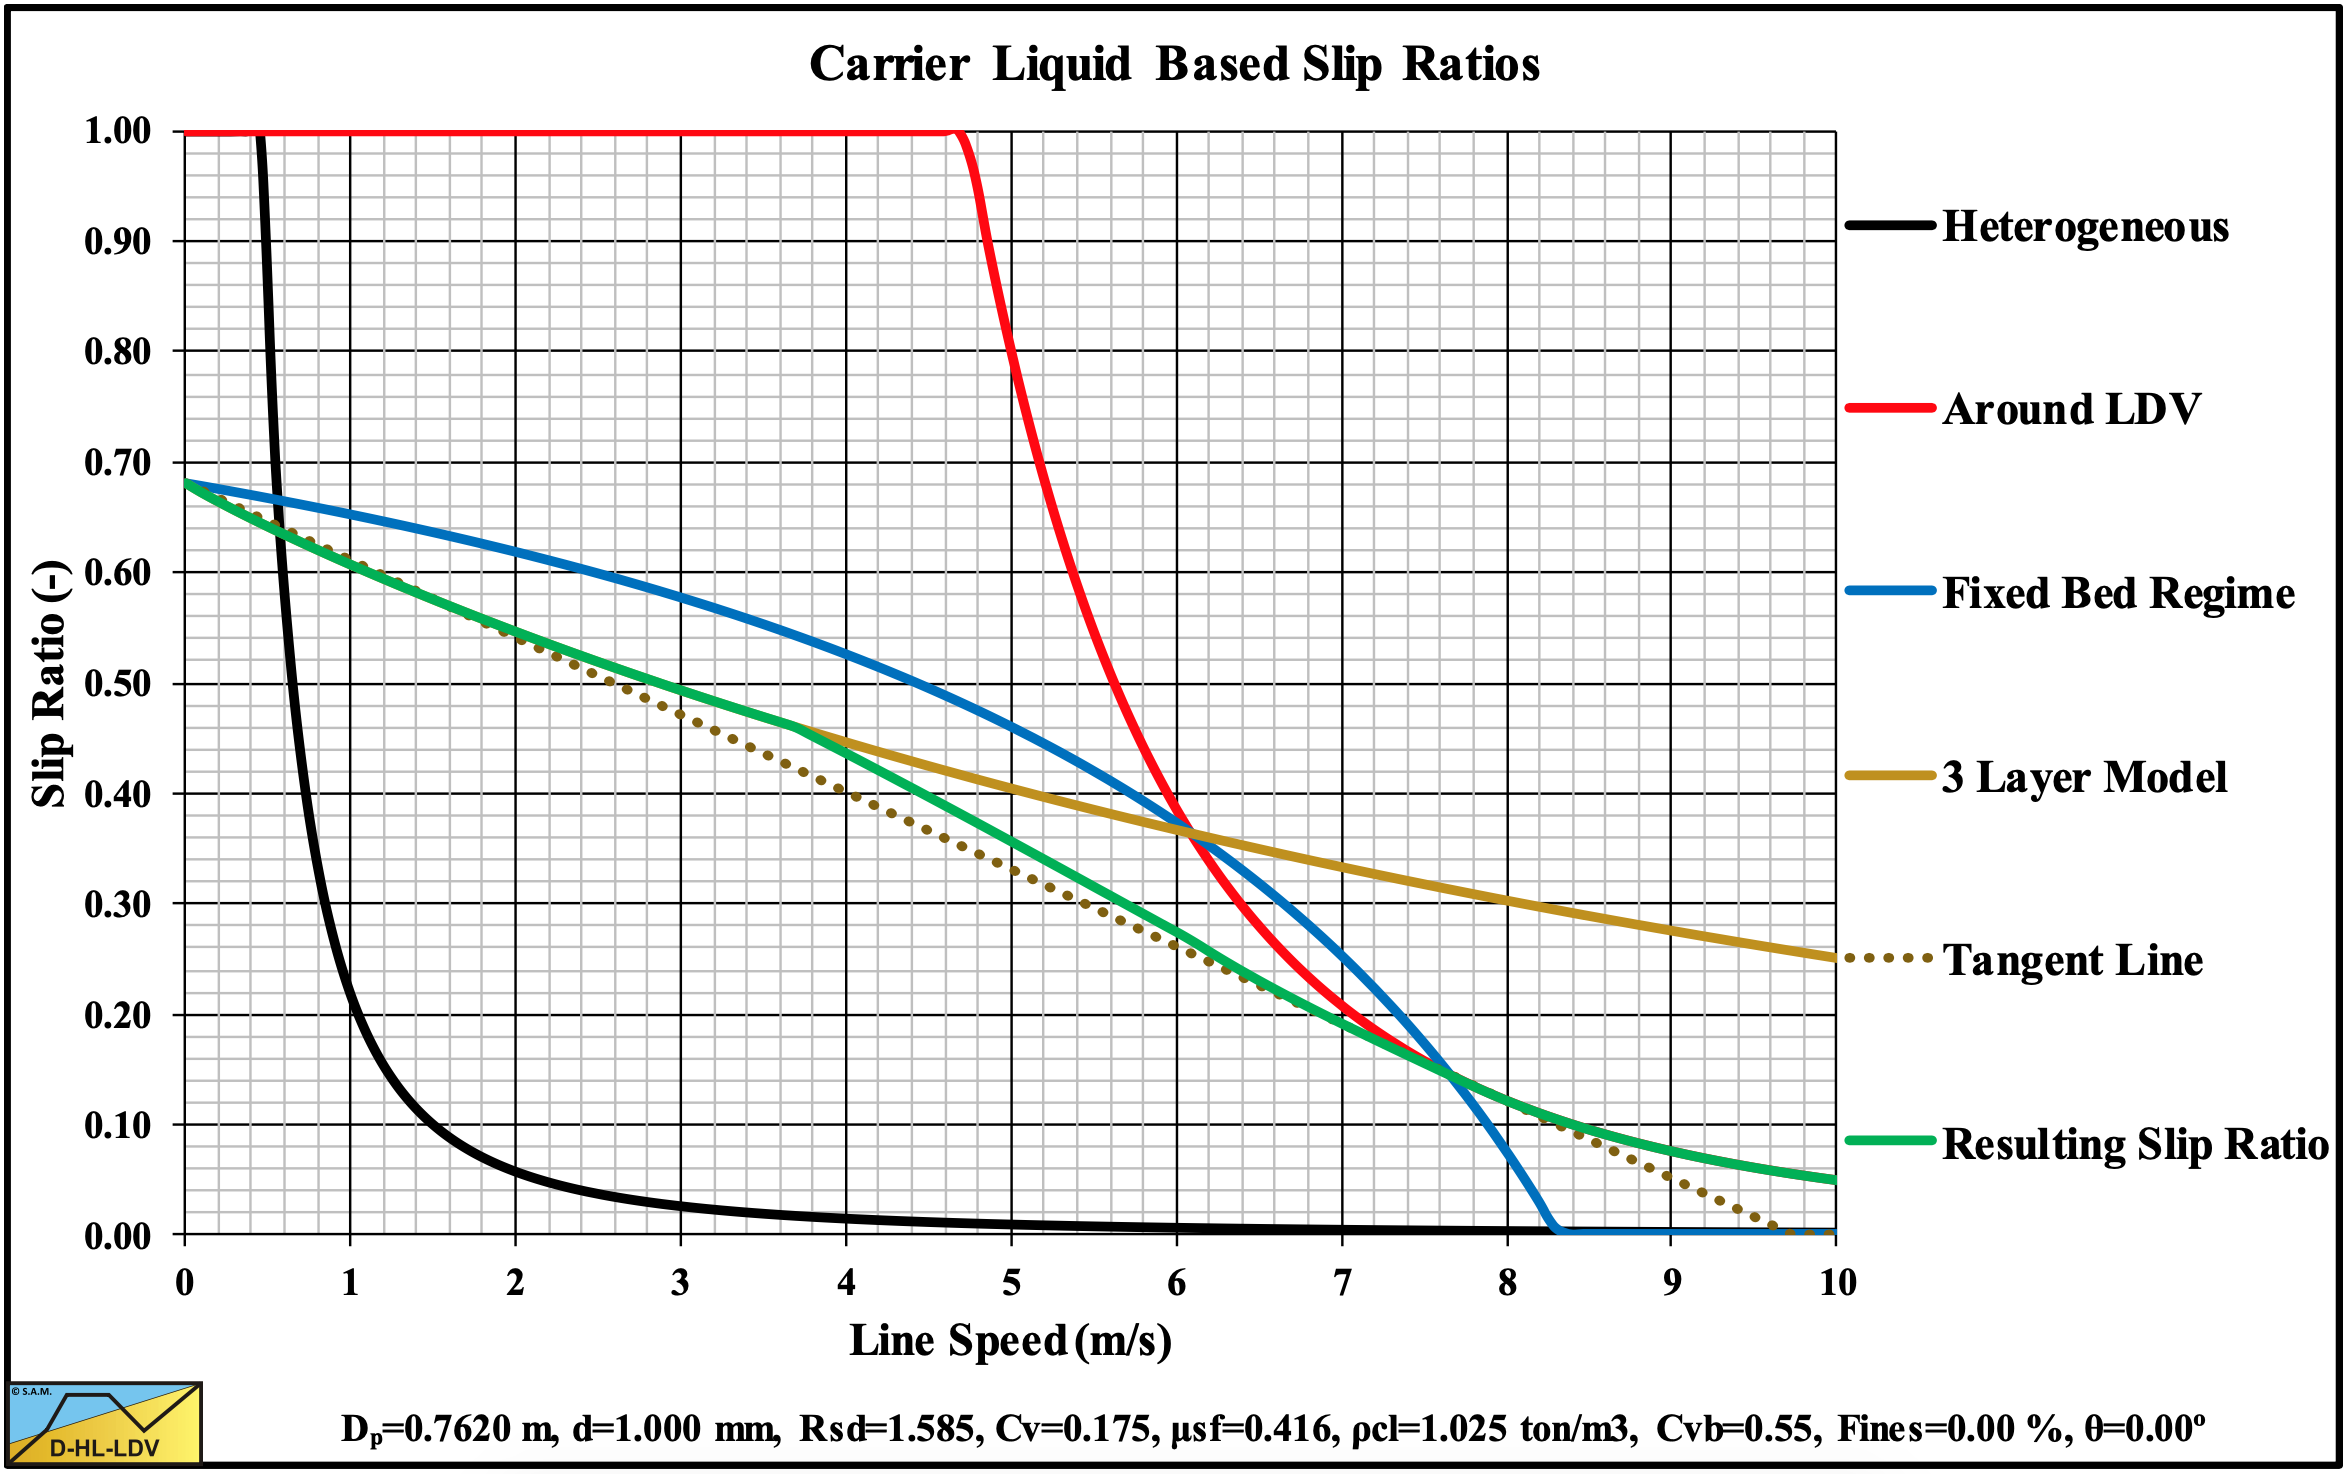
Figure 13.5-3: The slip ratio versus the line speed.
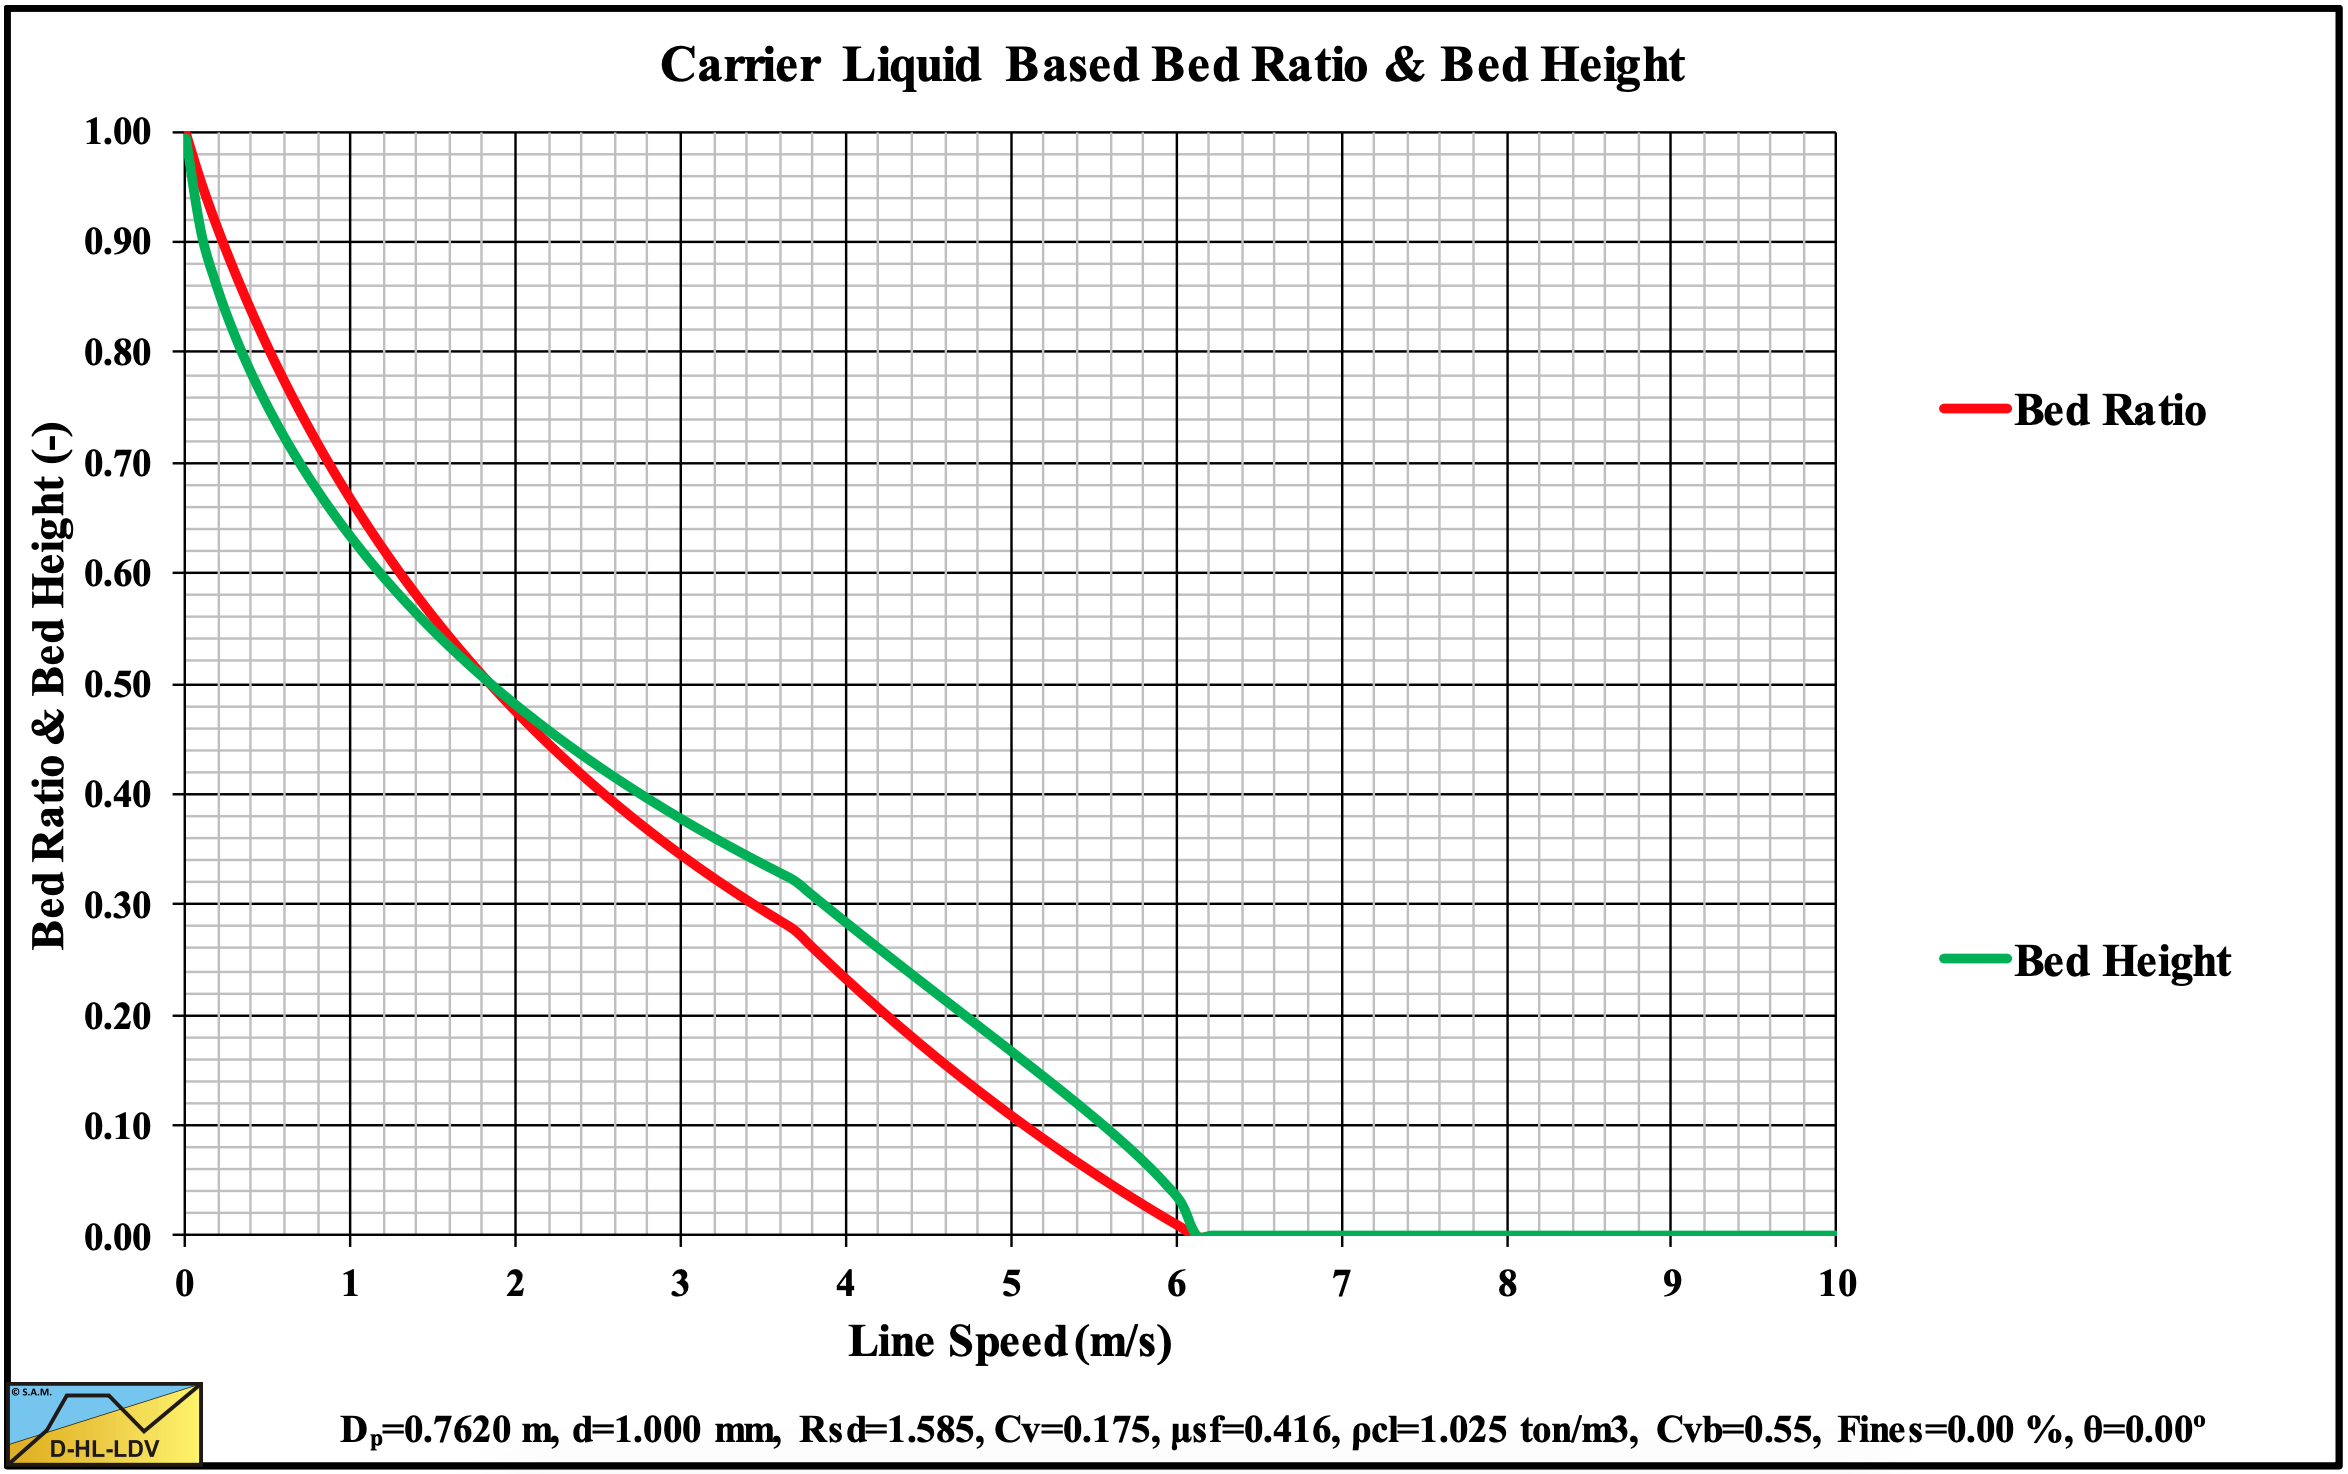
Figure 13.5-4: The bed fraction and bed height versus the line speed.
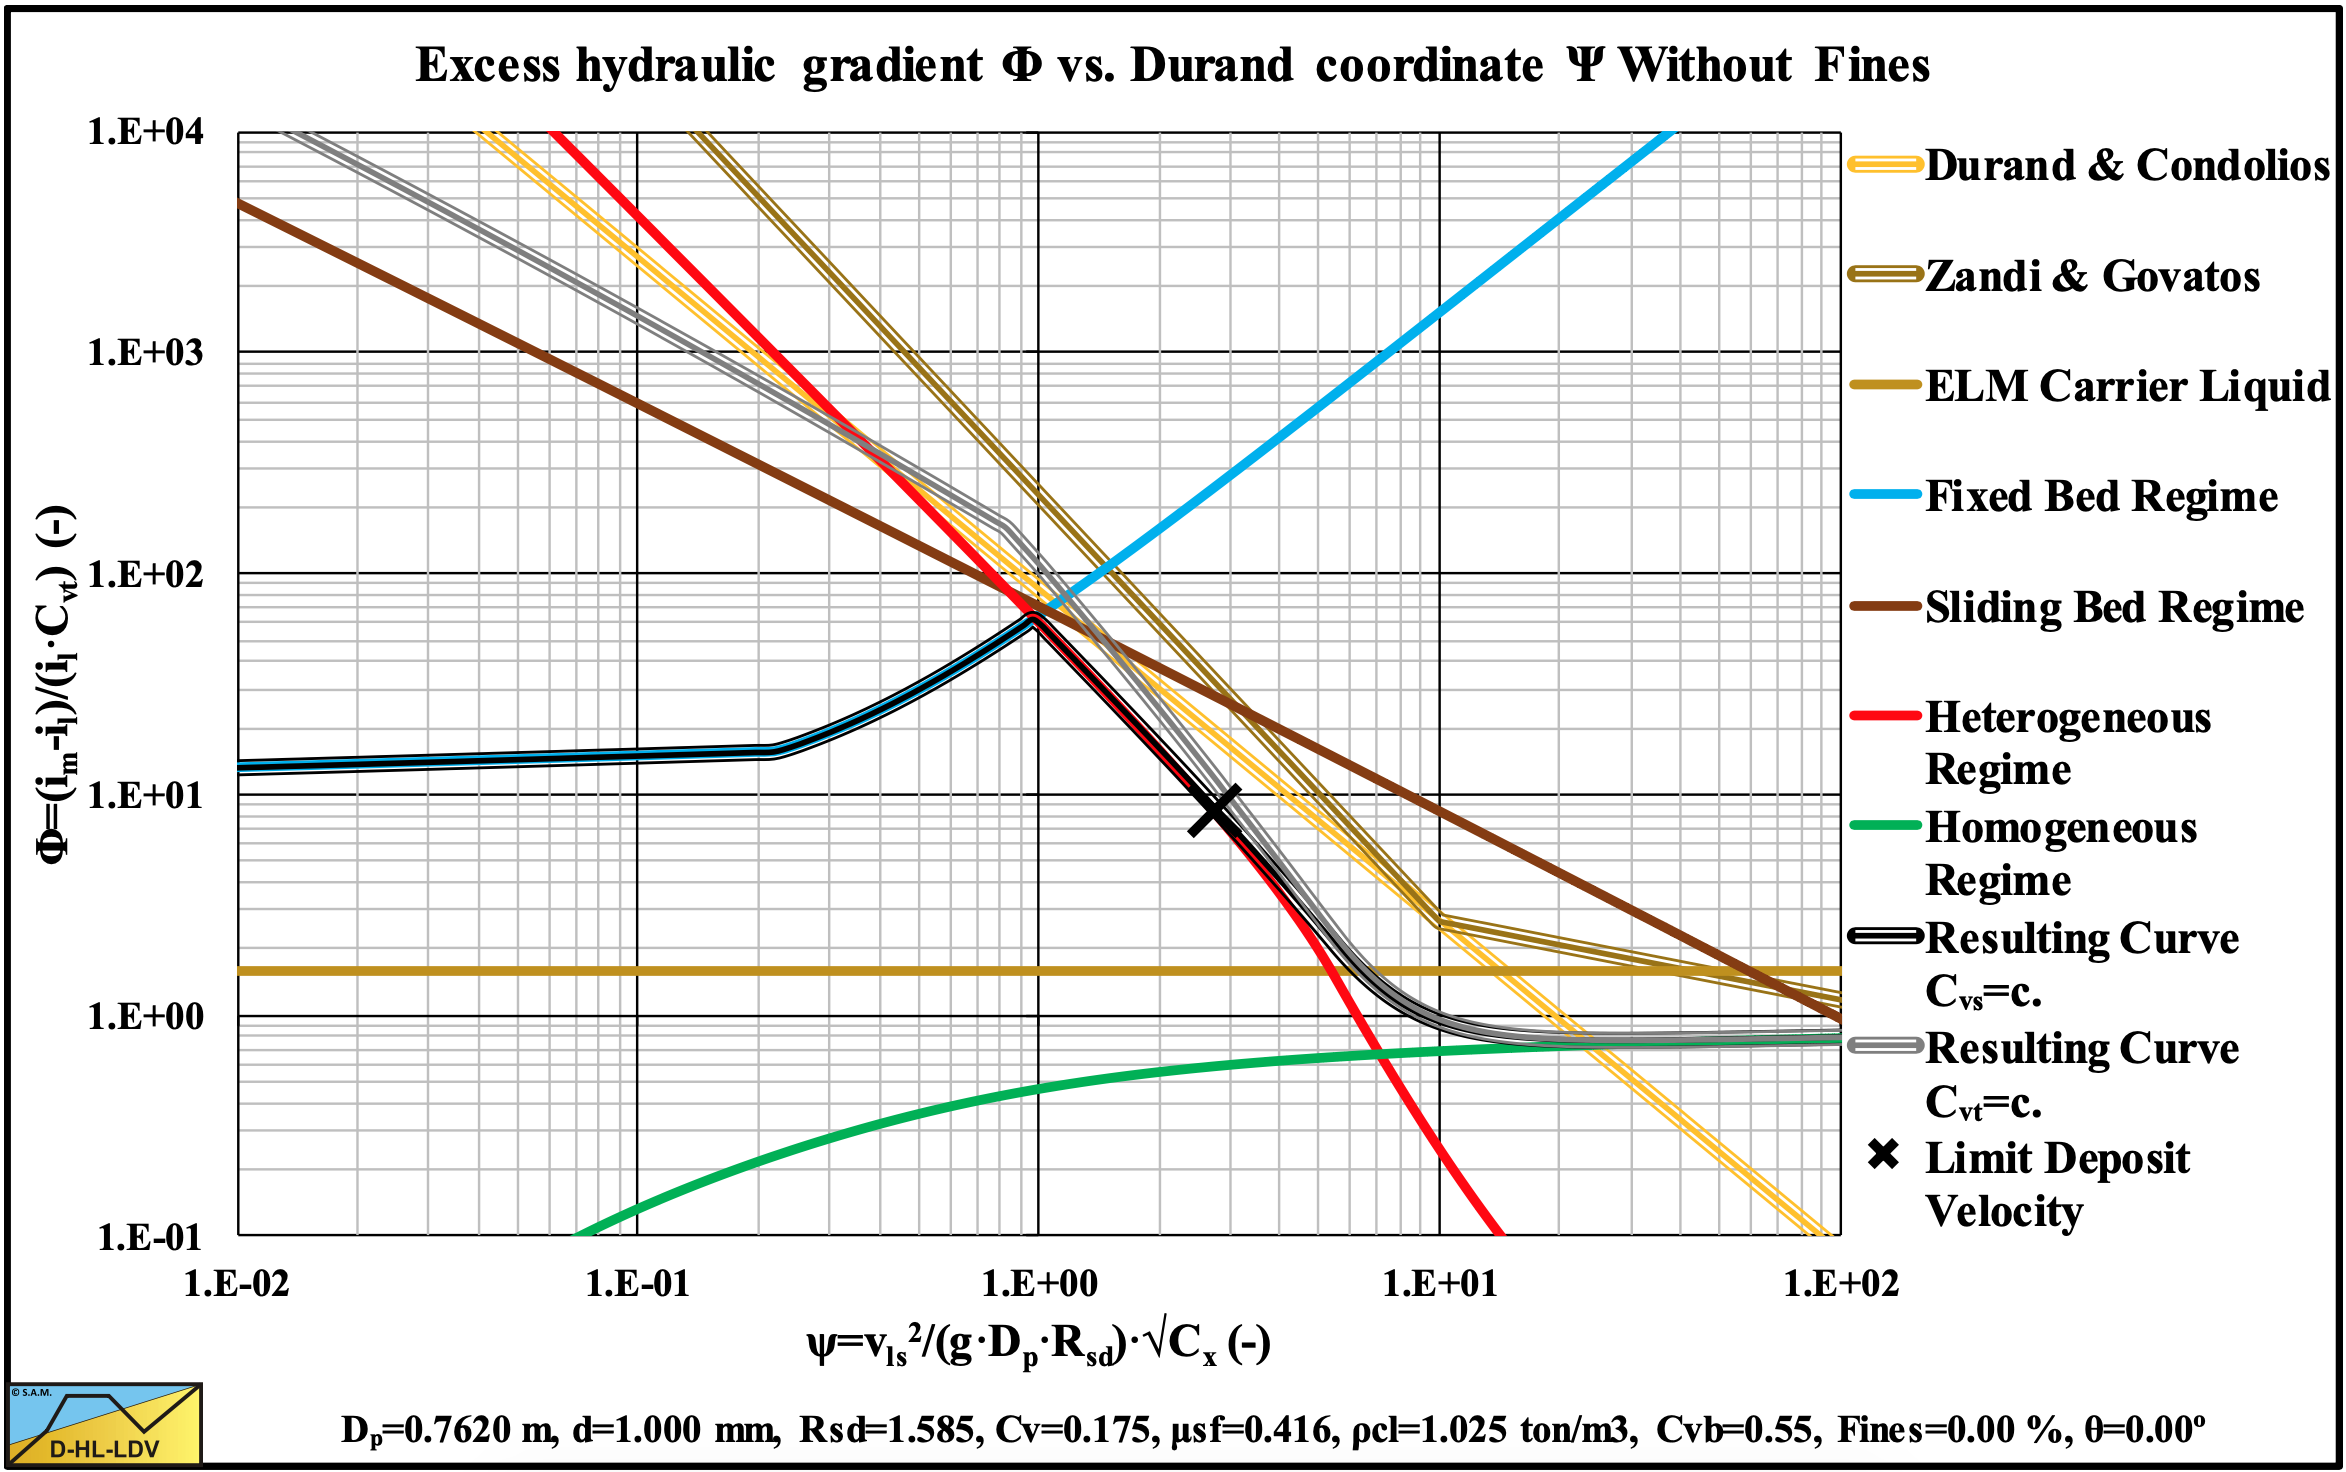
Figure 13.5-5: The hydraulic gradient on Durand coordinates.
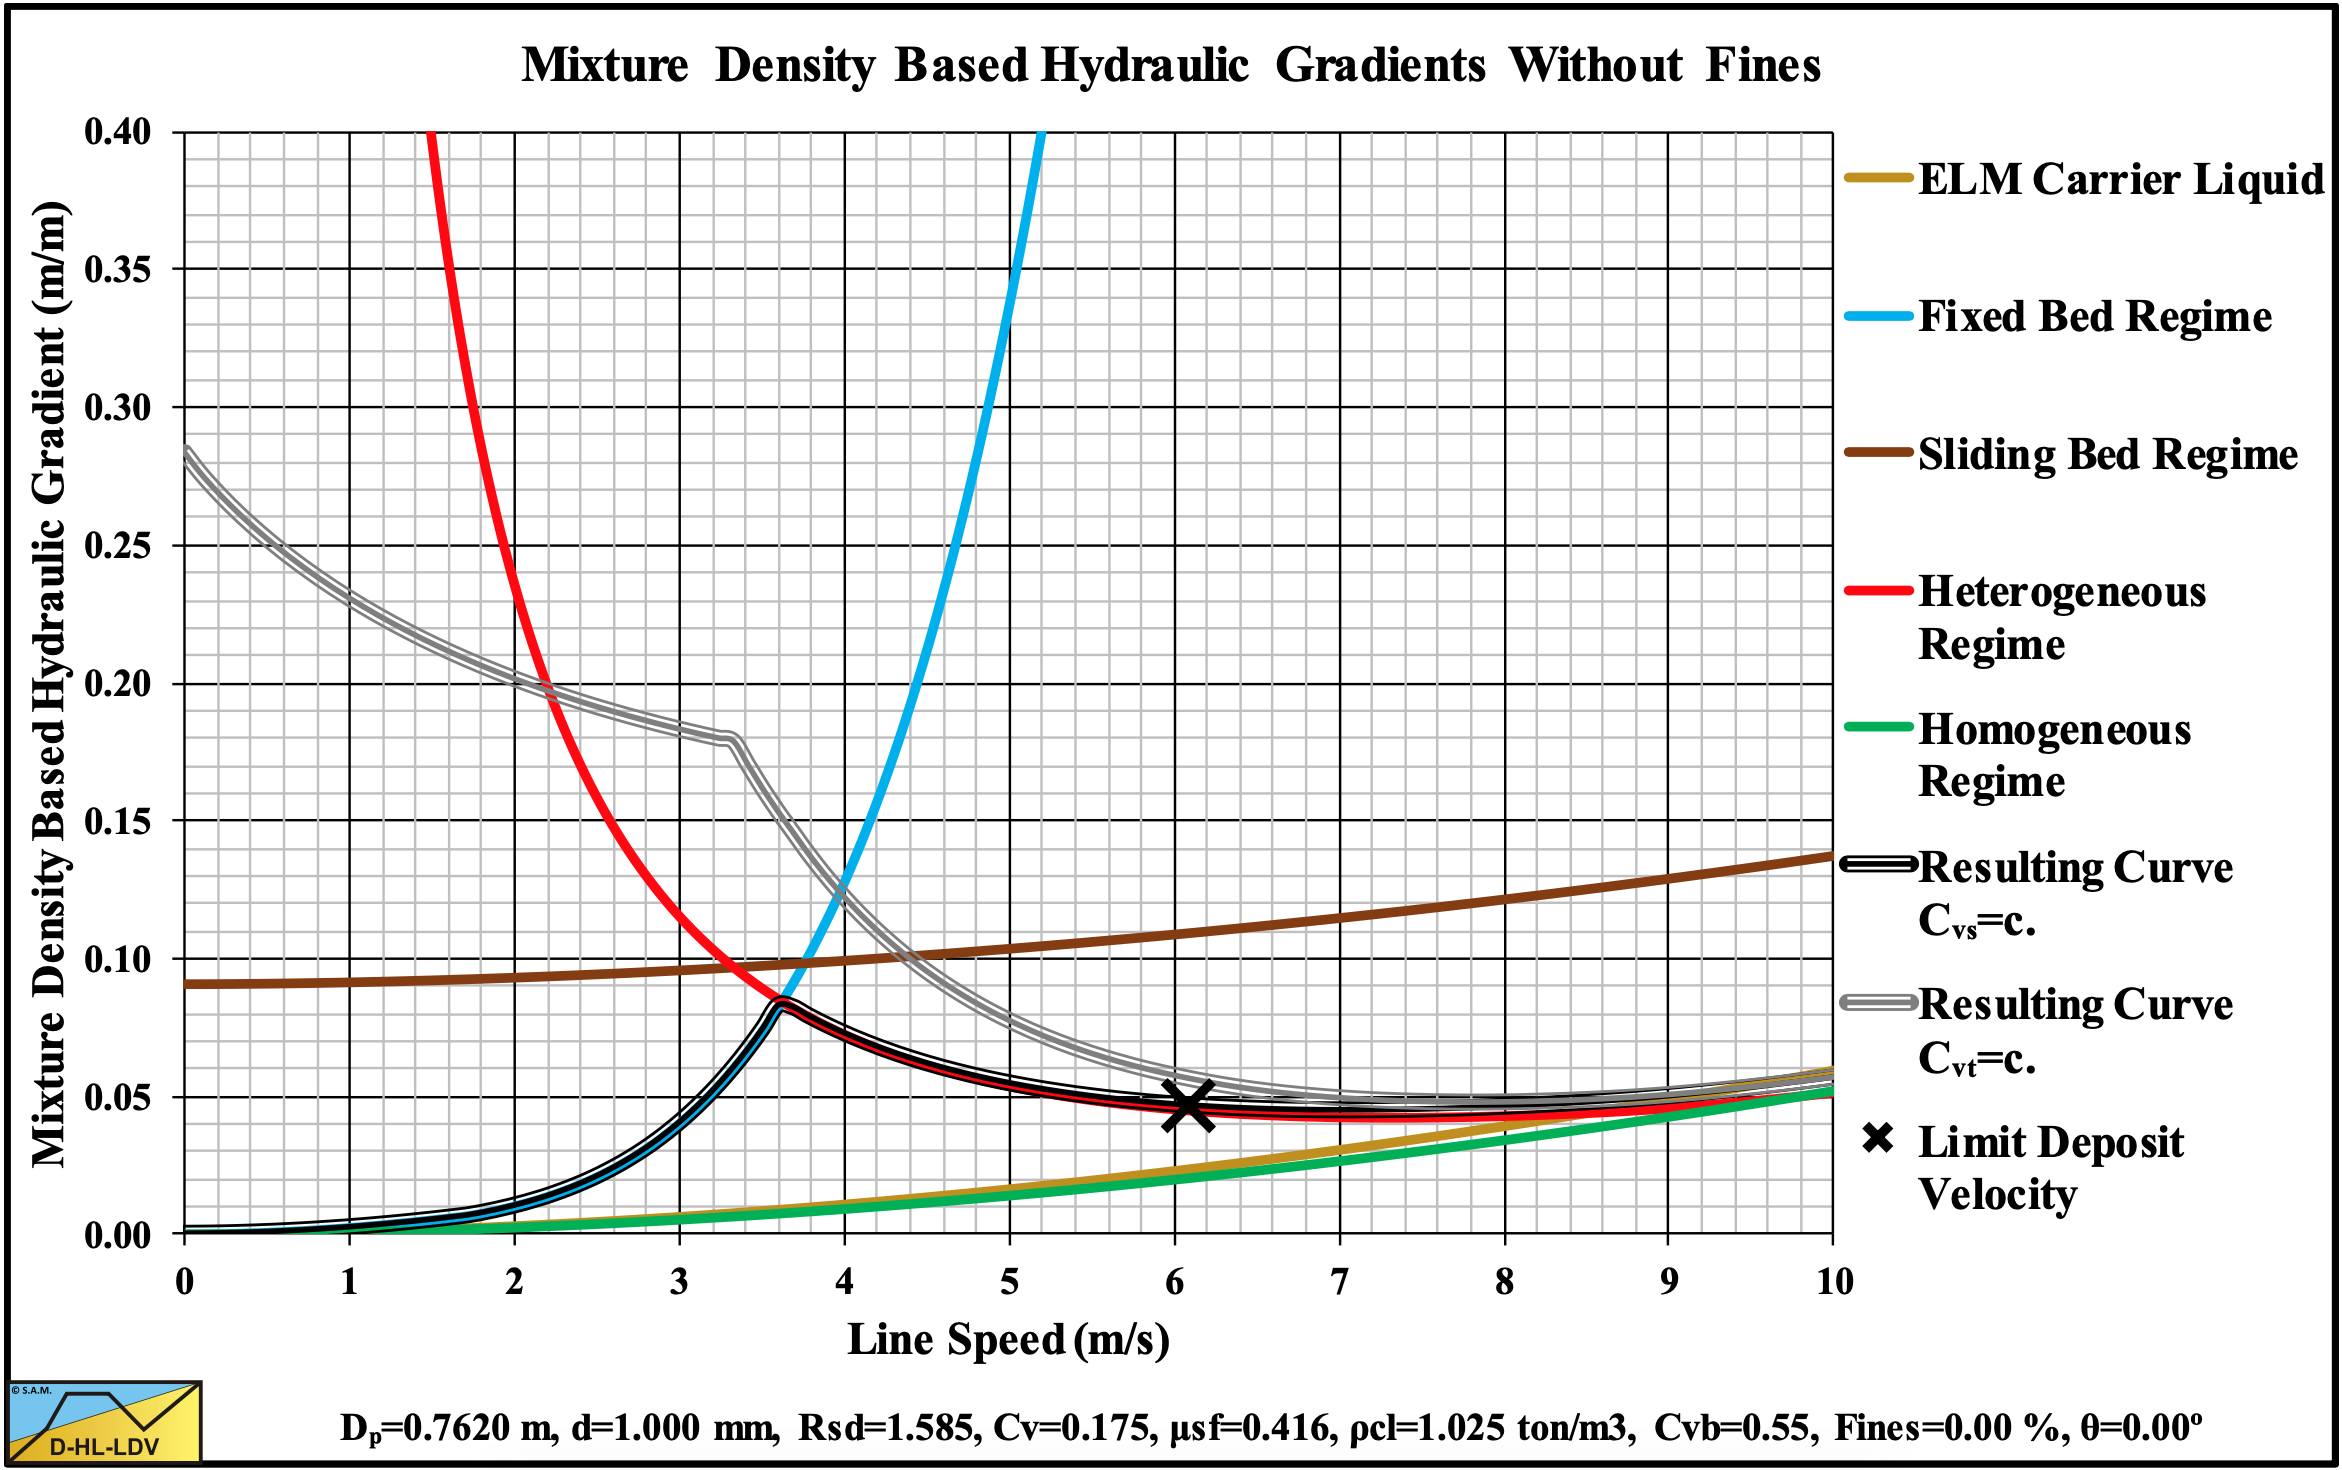
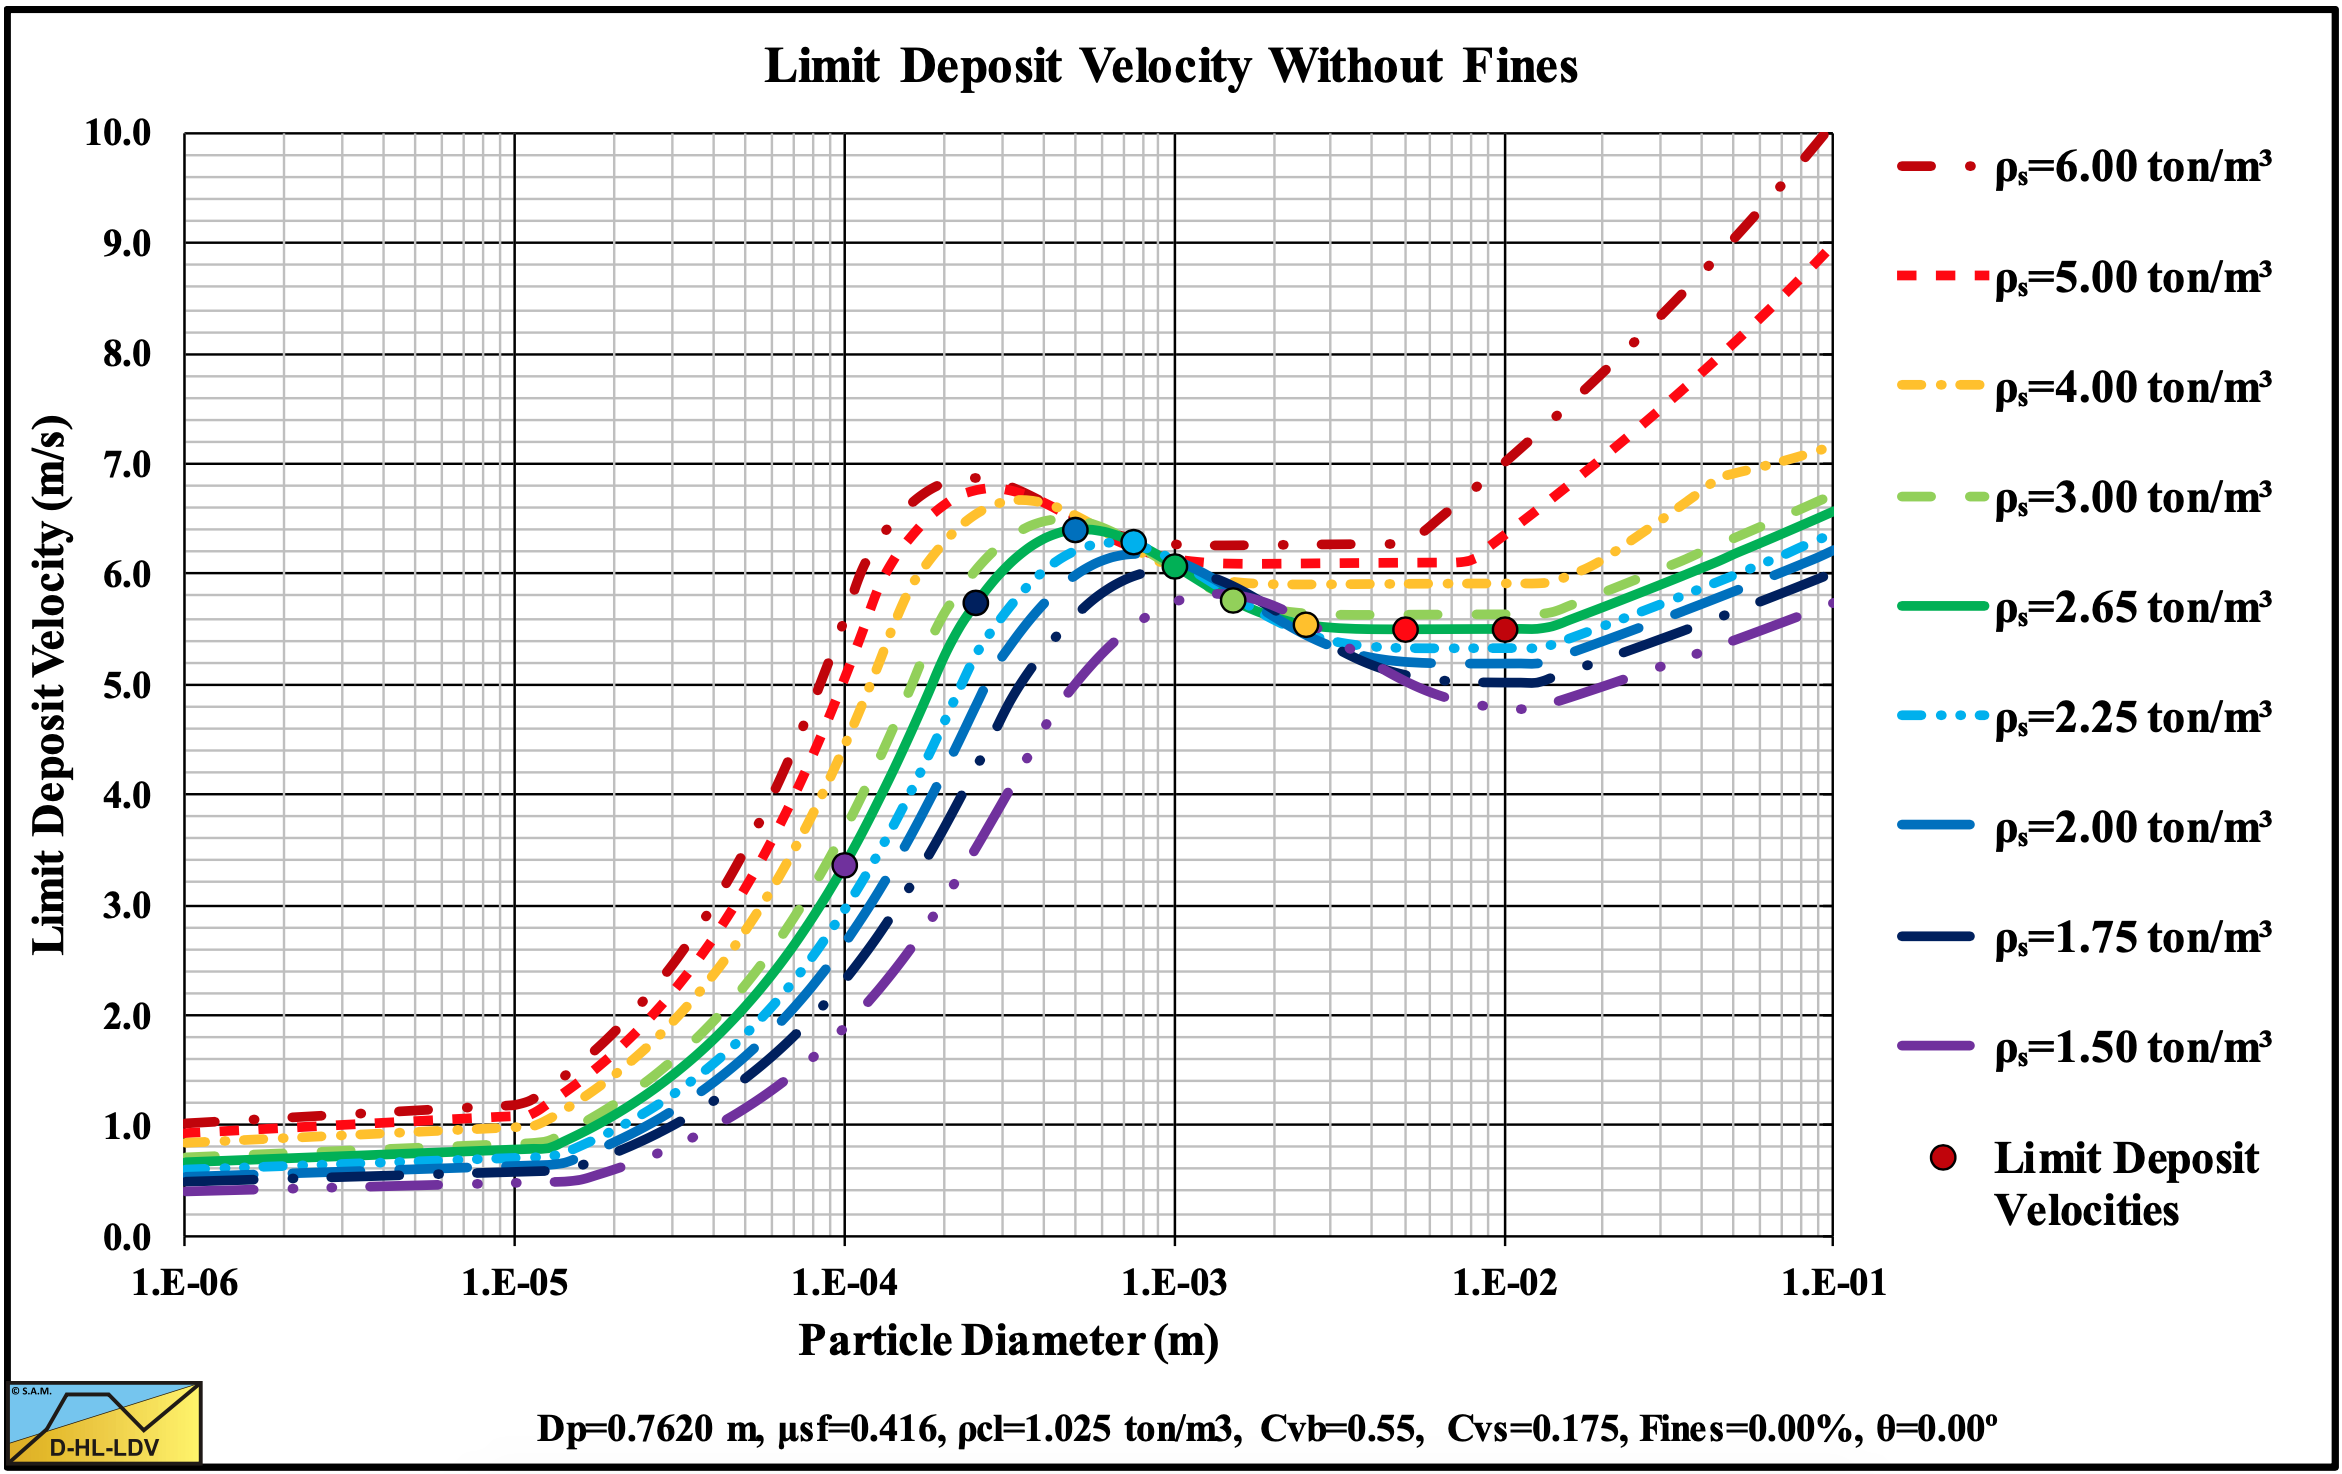
Figure 13.5-6: The hydraulic gradient versus the line speed, mixture density based.
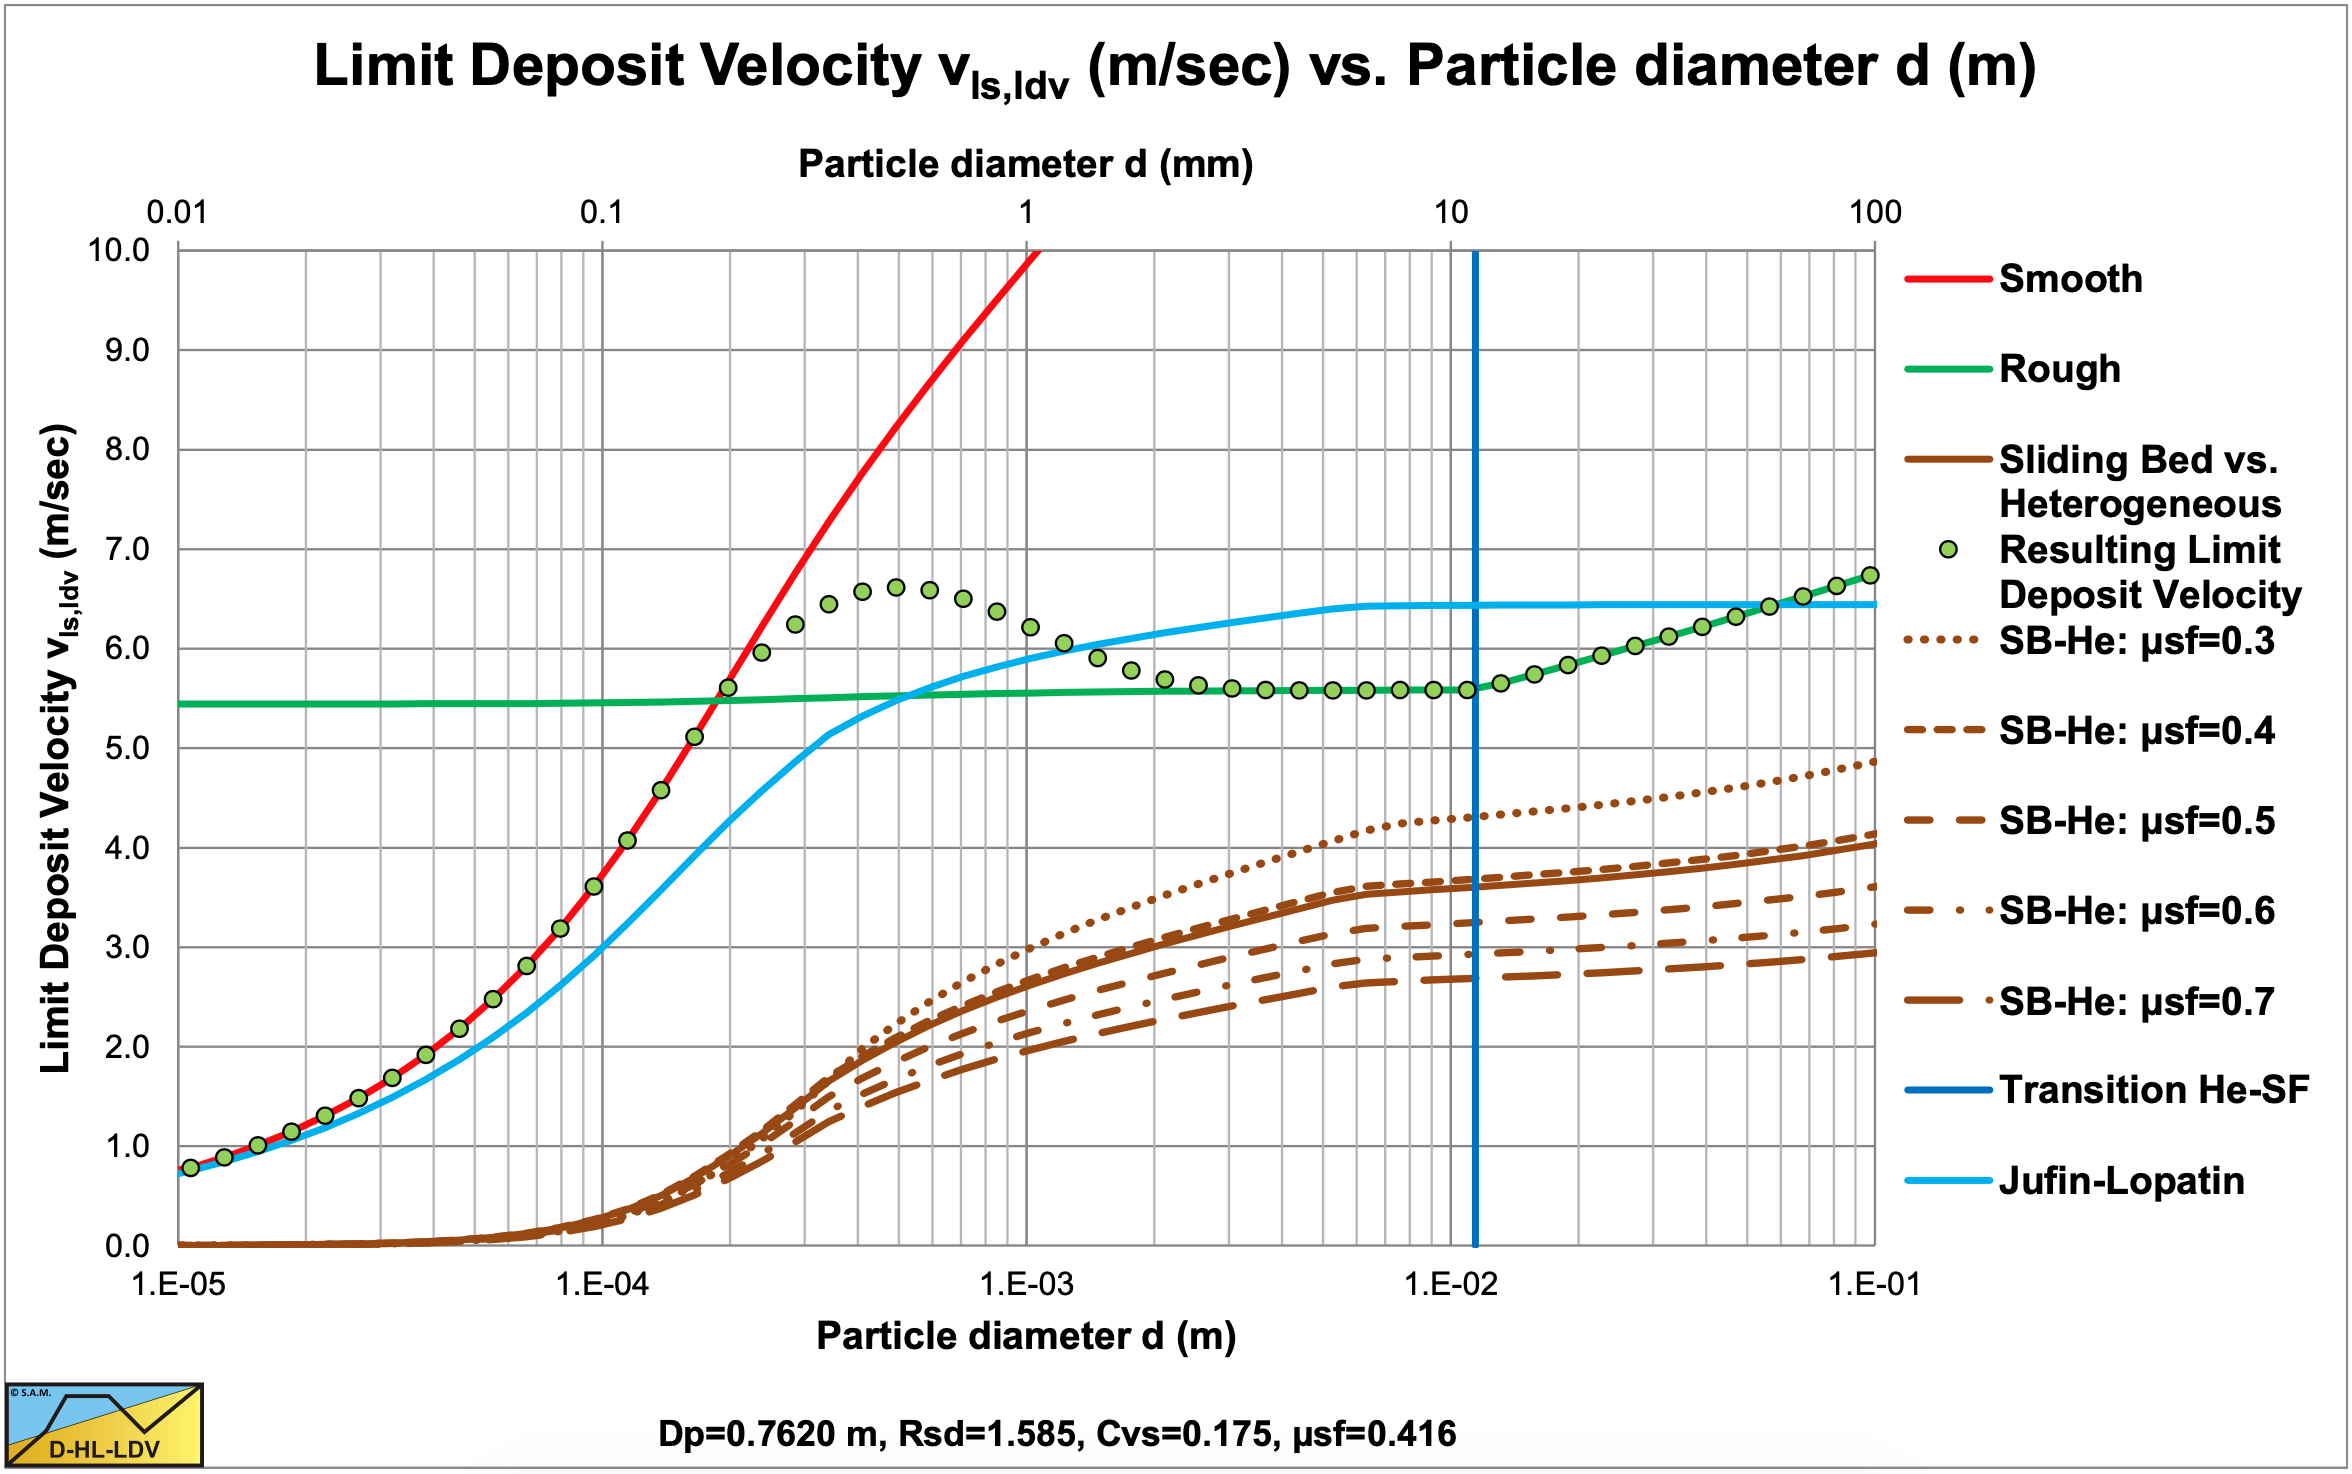
Figure 13.5-7: The Limit Deposit Velocity.
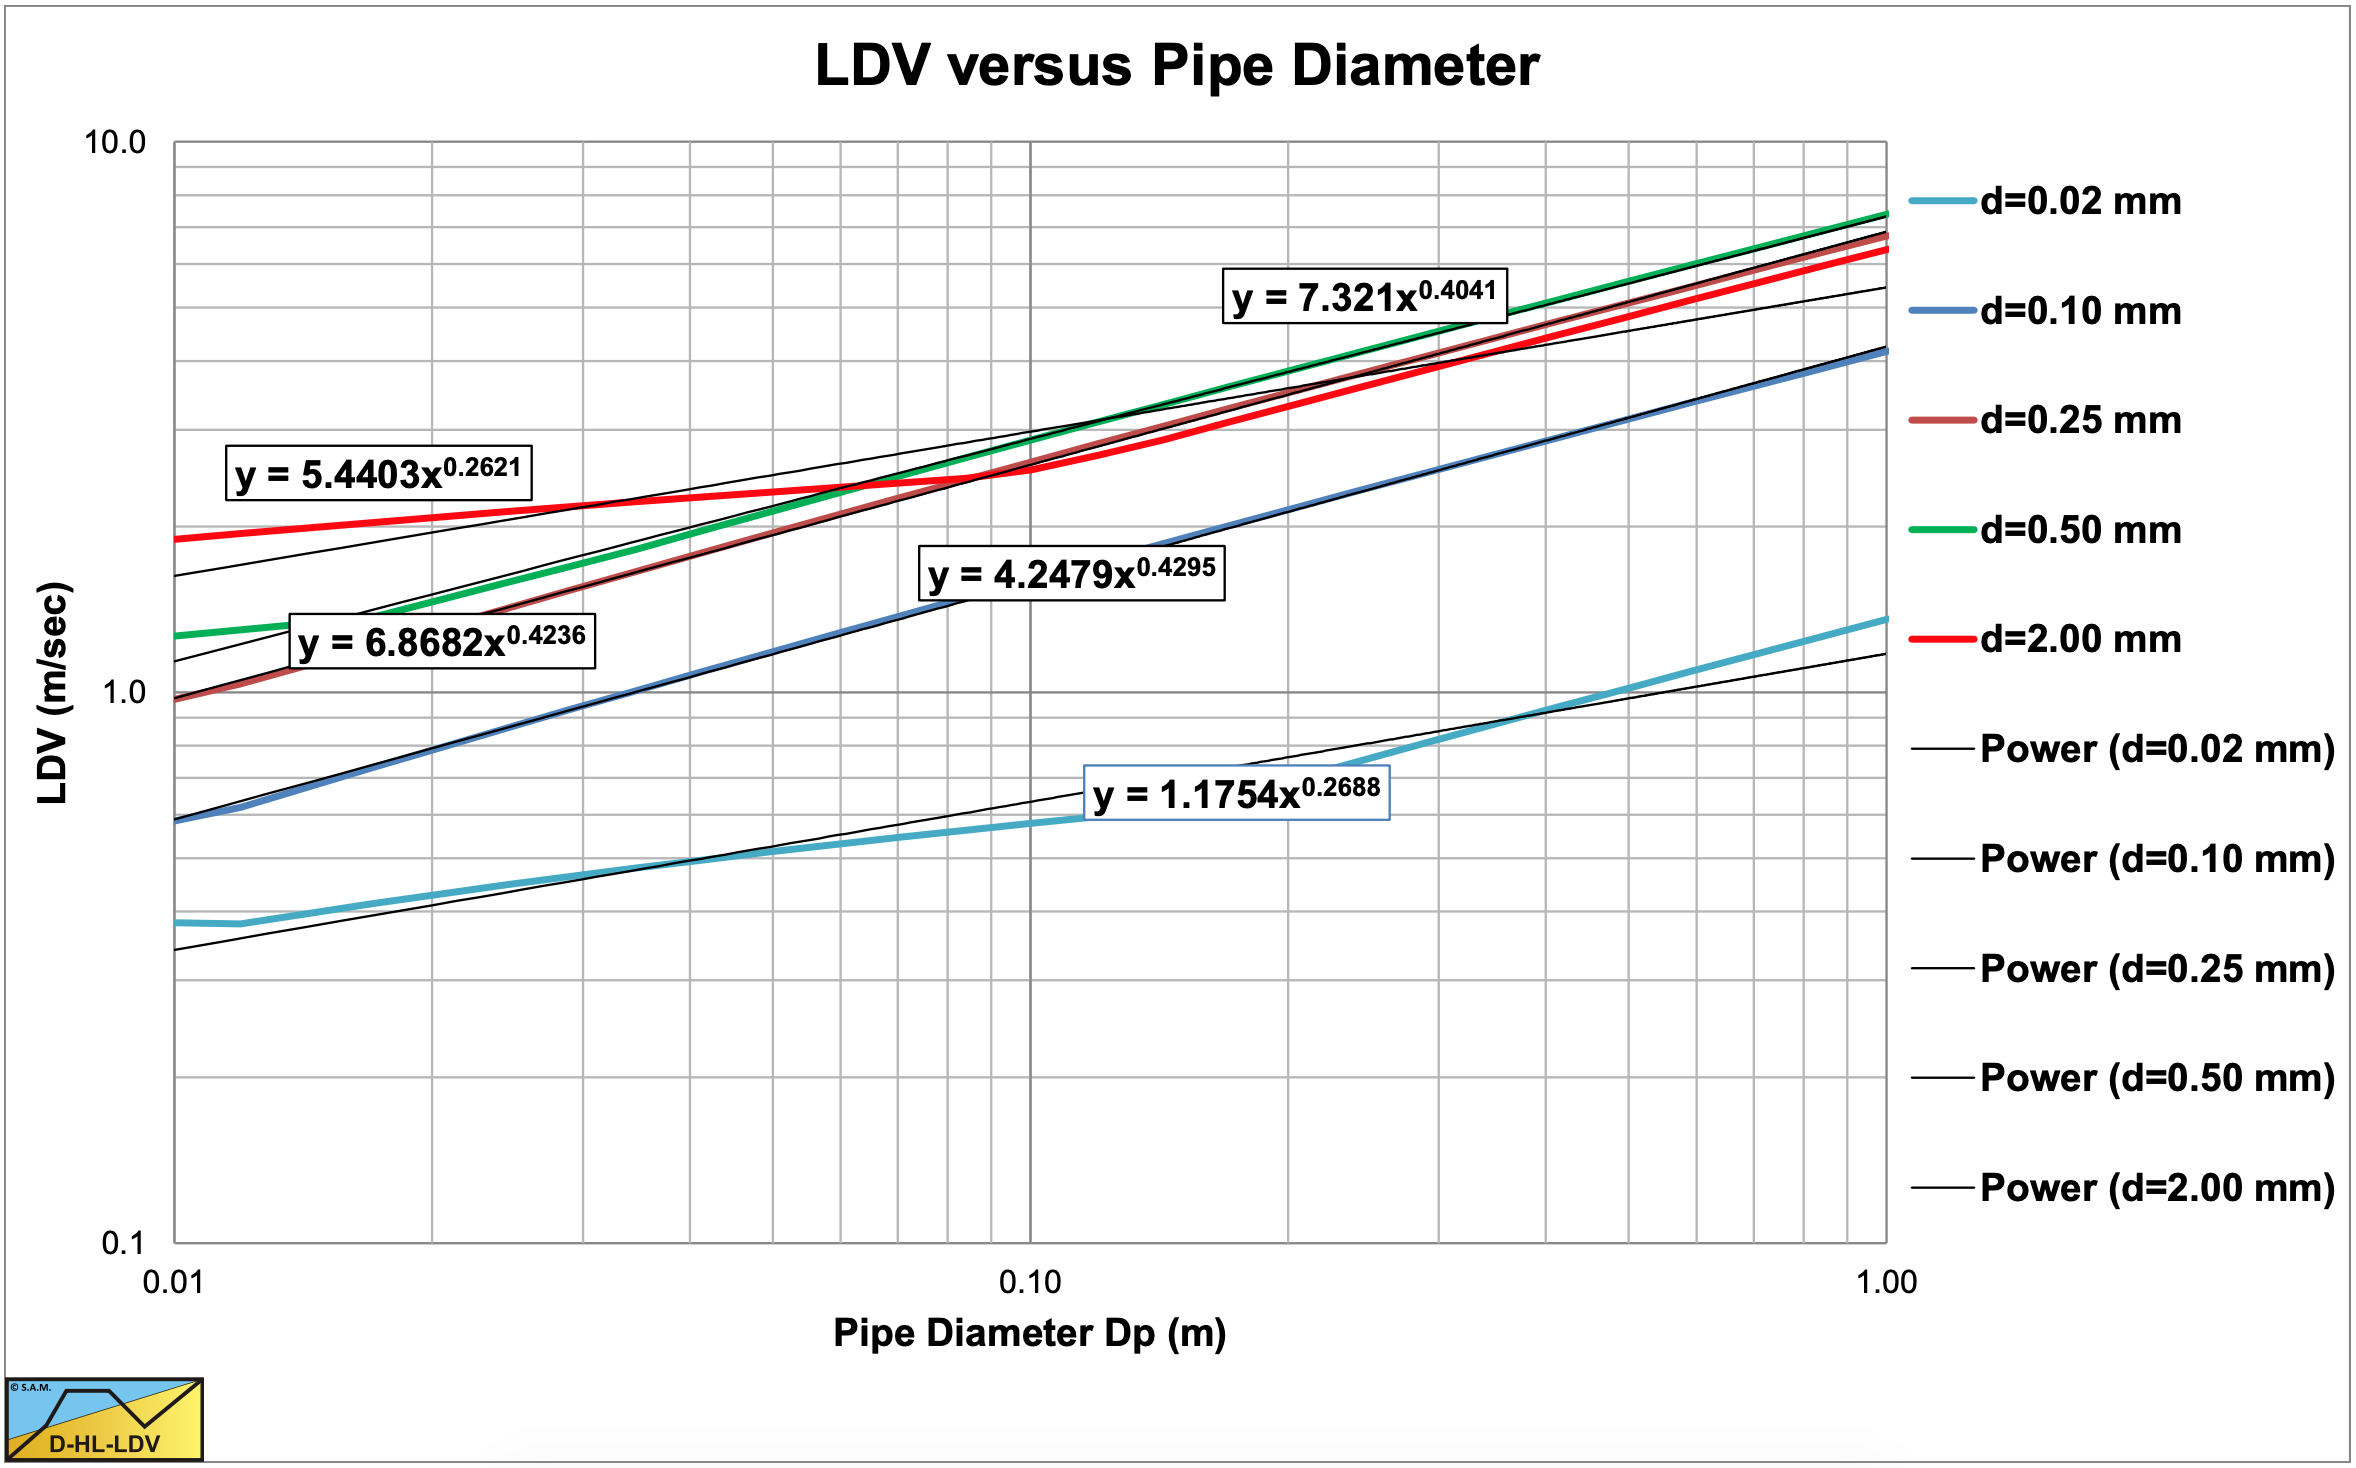
Figure 13.5-8: The Limit Deposit Velocity versus the pipe diameter for 5 sands.
13.5.2 9 Particle Diameters
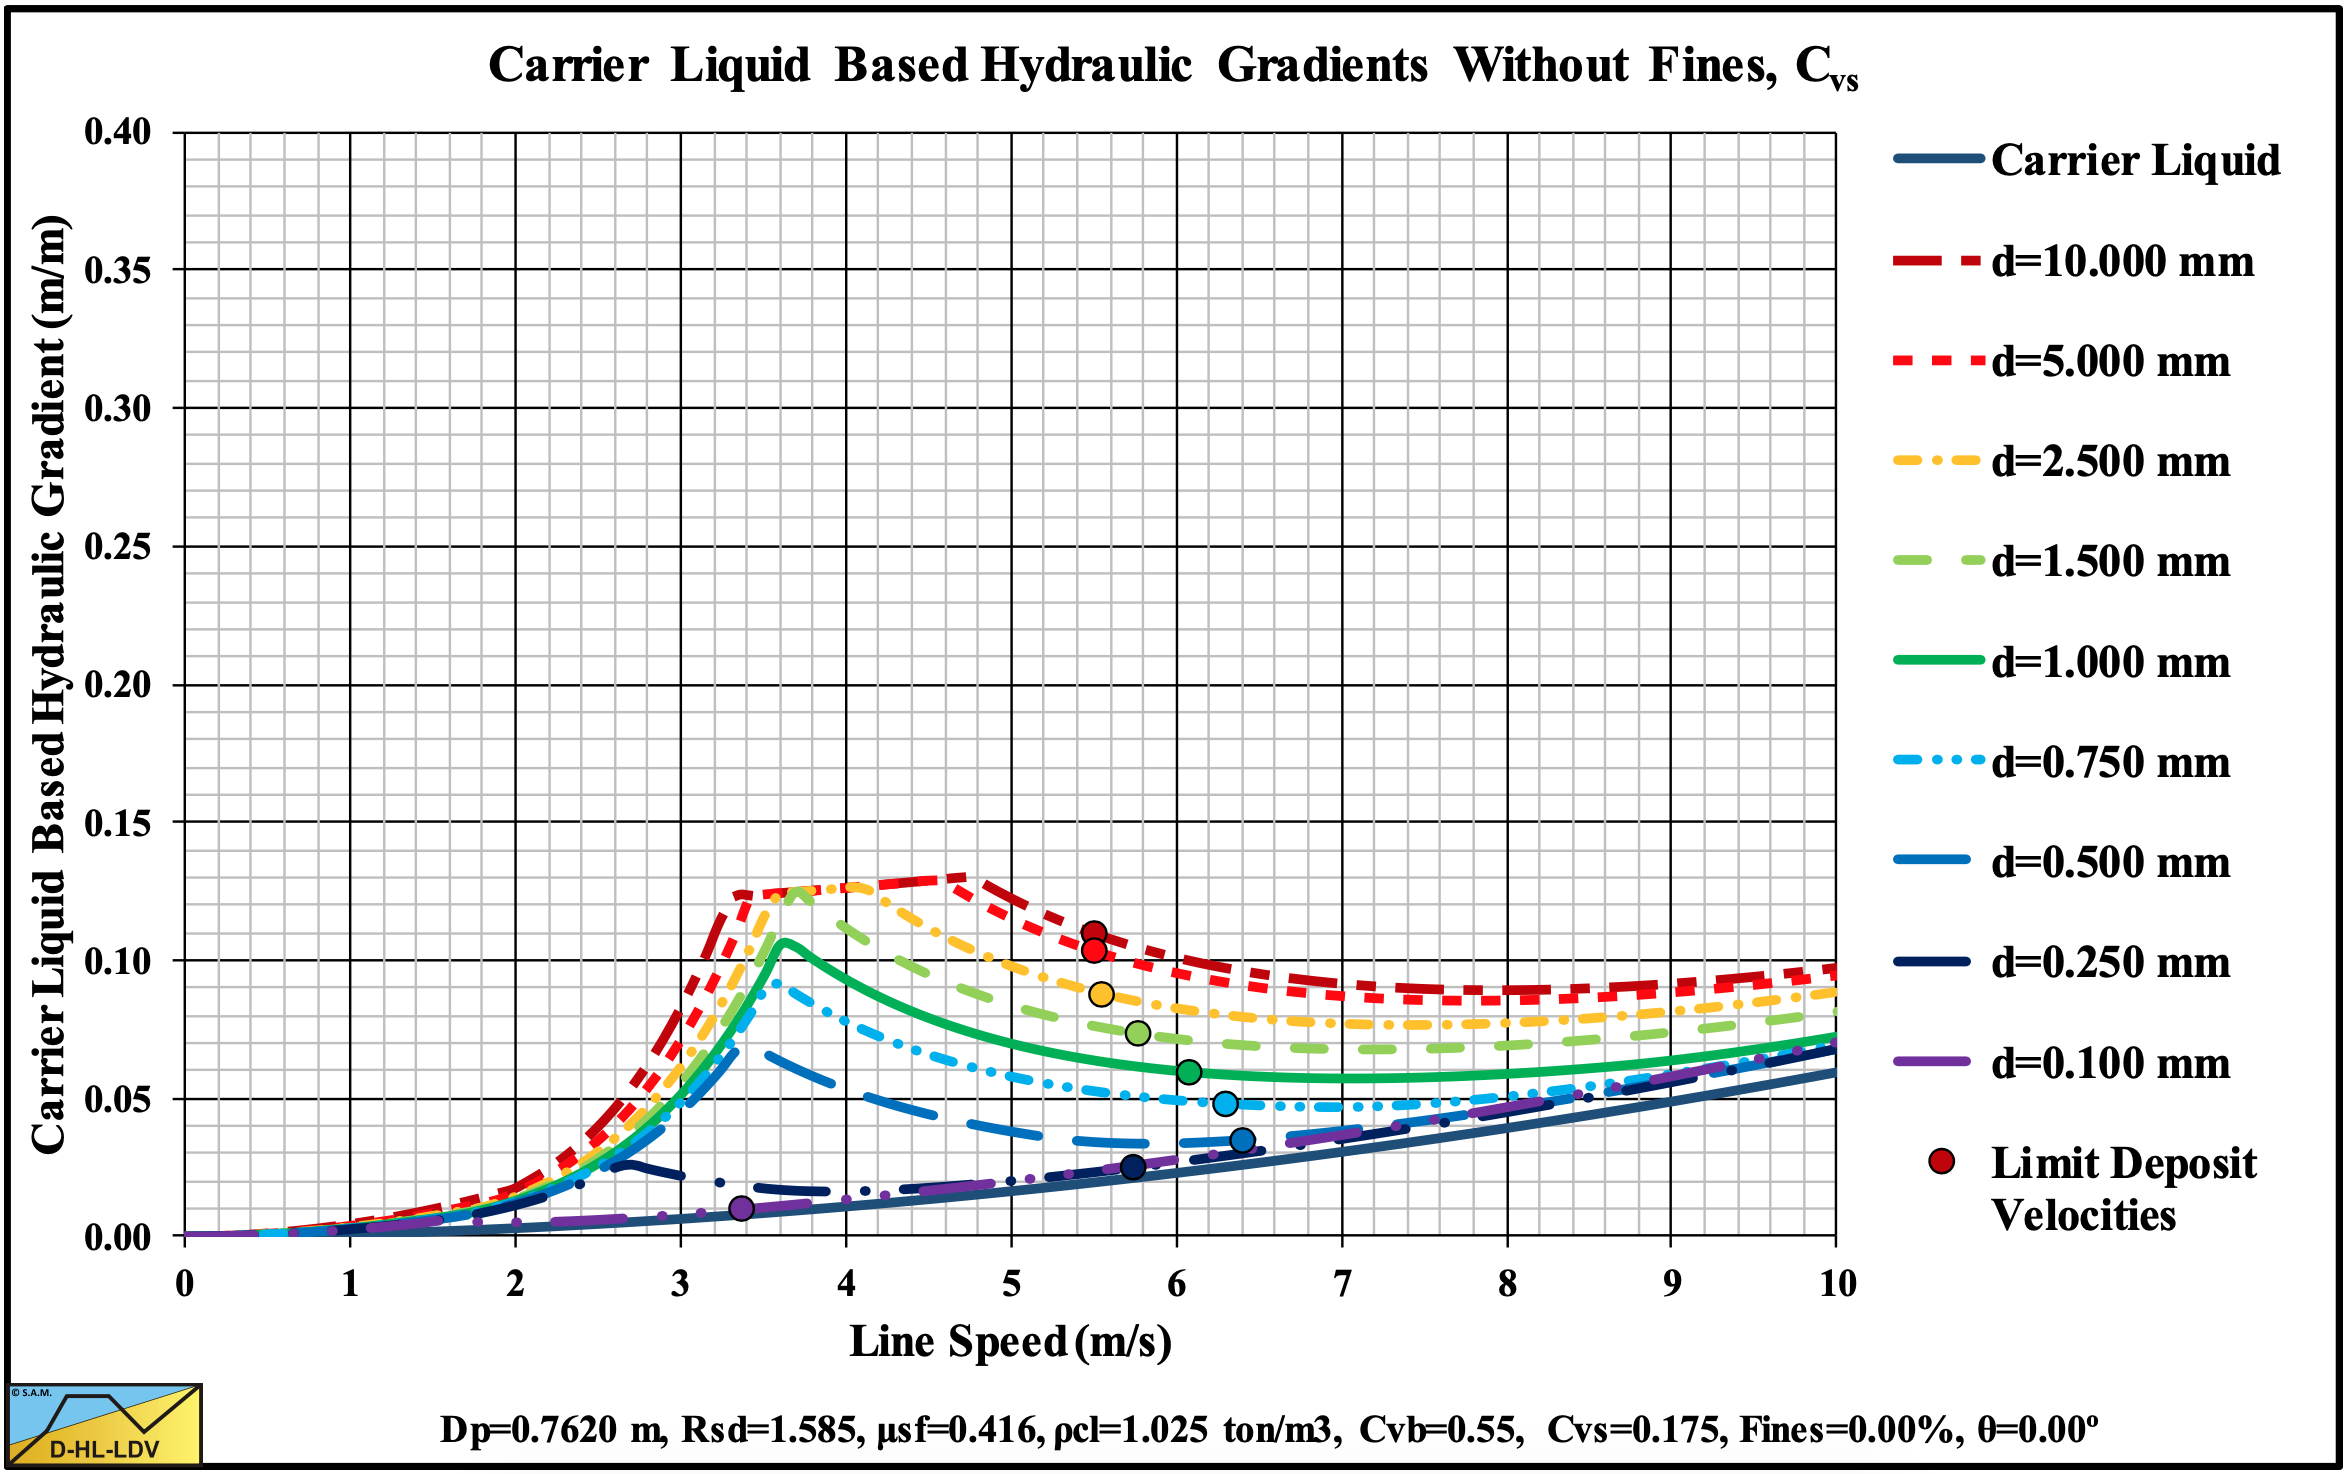
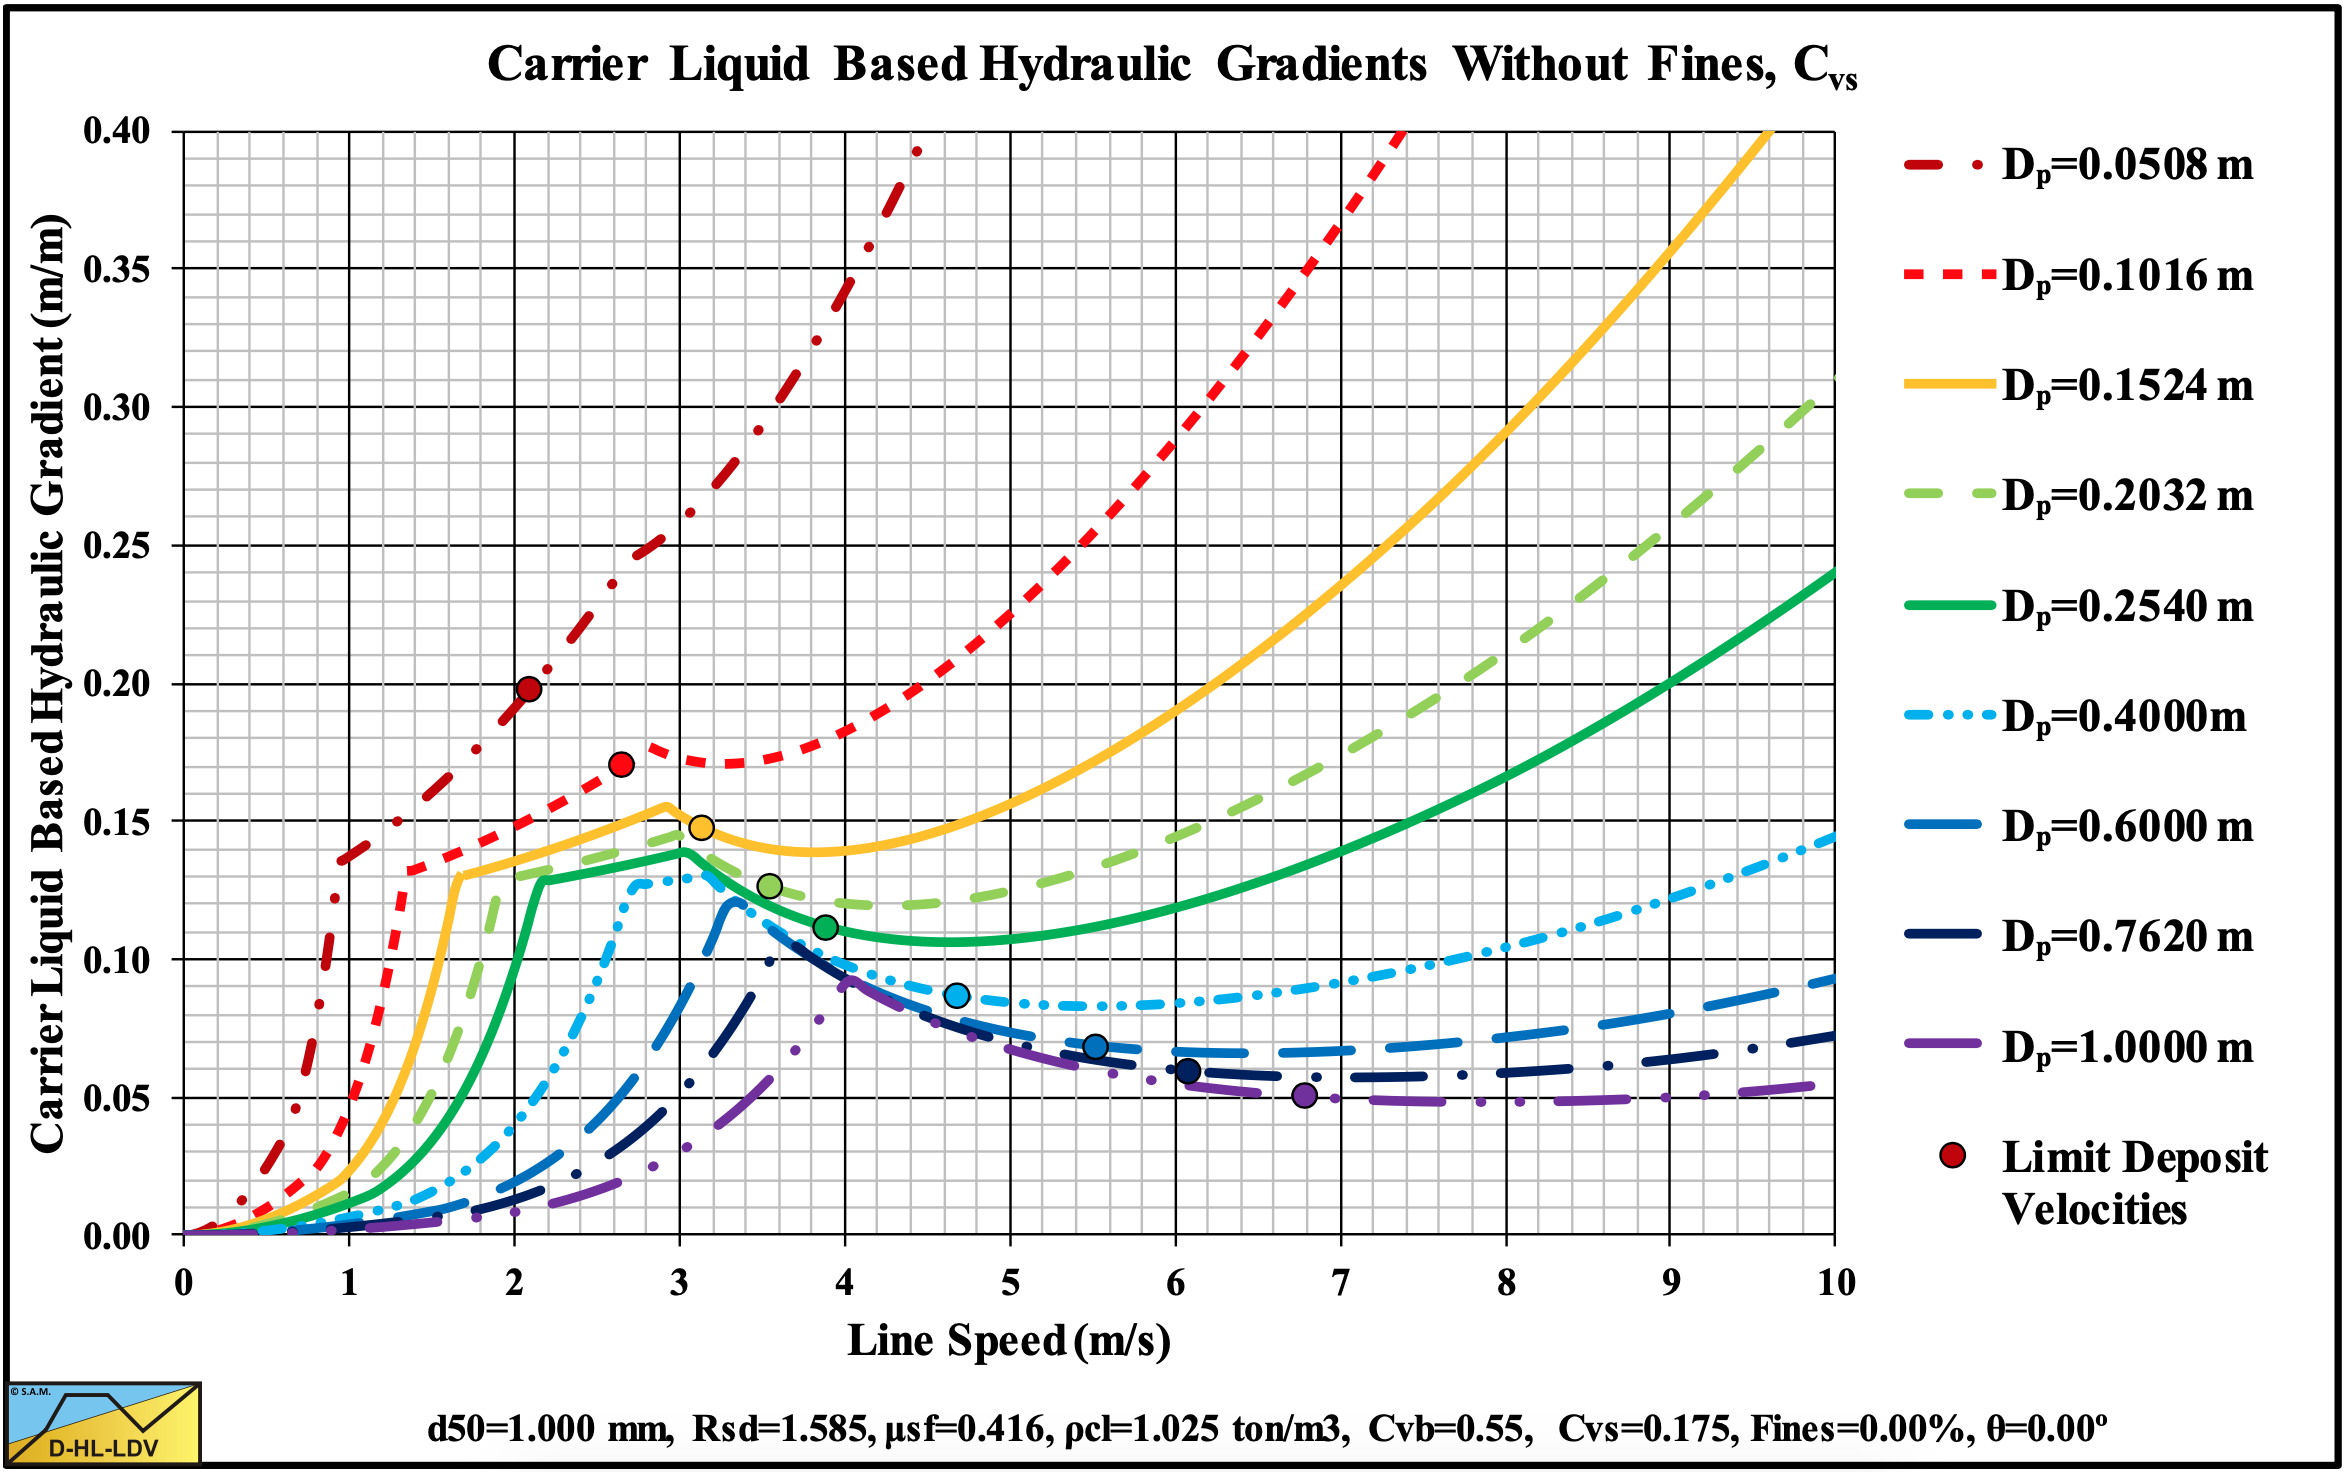
Figure 13.5-9: The hydraulic gradient versus the line speed for 9 particle diameters, Cvs.
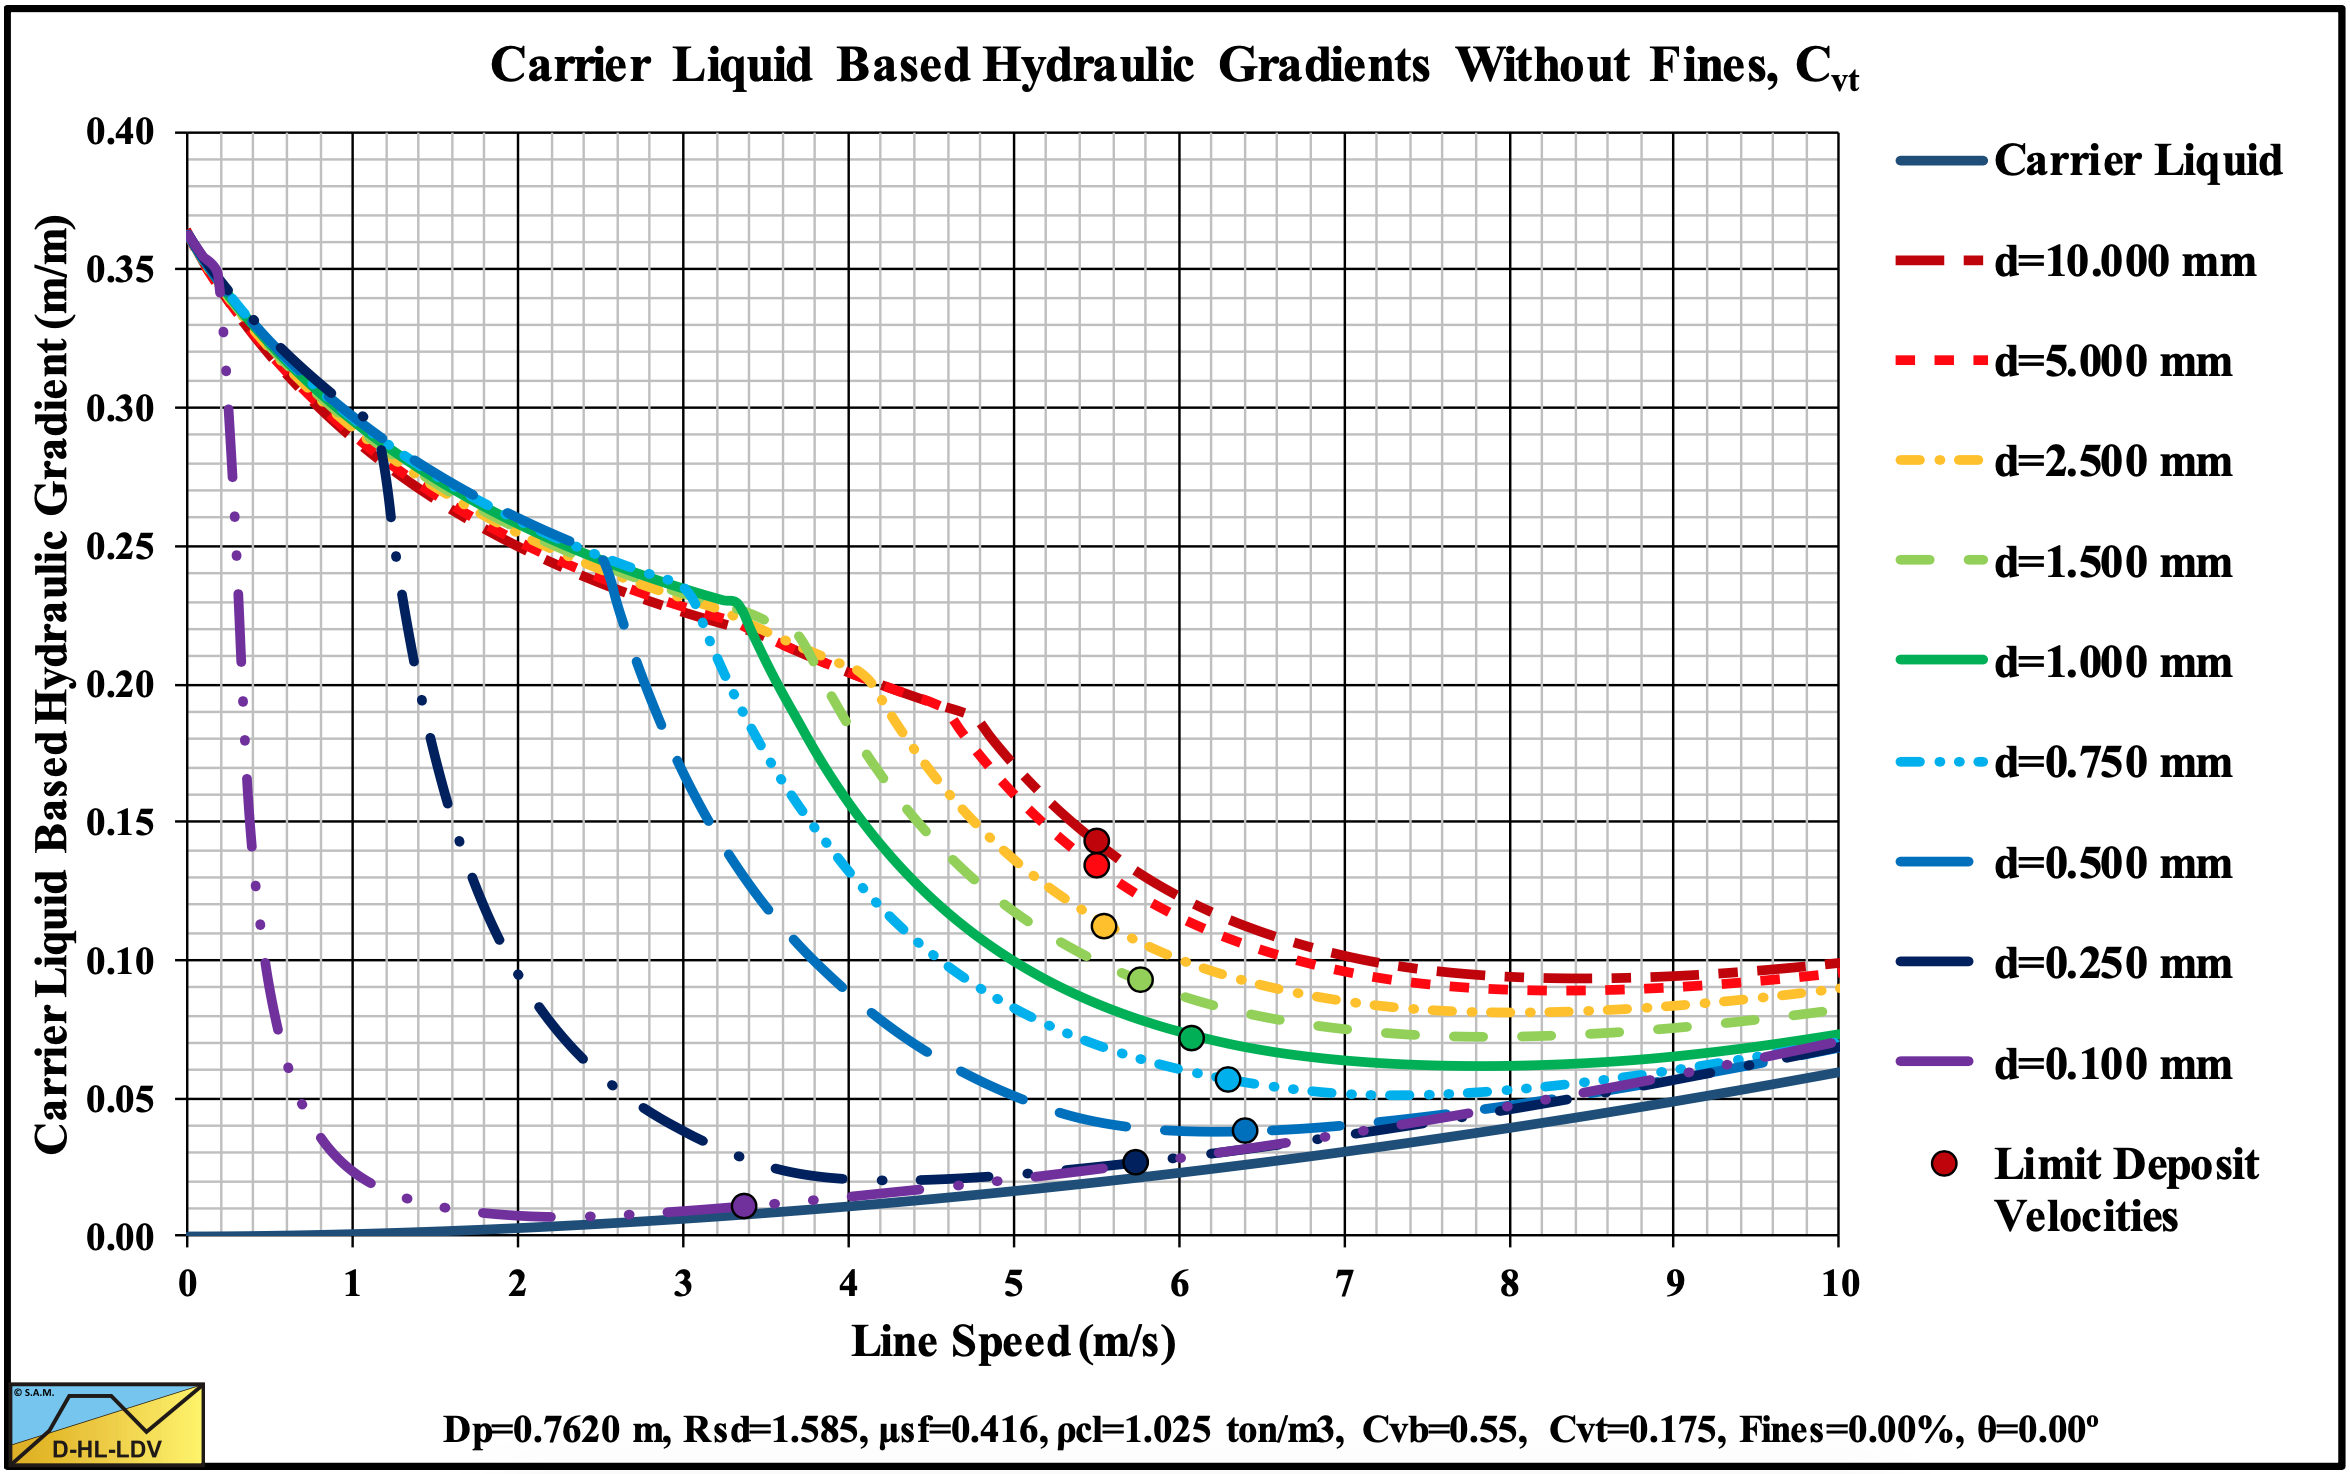
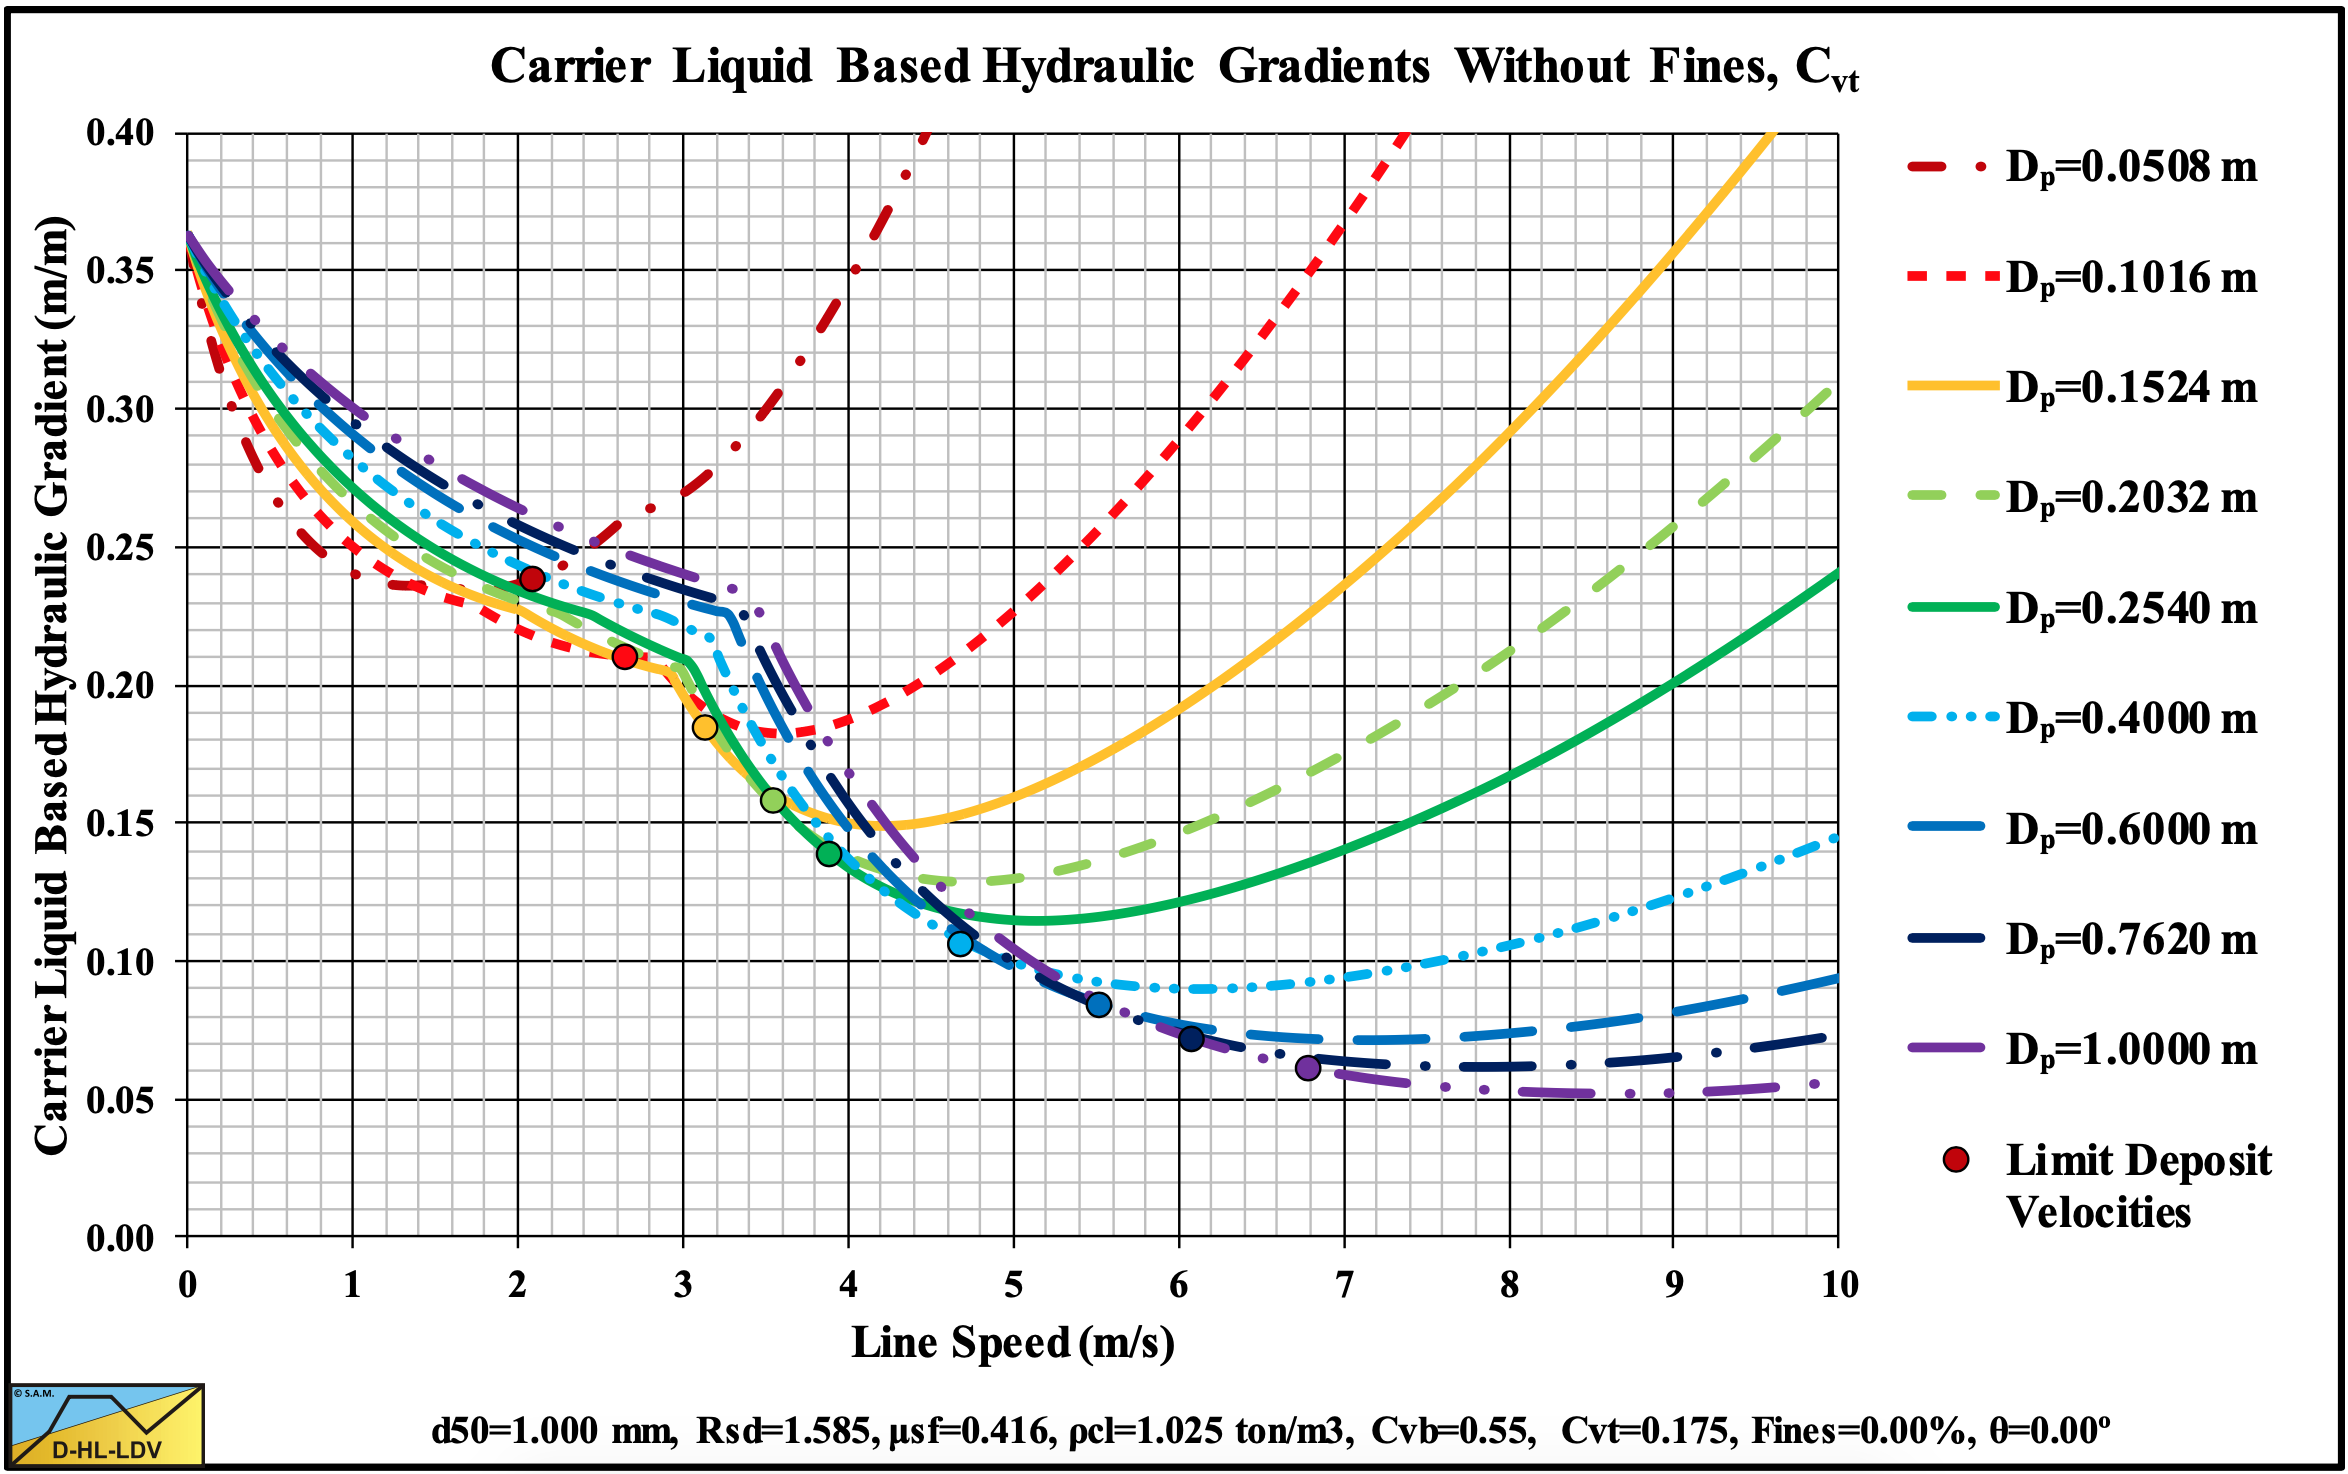
Figure 13.5-10: The hydraulic gradient versus the line speed for 9 particle diameters, Cvt.
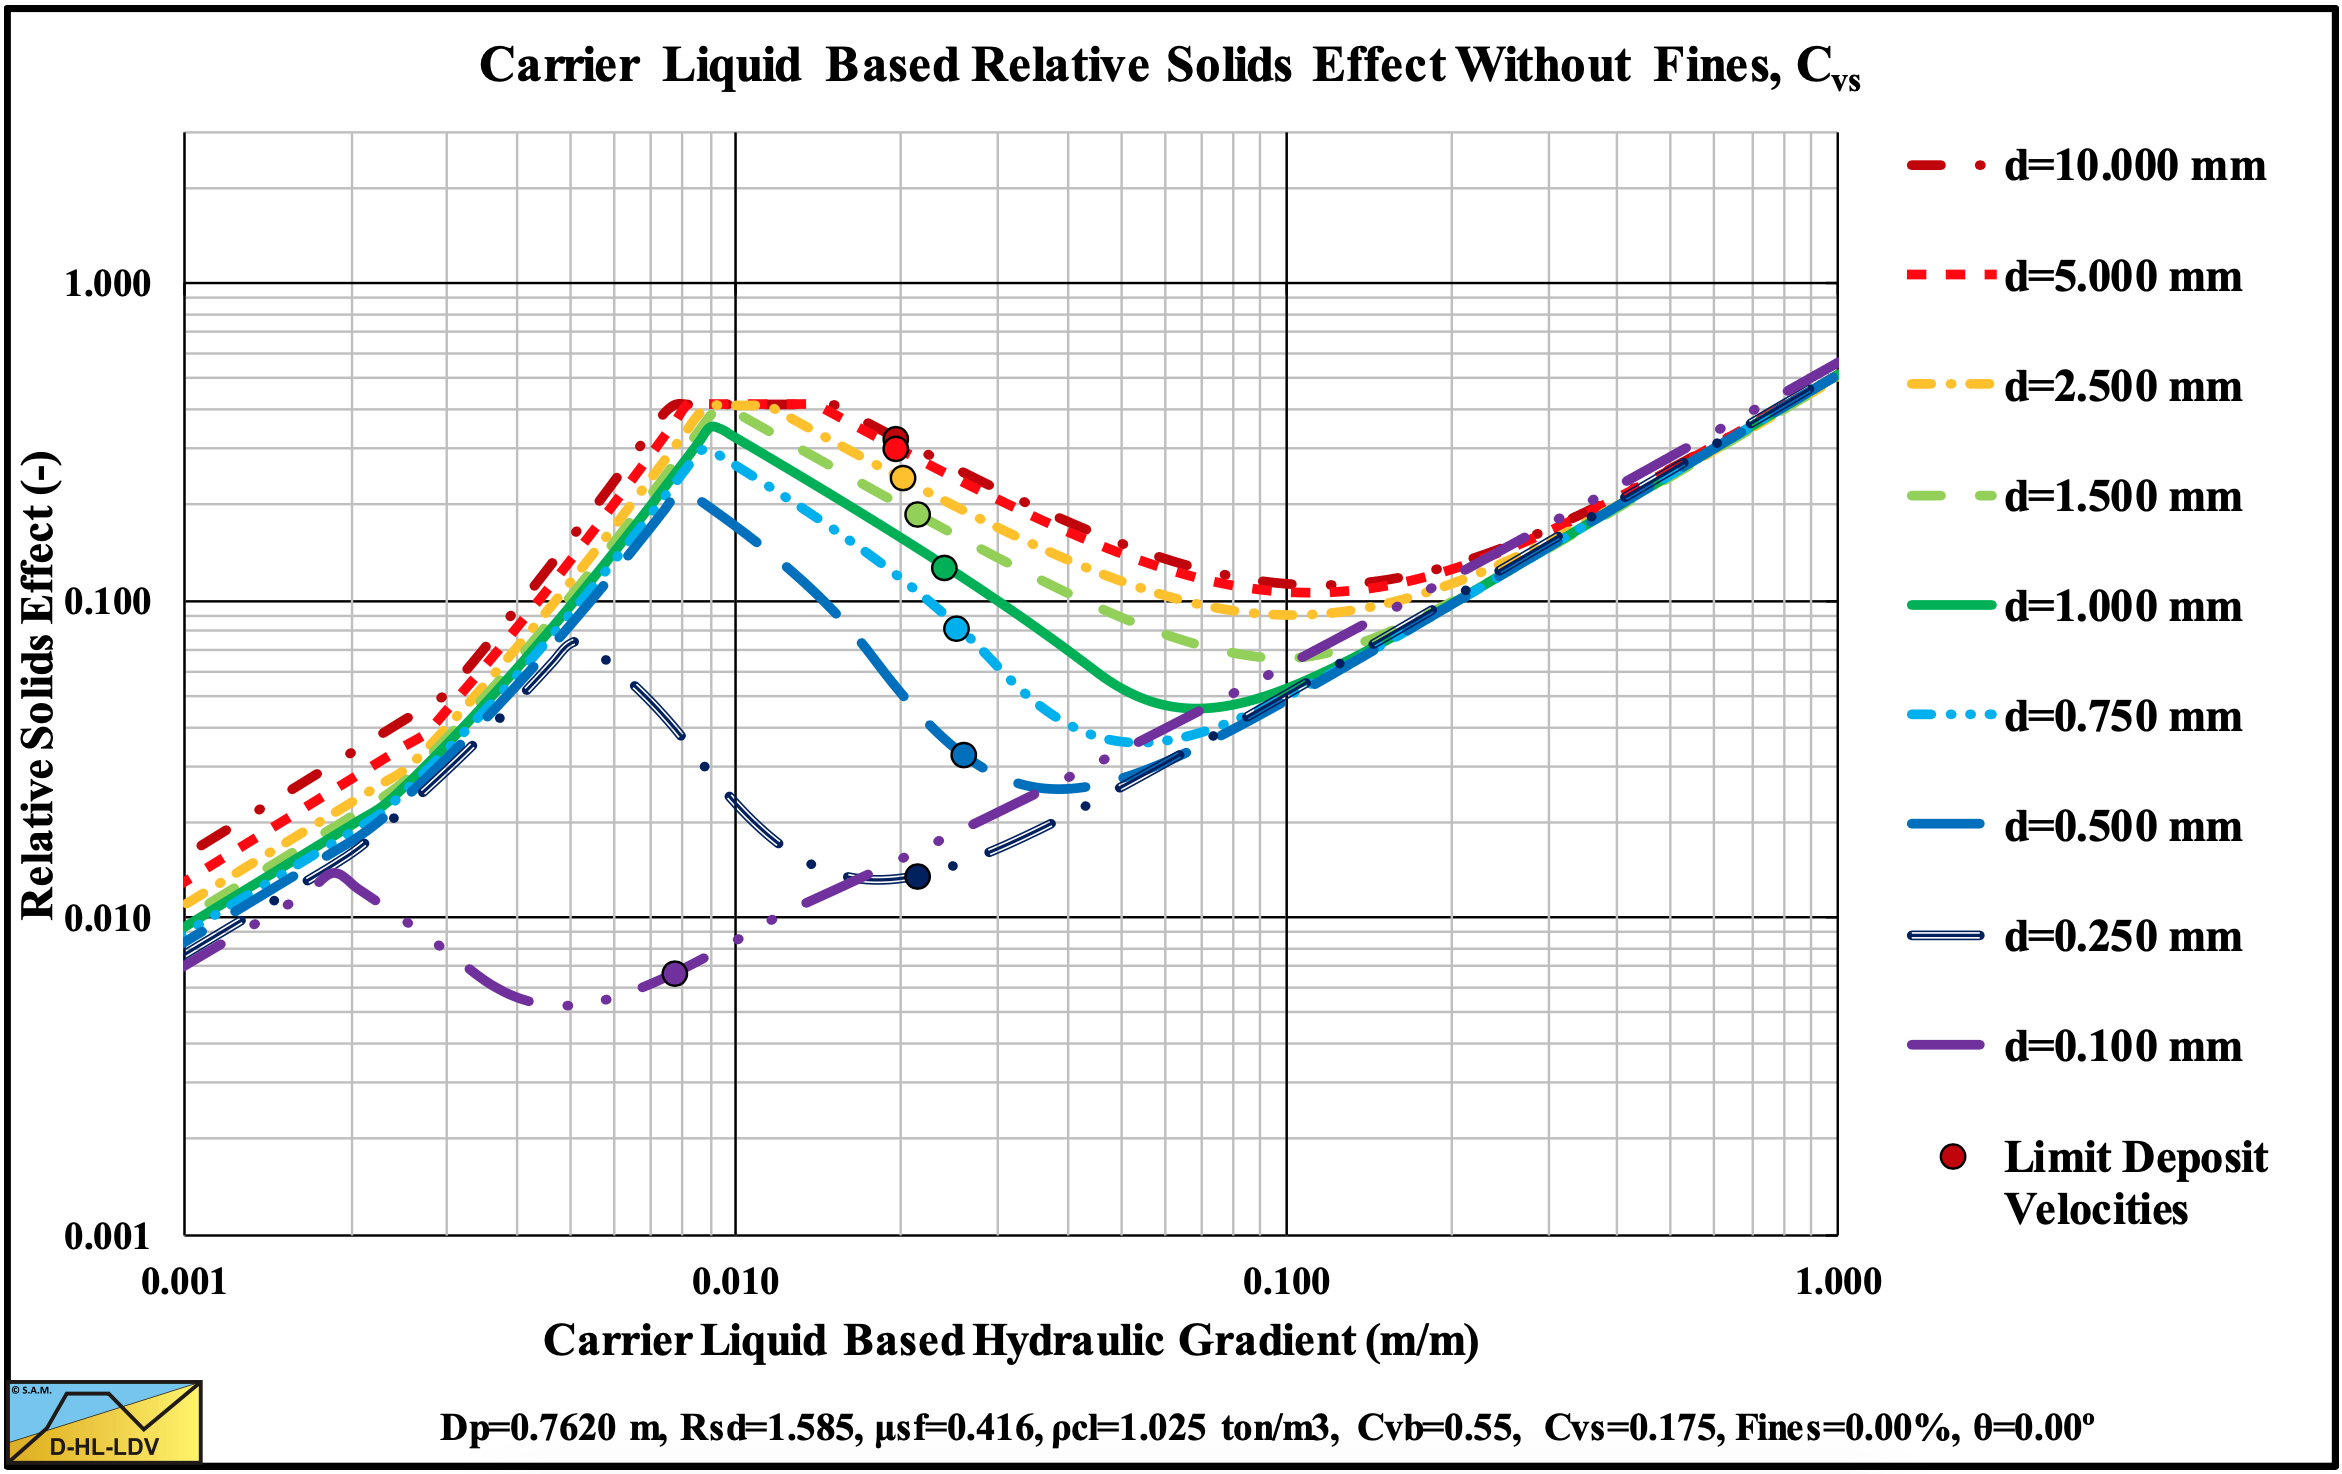
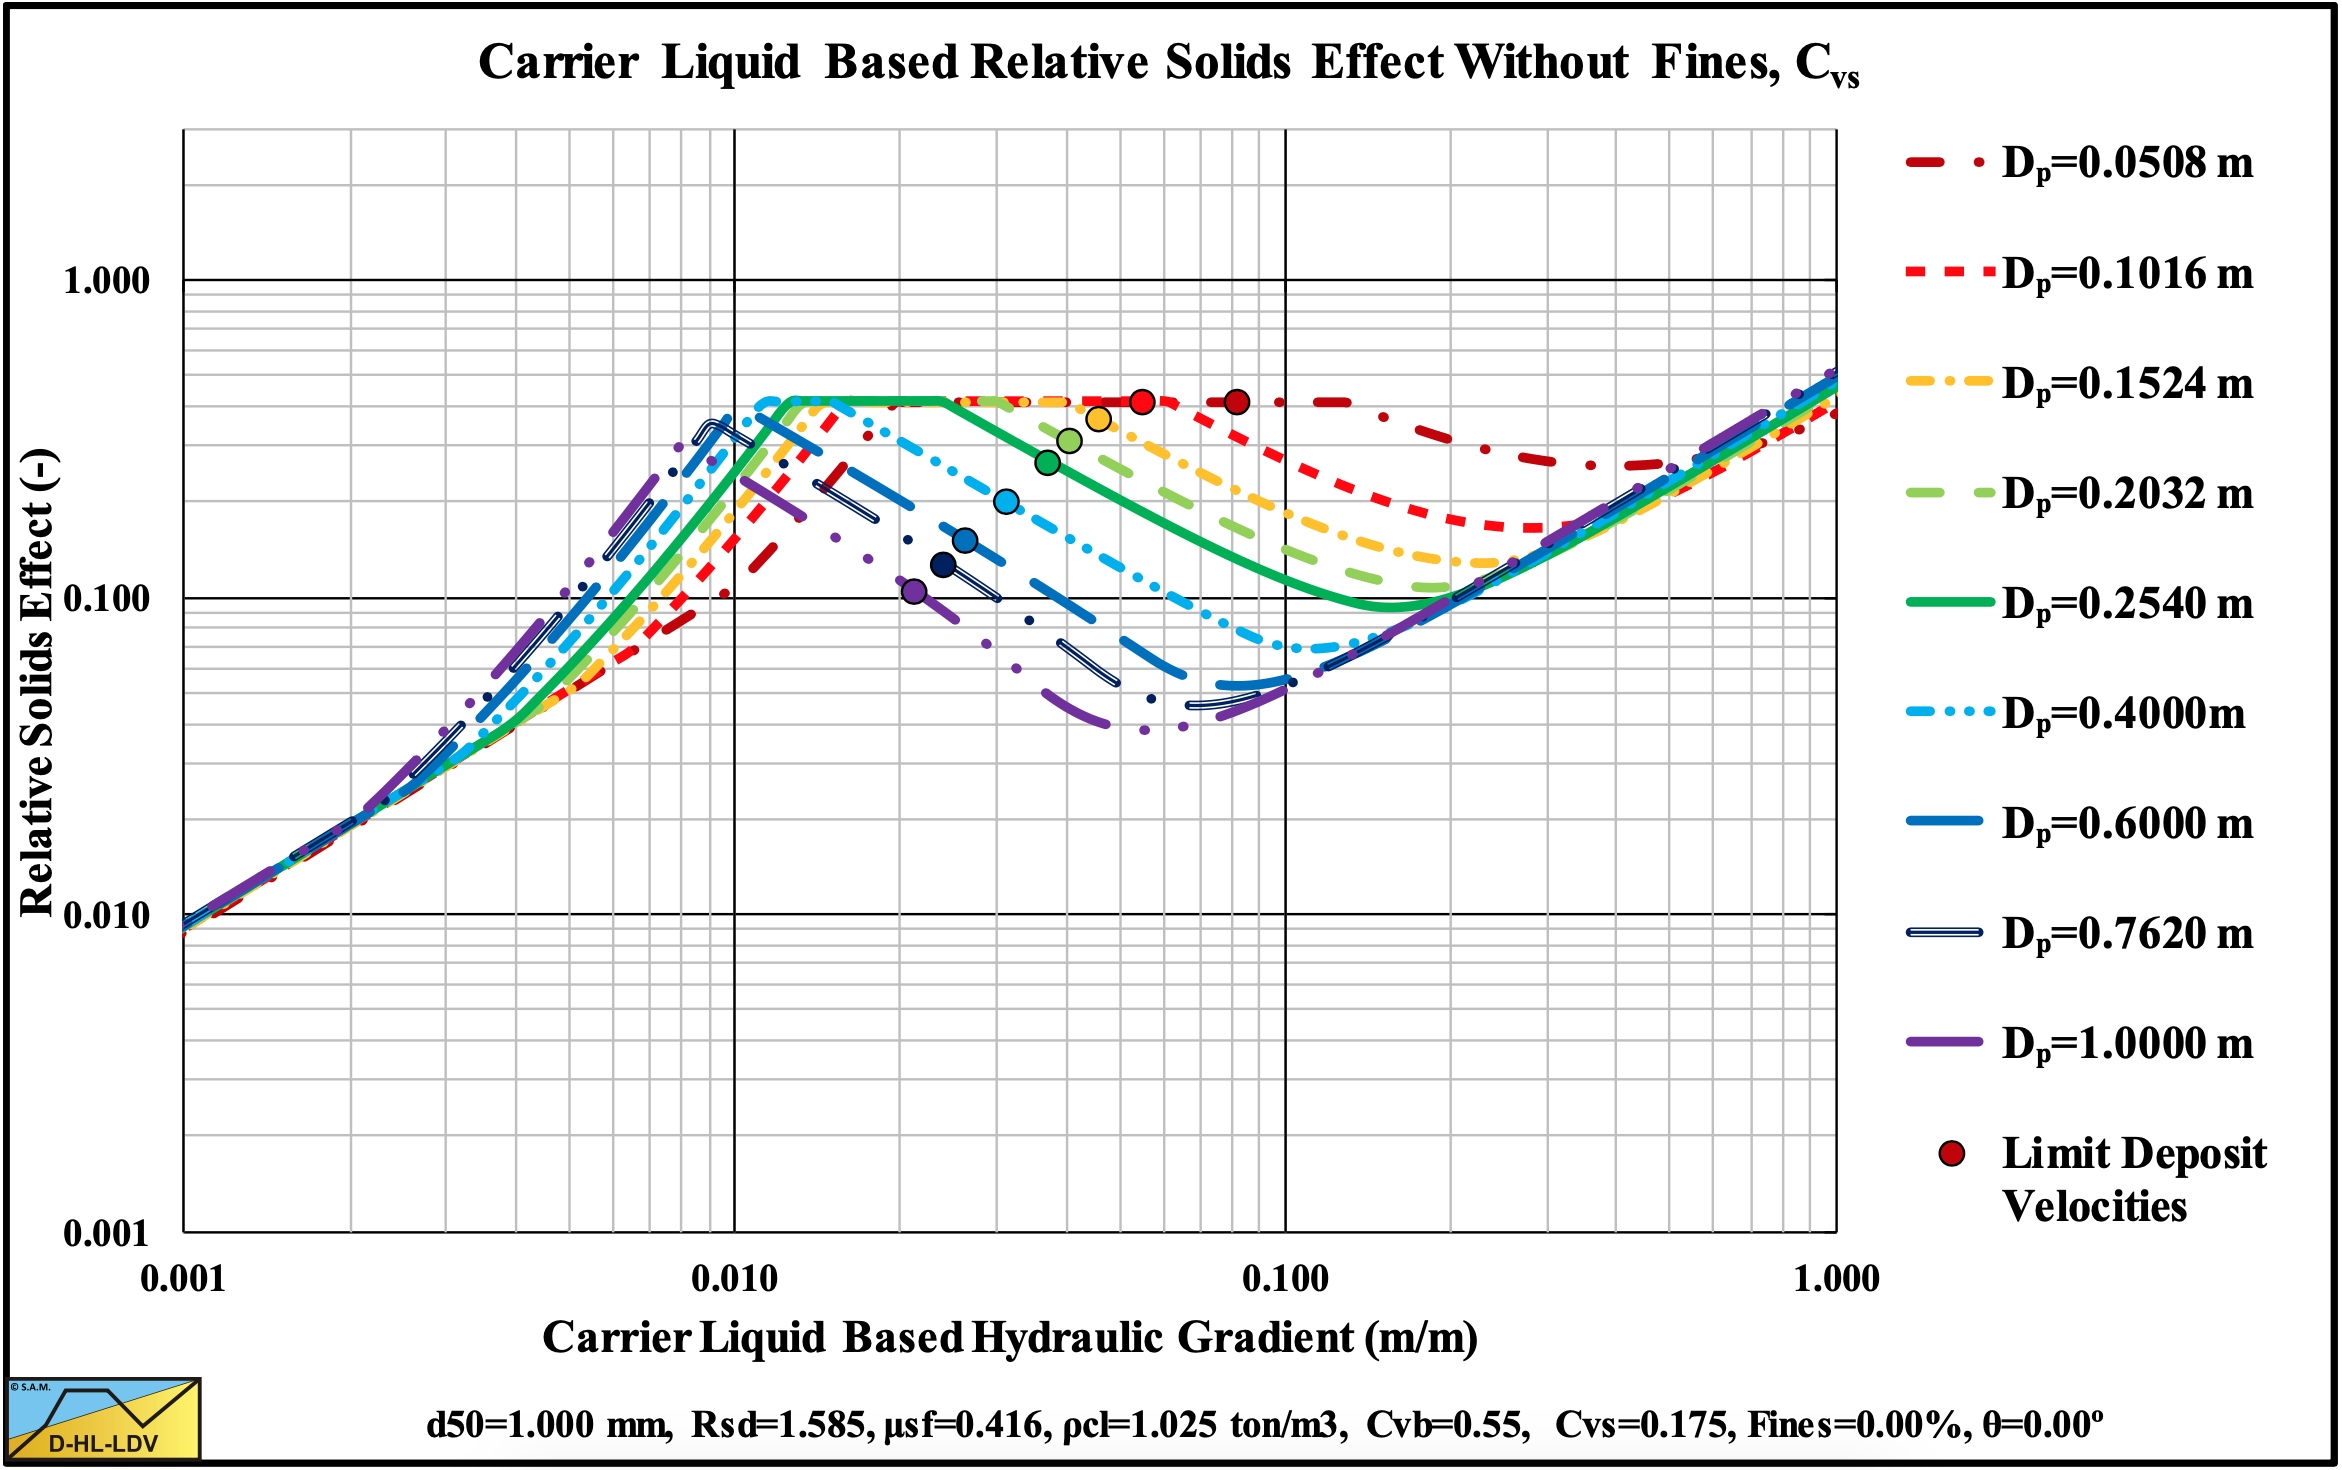
Figure 13.5-11: The relative excess hydraulic gradient versus the liquid hydraulic gradient for 9 particle diameters, Cvs.
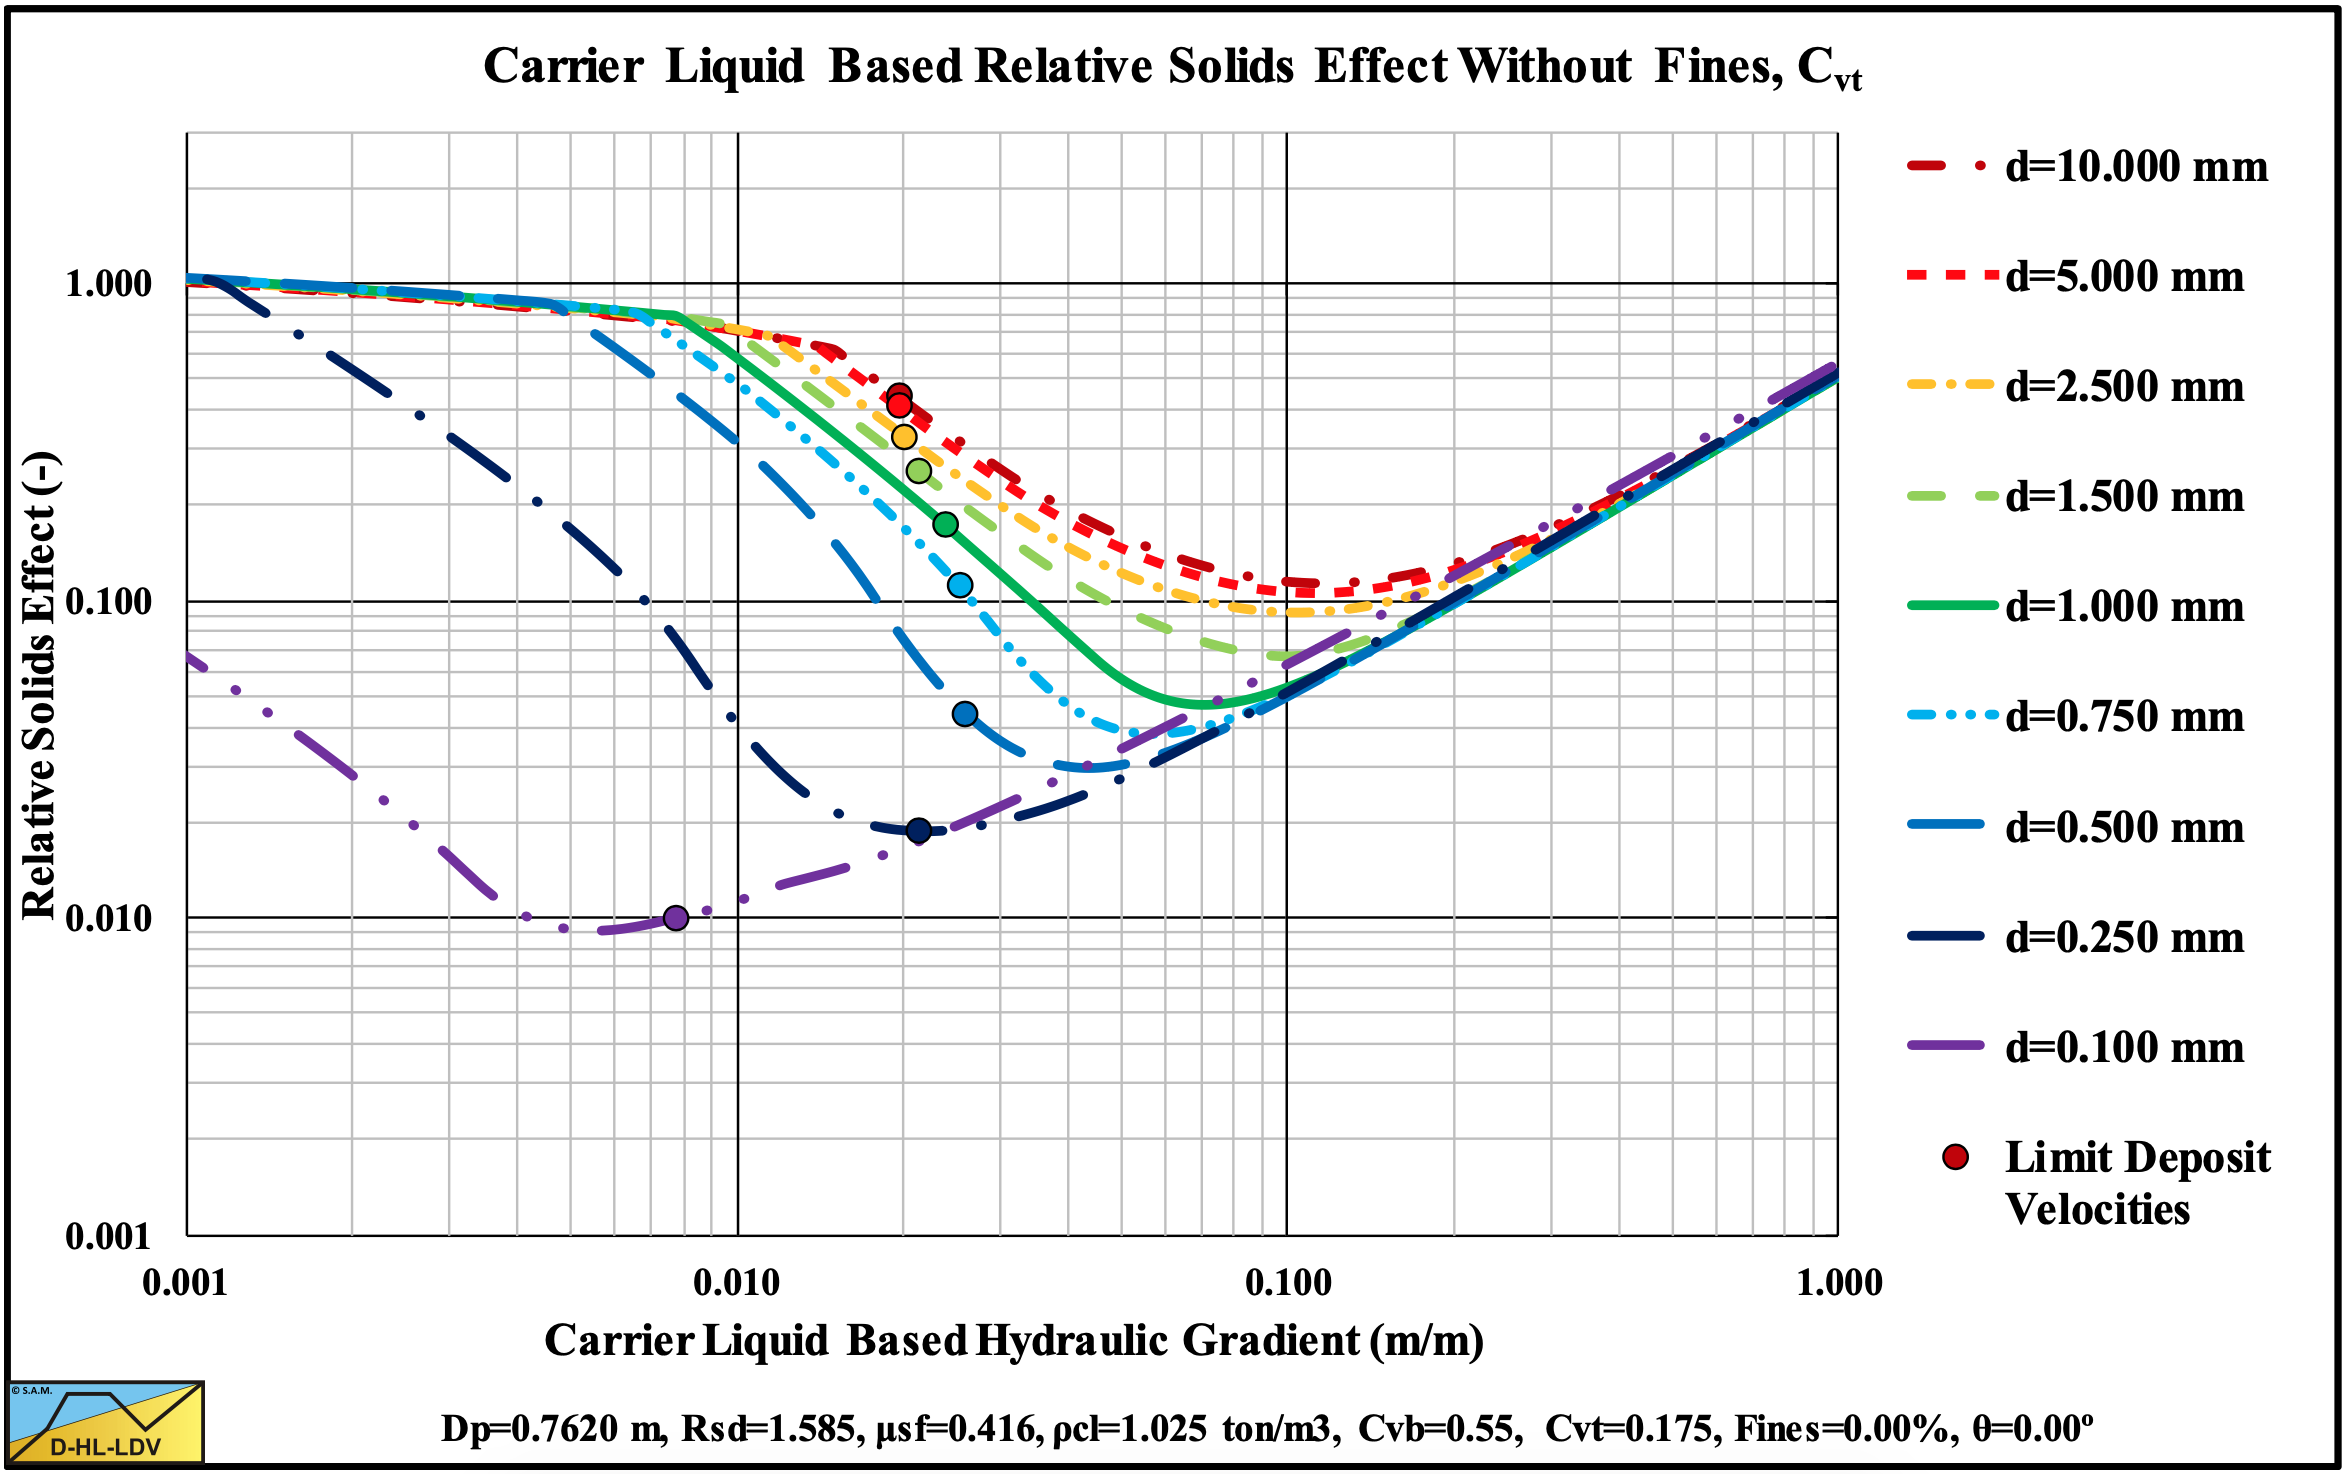
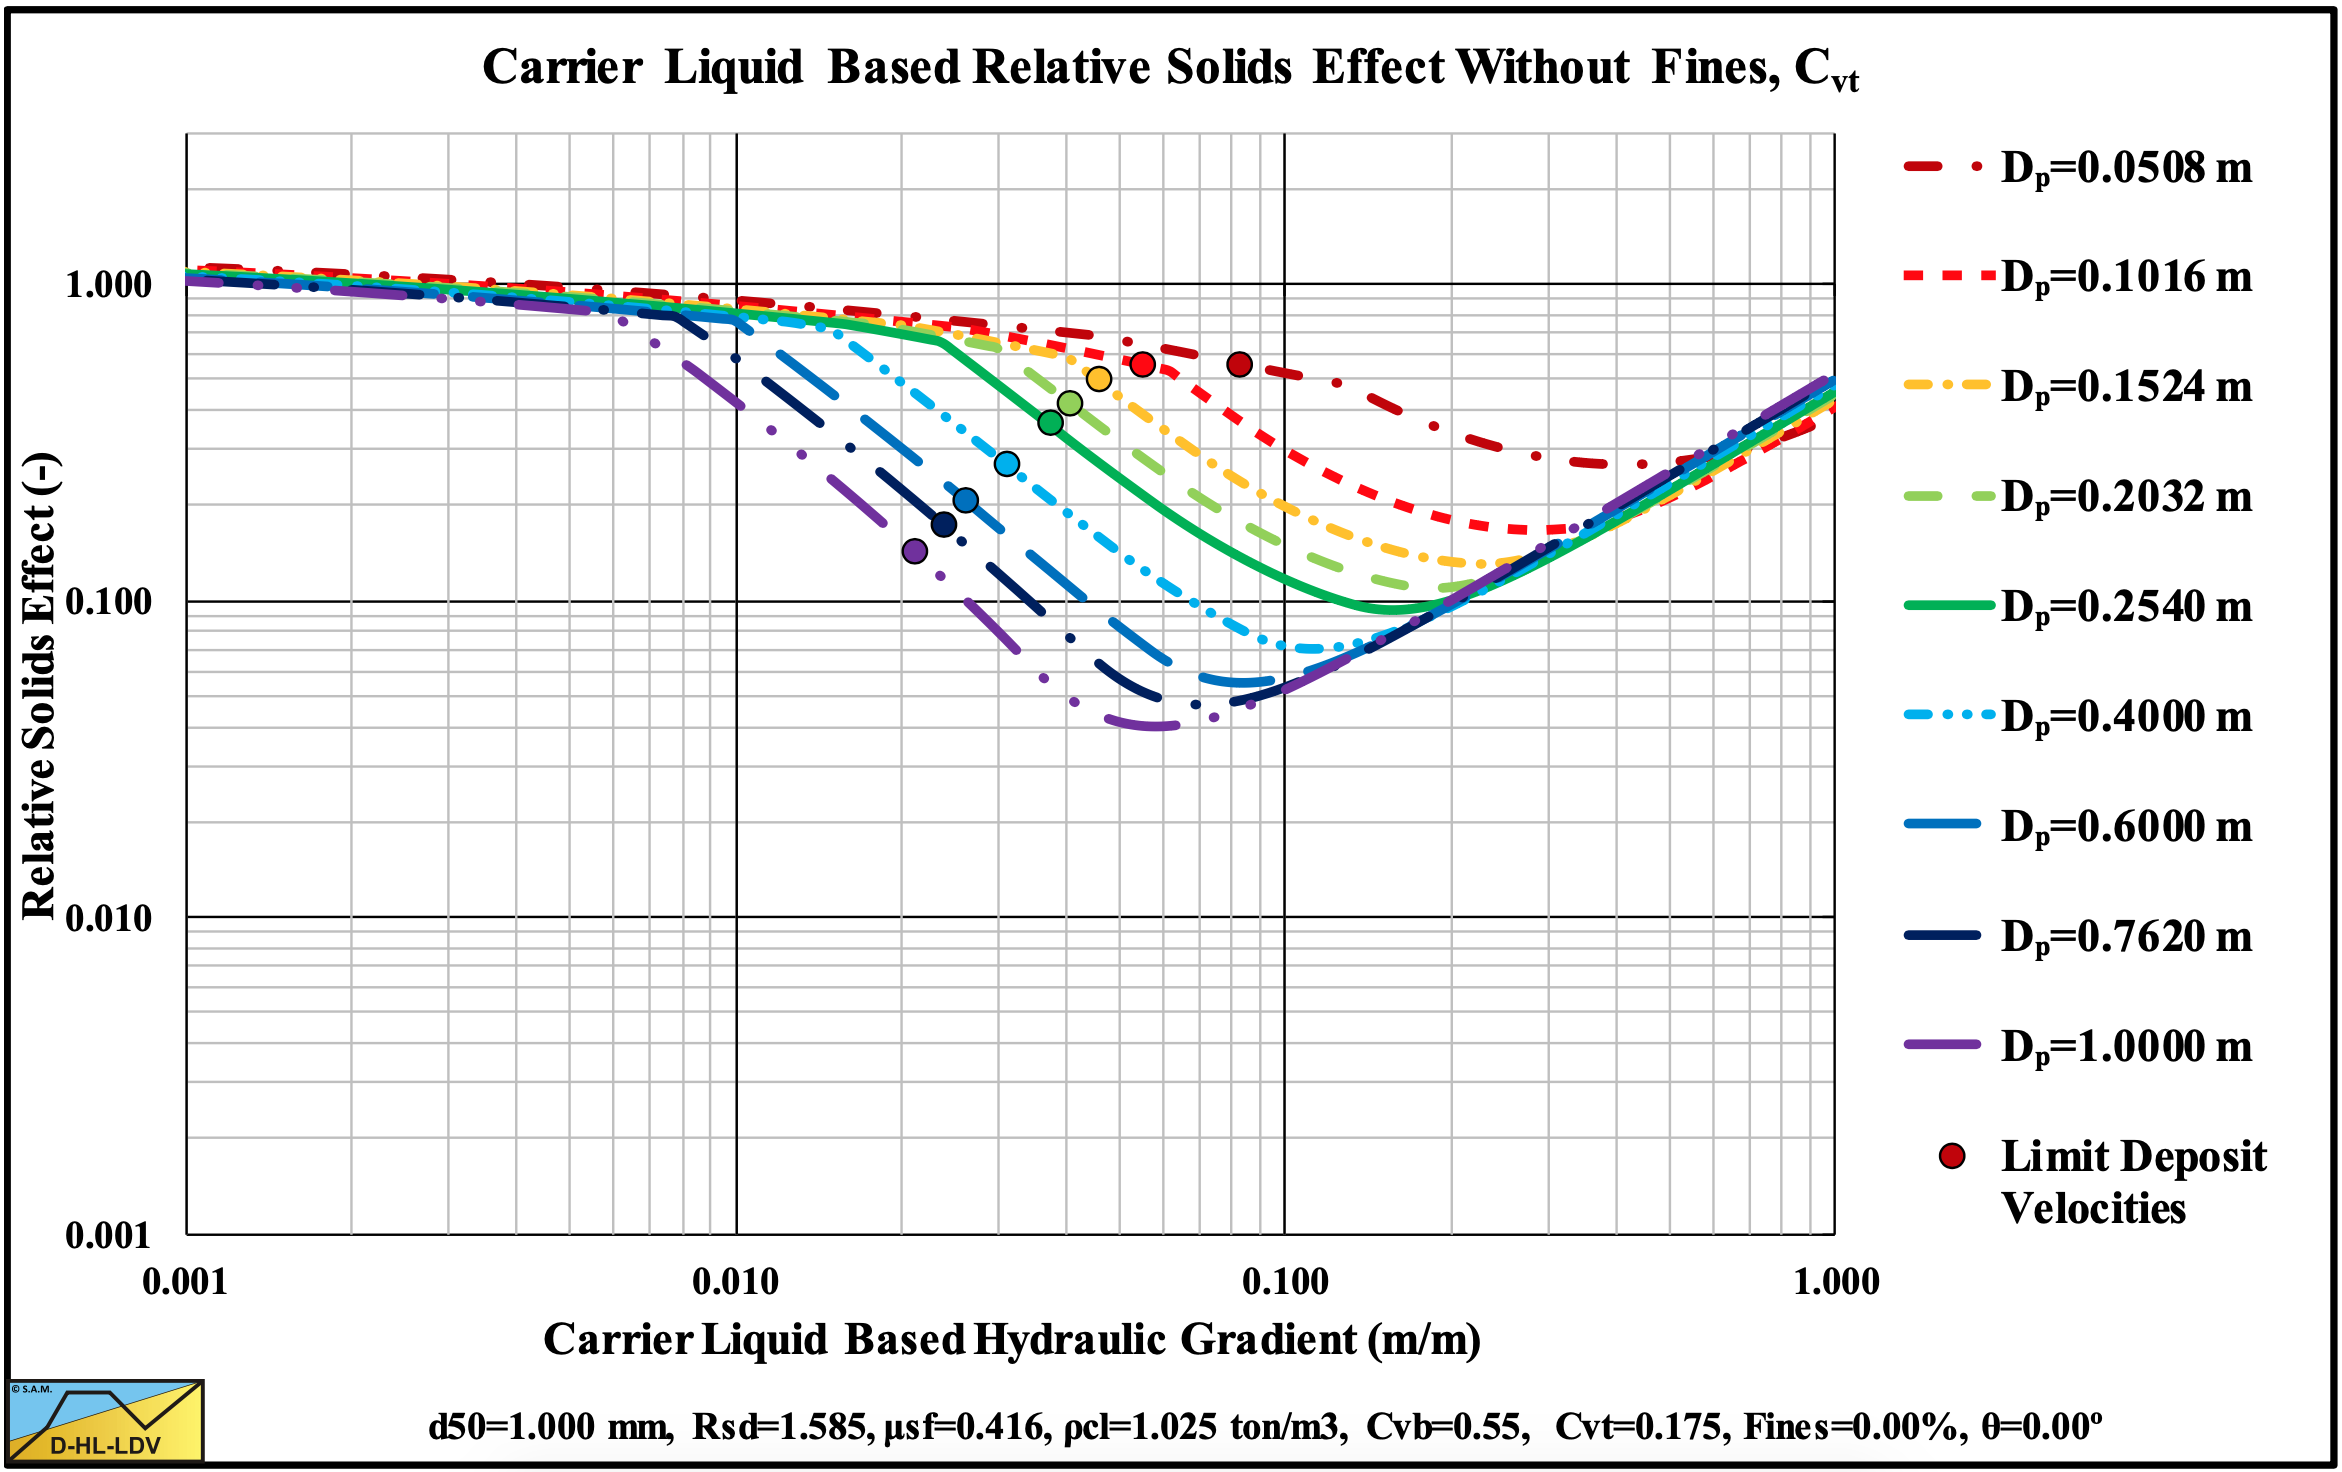
Figure 13.5-12: The relative excess hydraulic gradient versus the liquid hydraulic gradient for 9 particle diameters, Cvt.
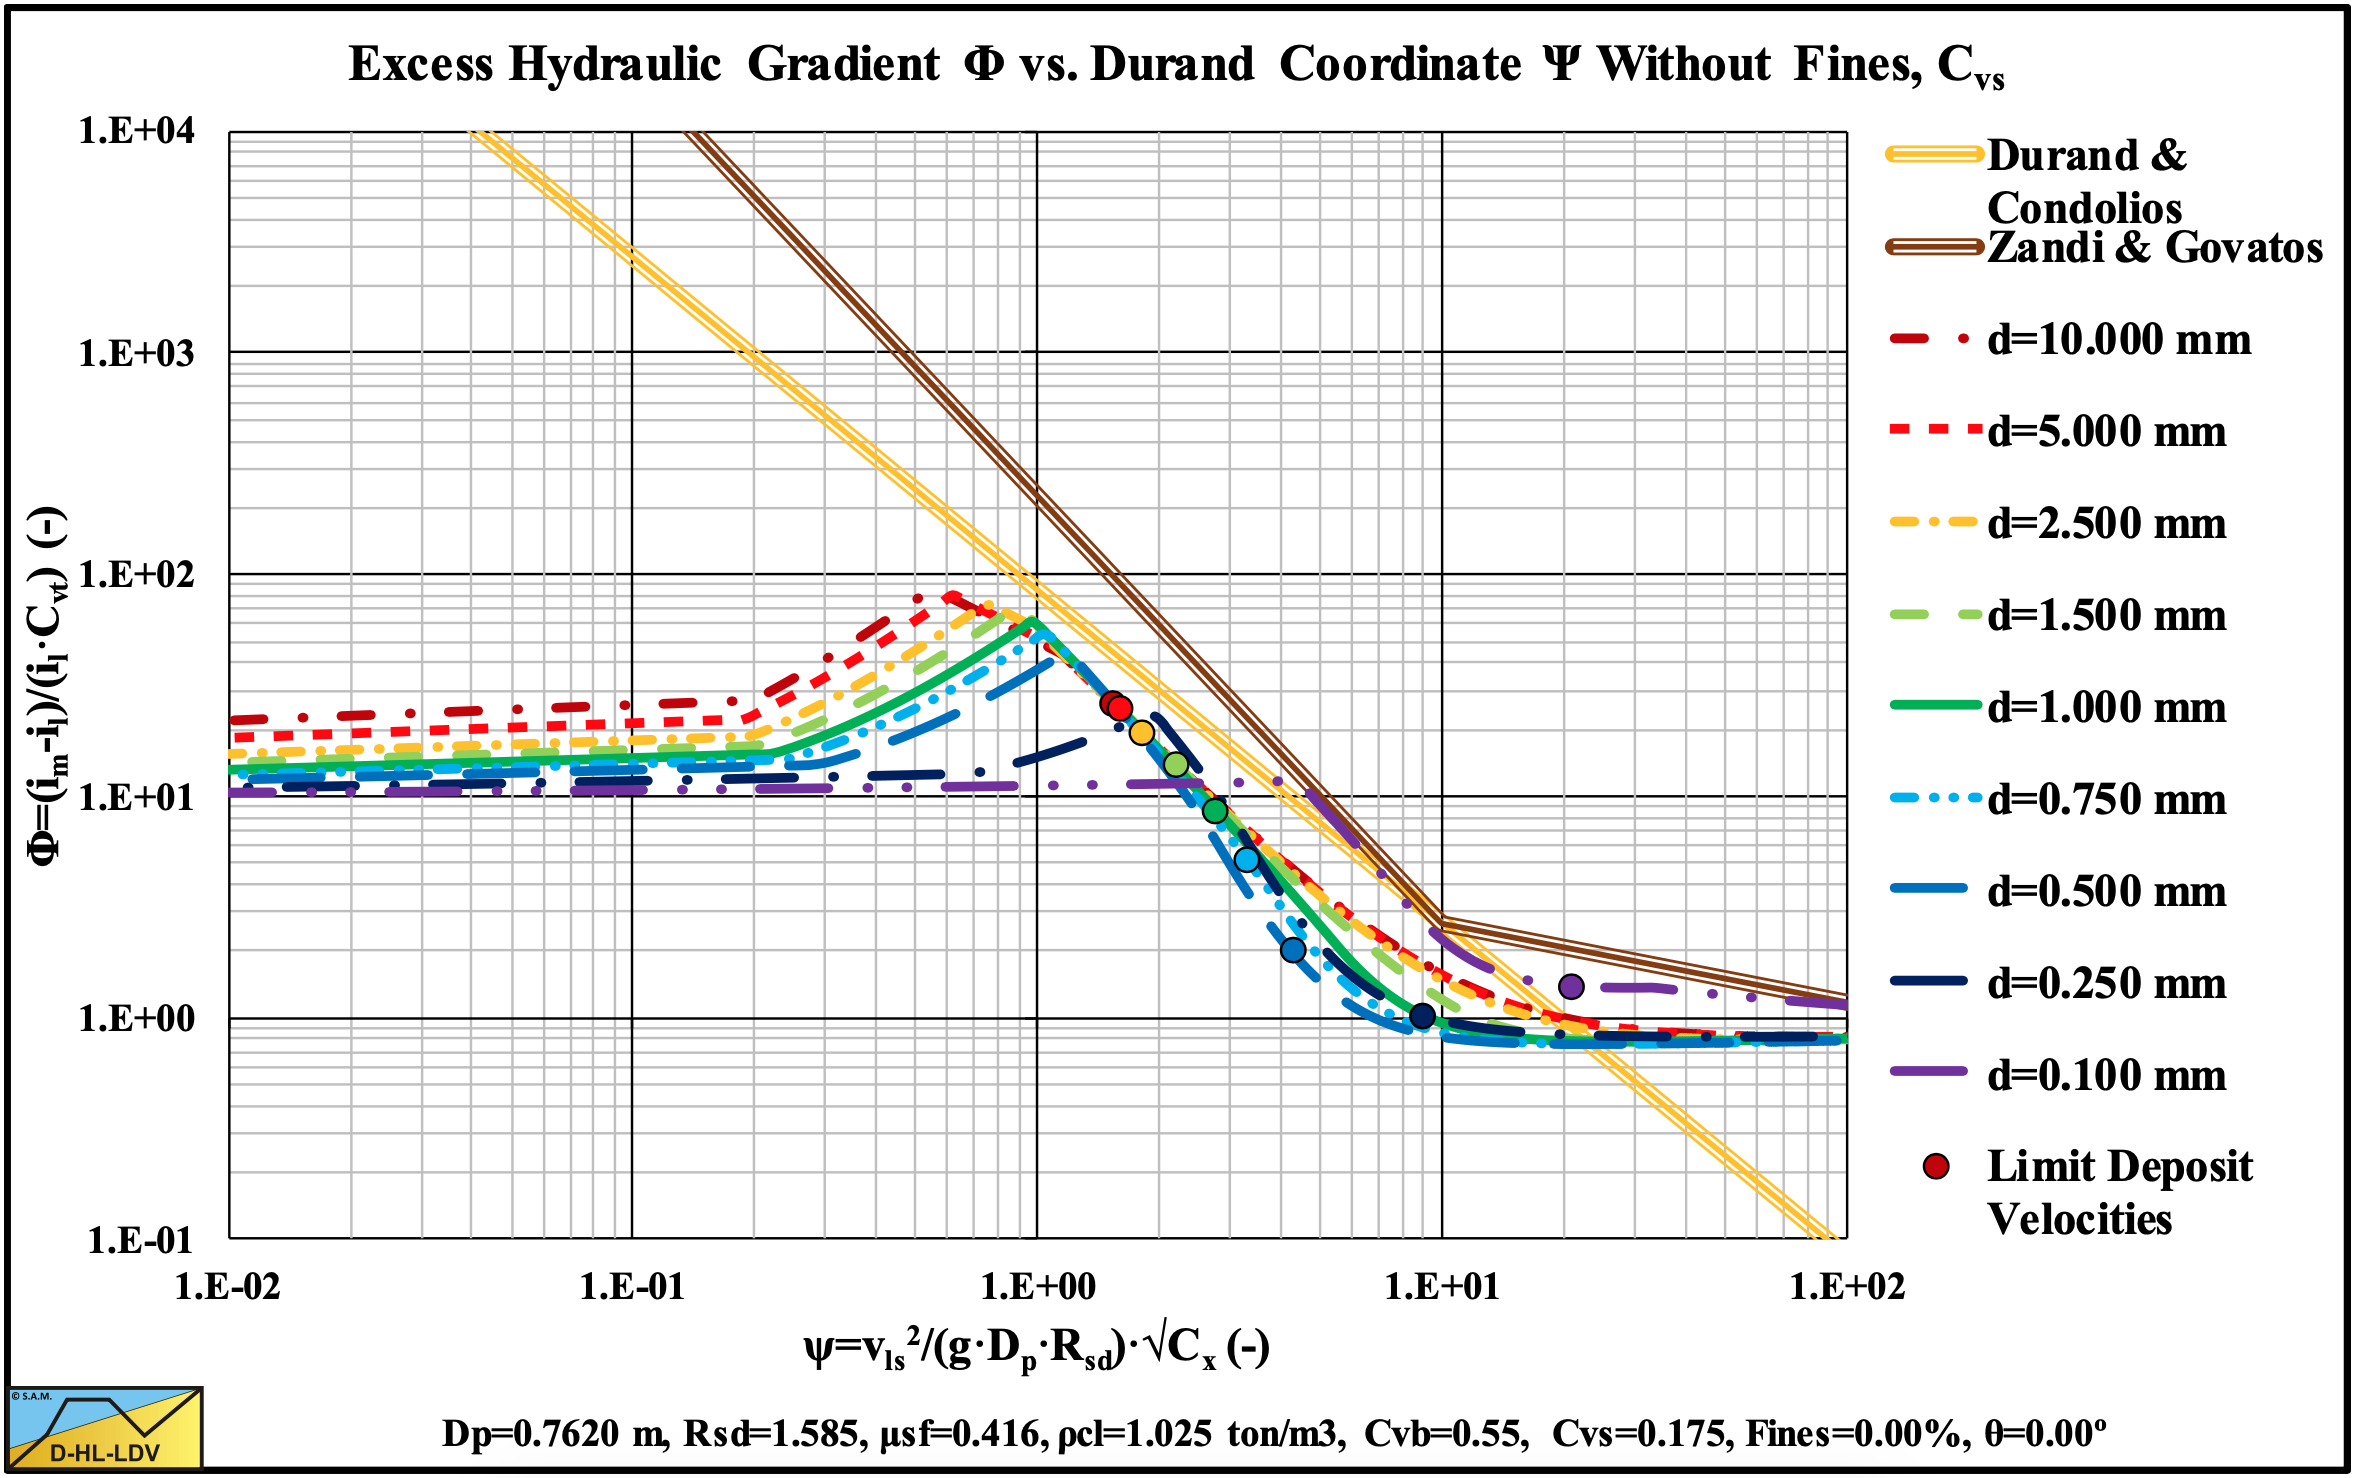
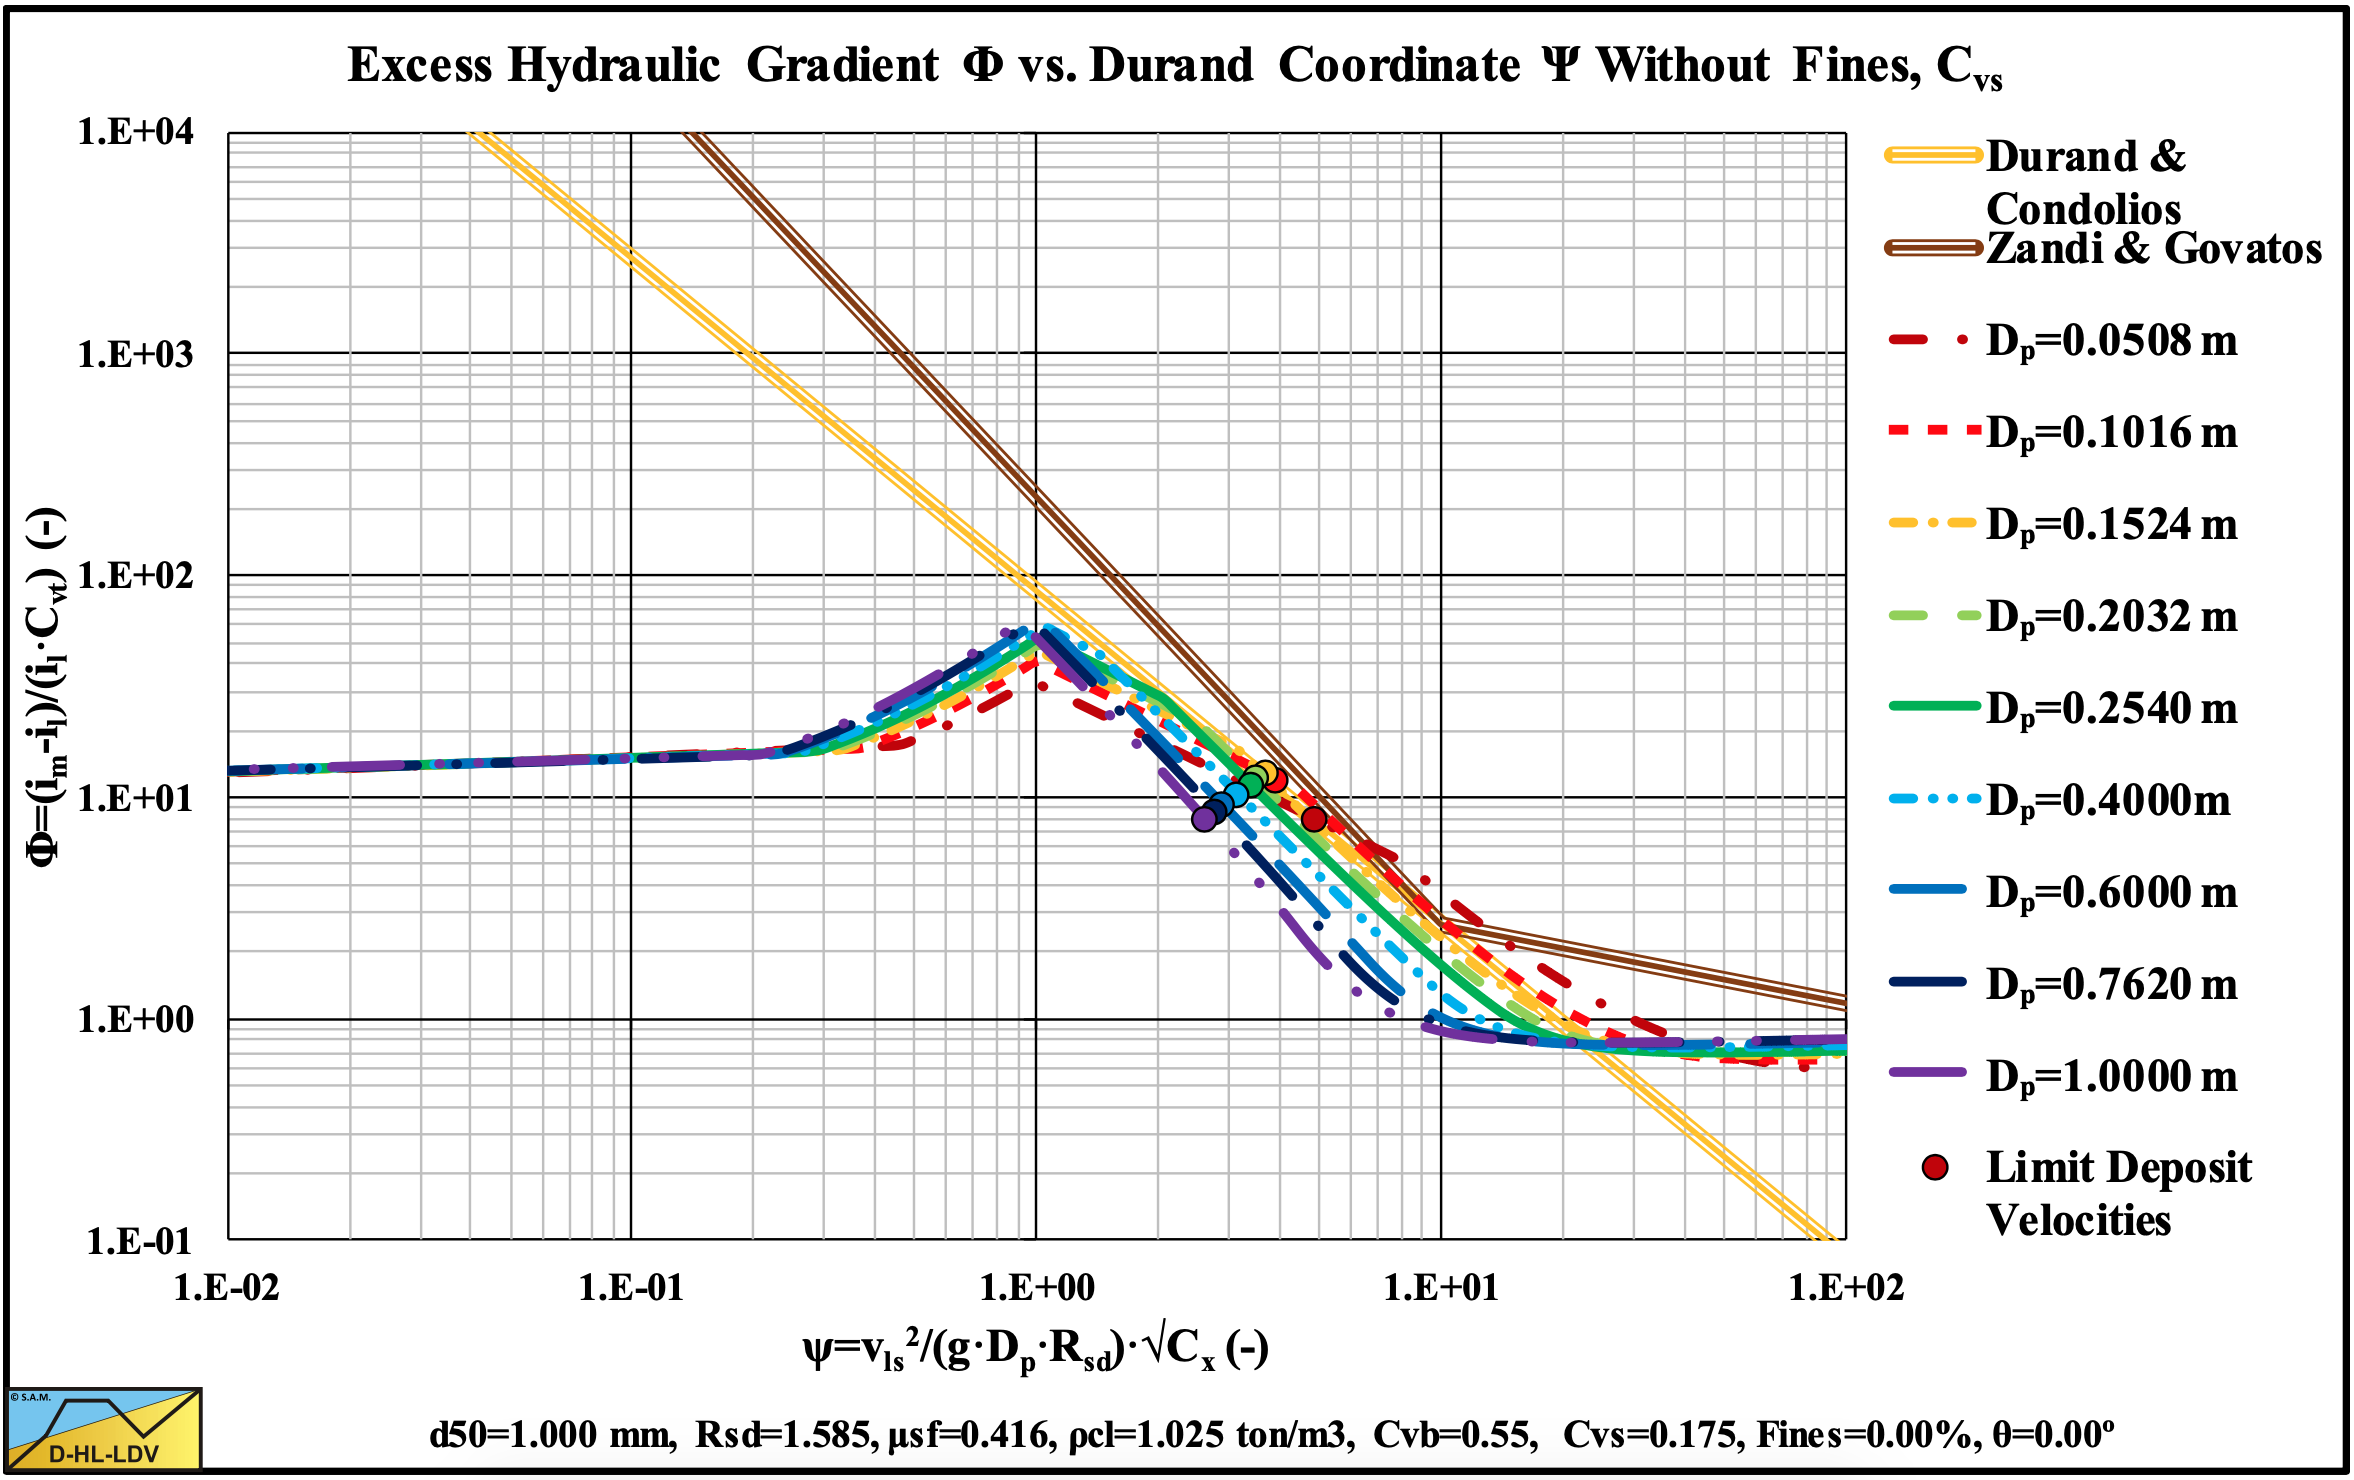
Figure 13.5-13: The hydraulic gradient on Durand coordinates for 9 particle diameters, Cvs.
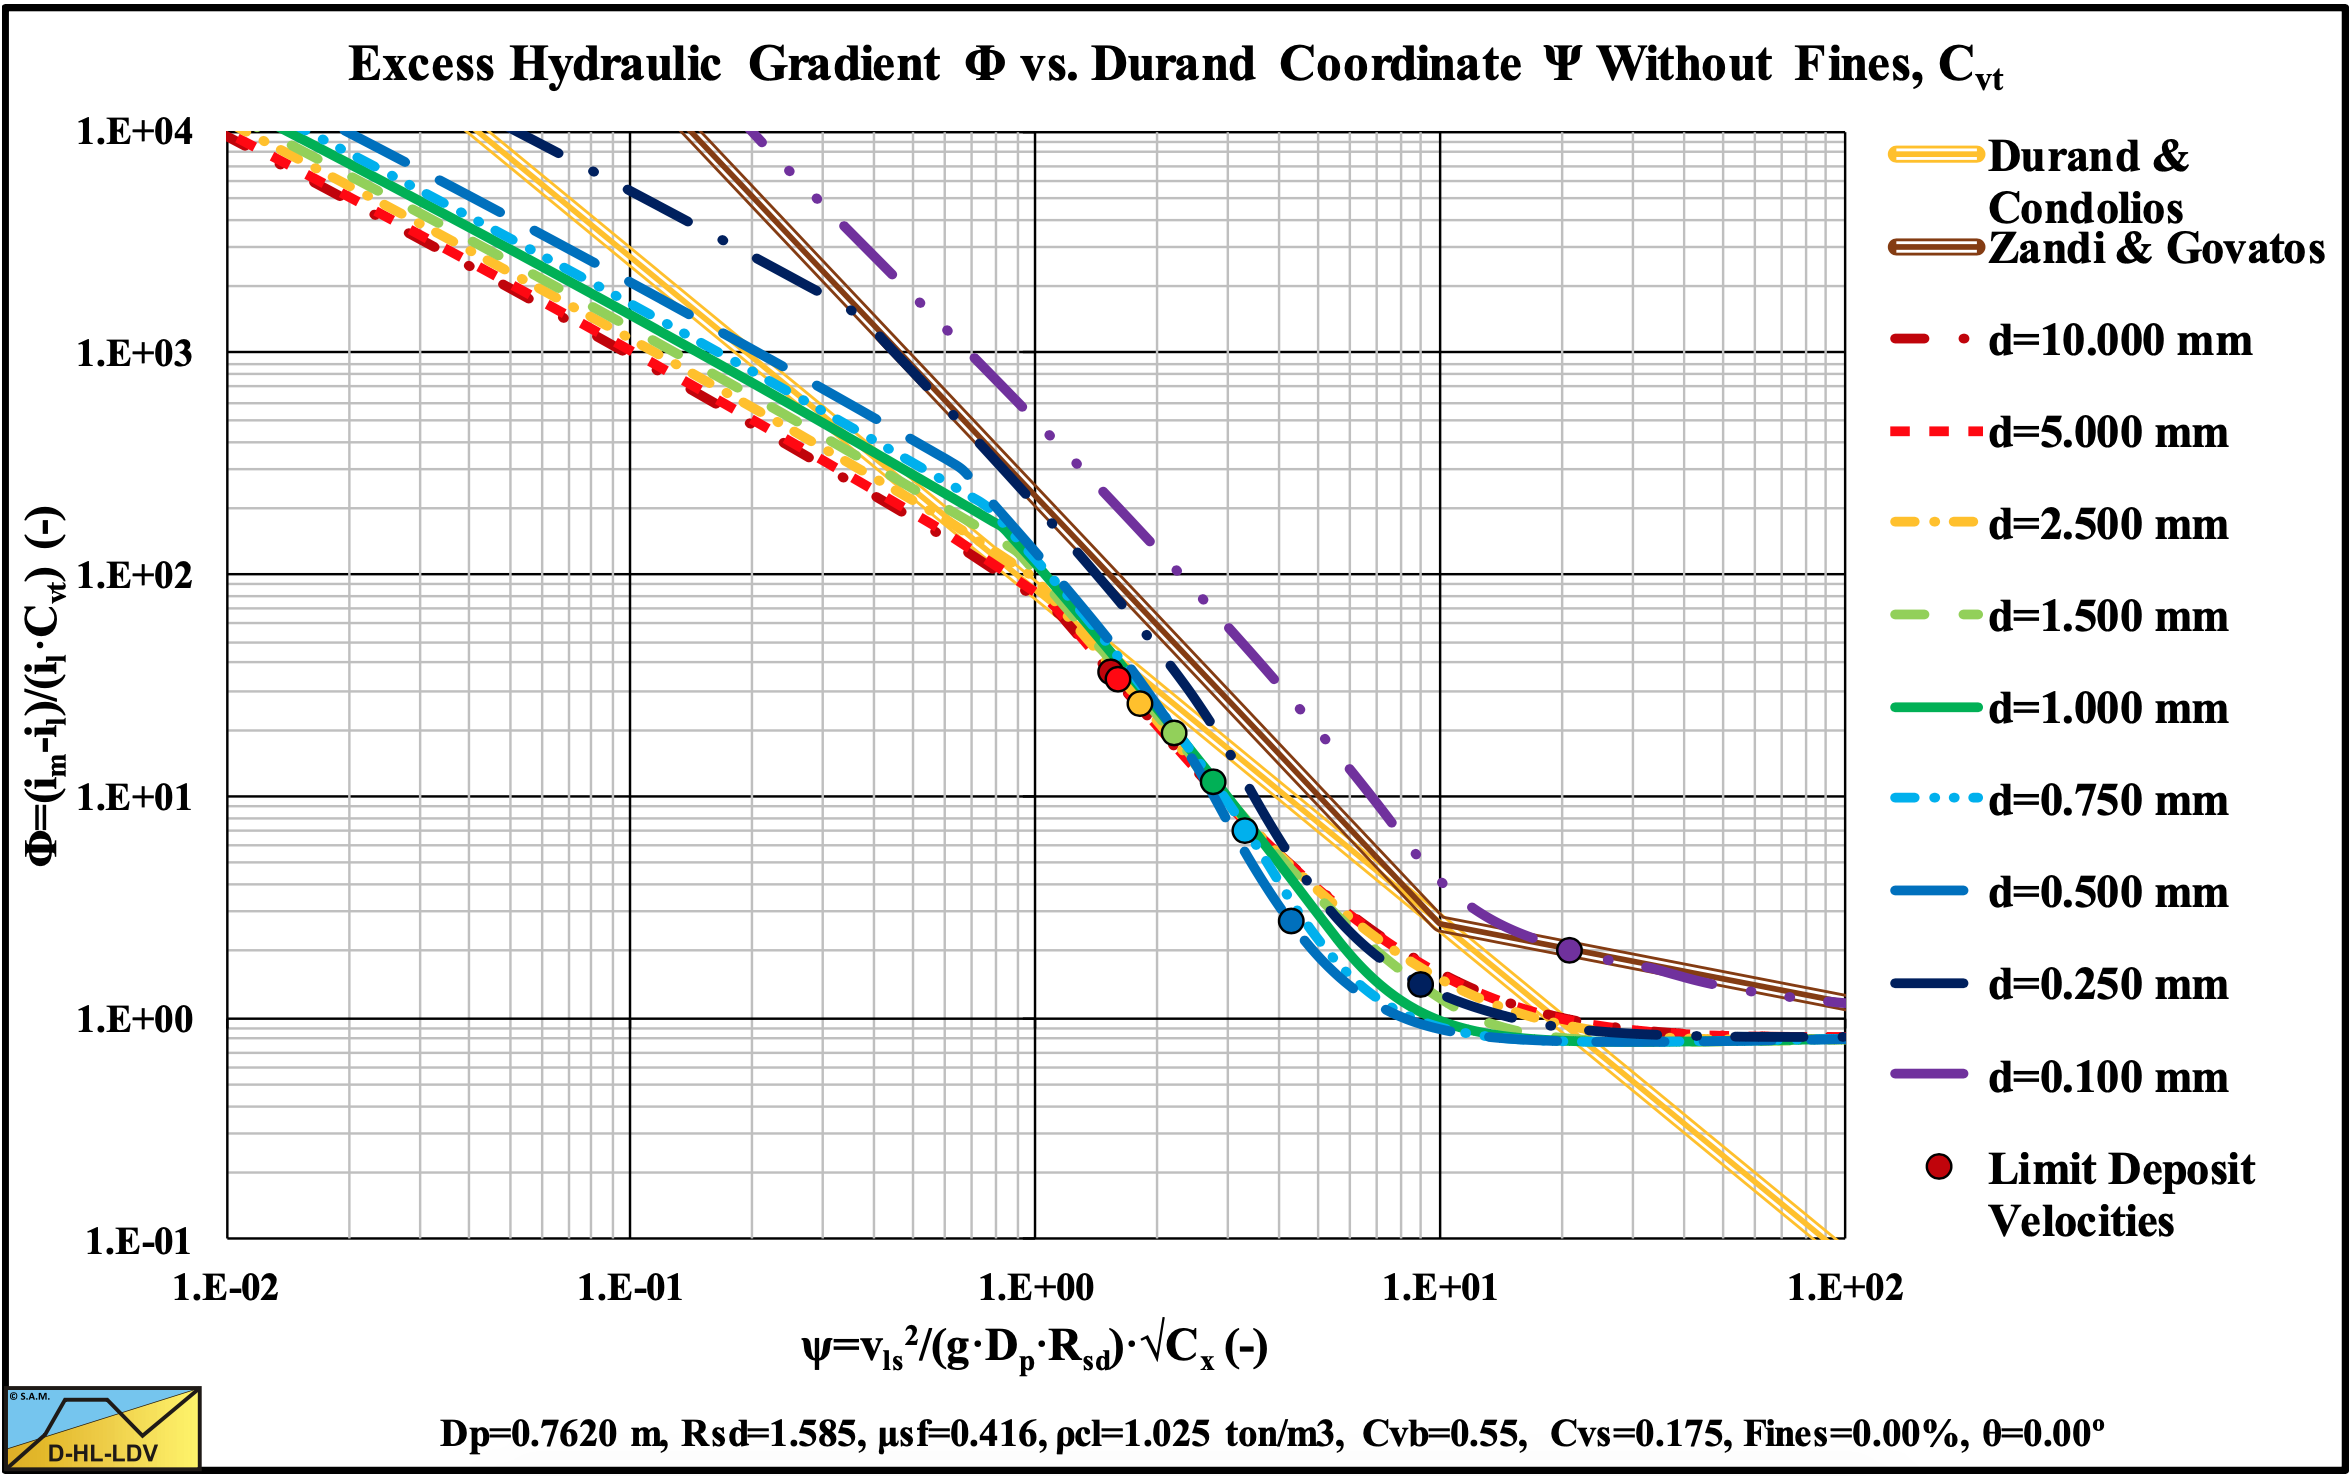
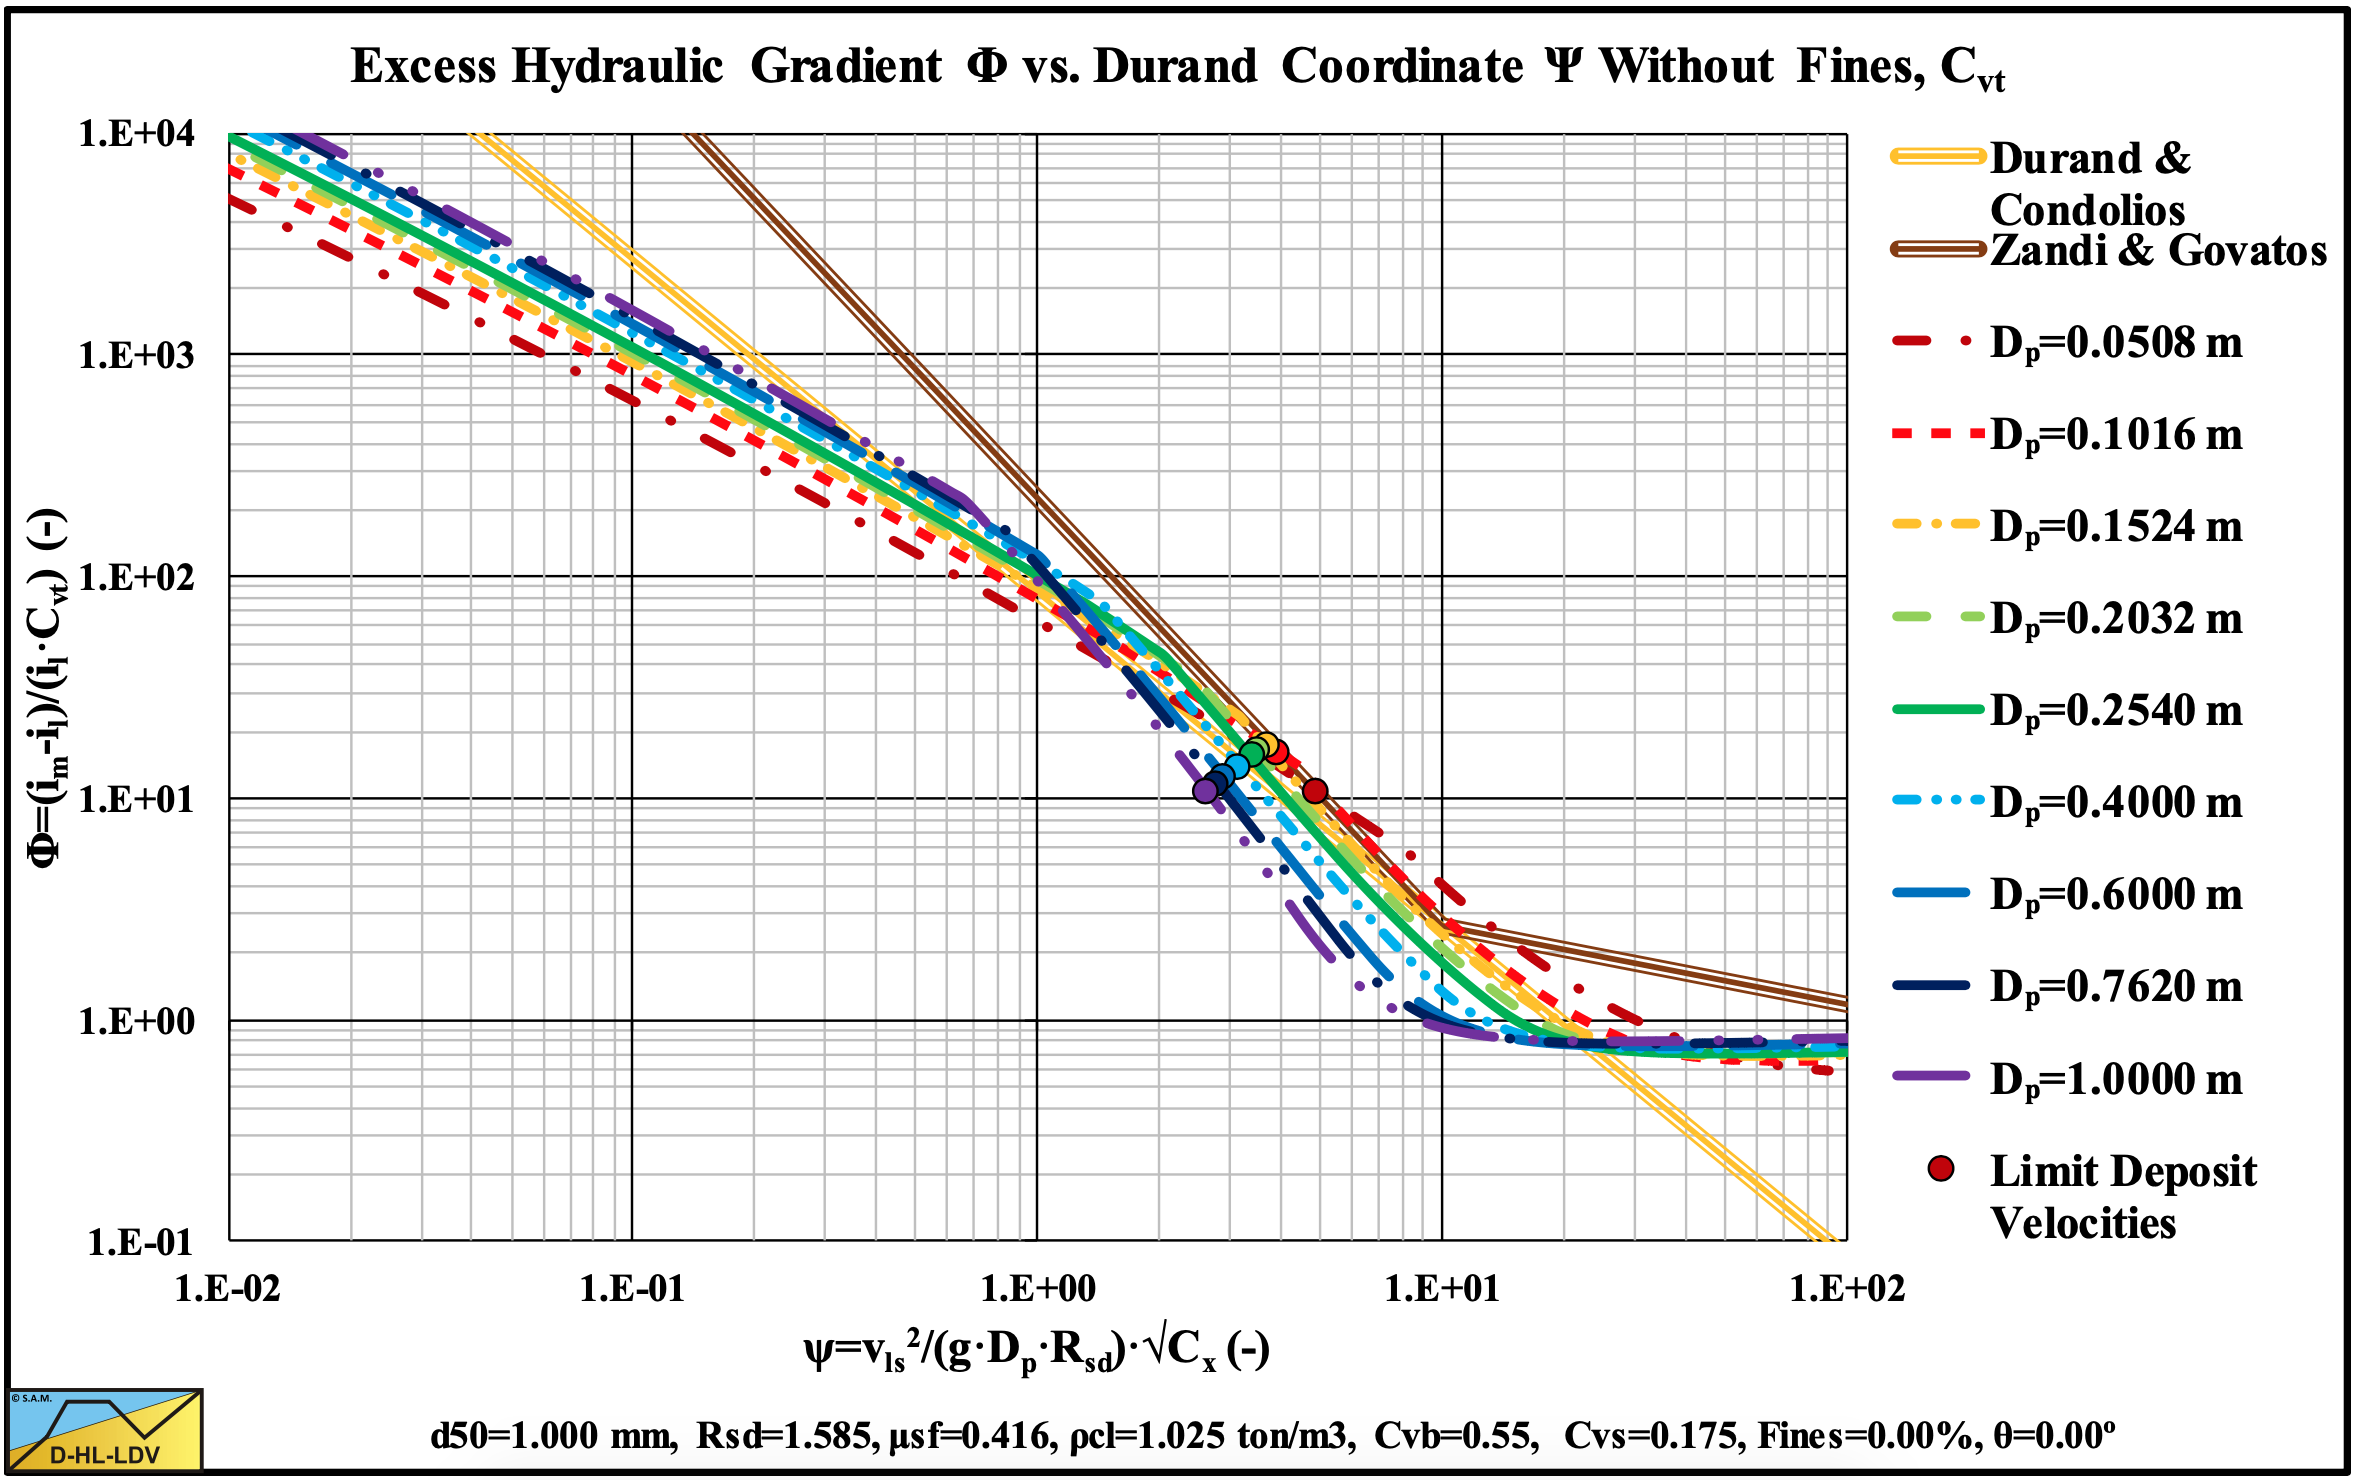
Figure 13.5-14: The hydraulic gradient on Durand coordinates for 9 particle diameters, Cvt.
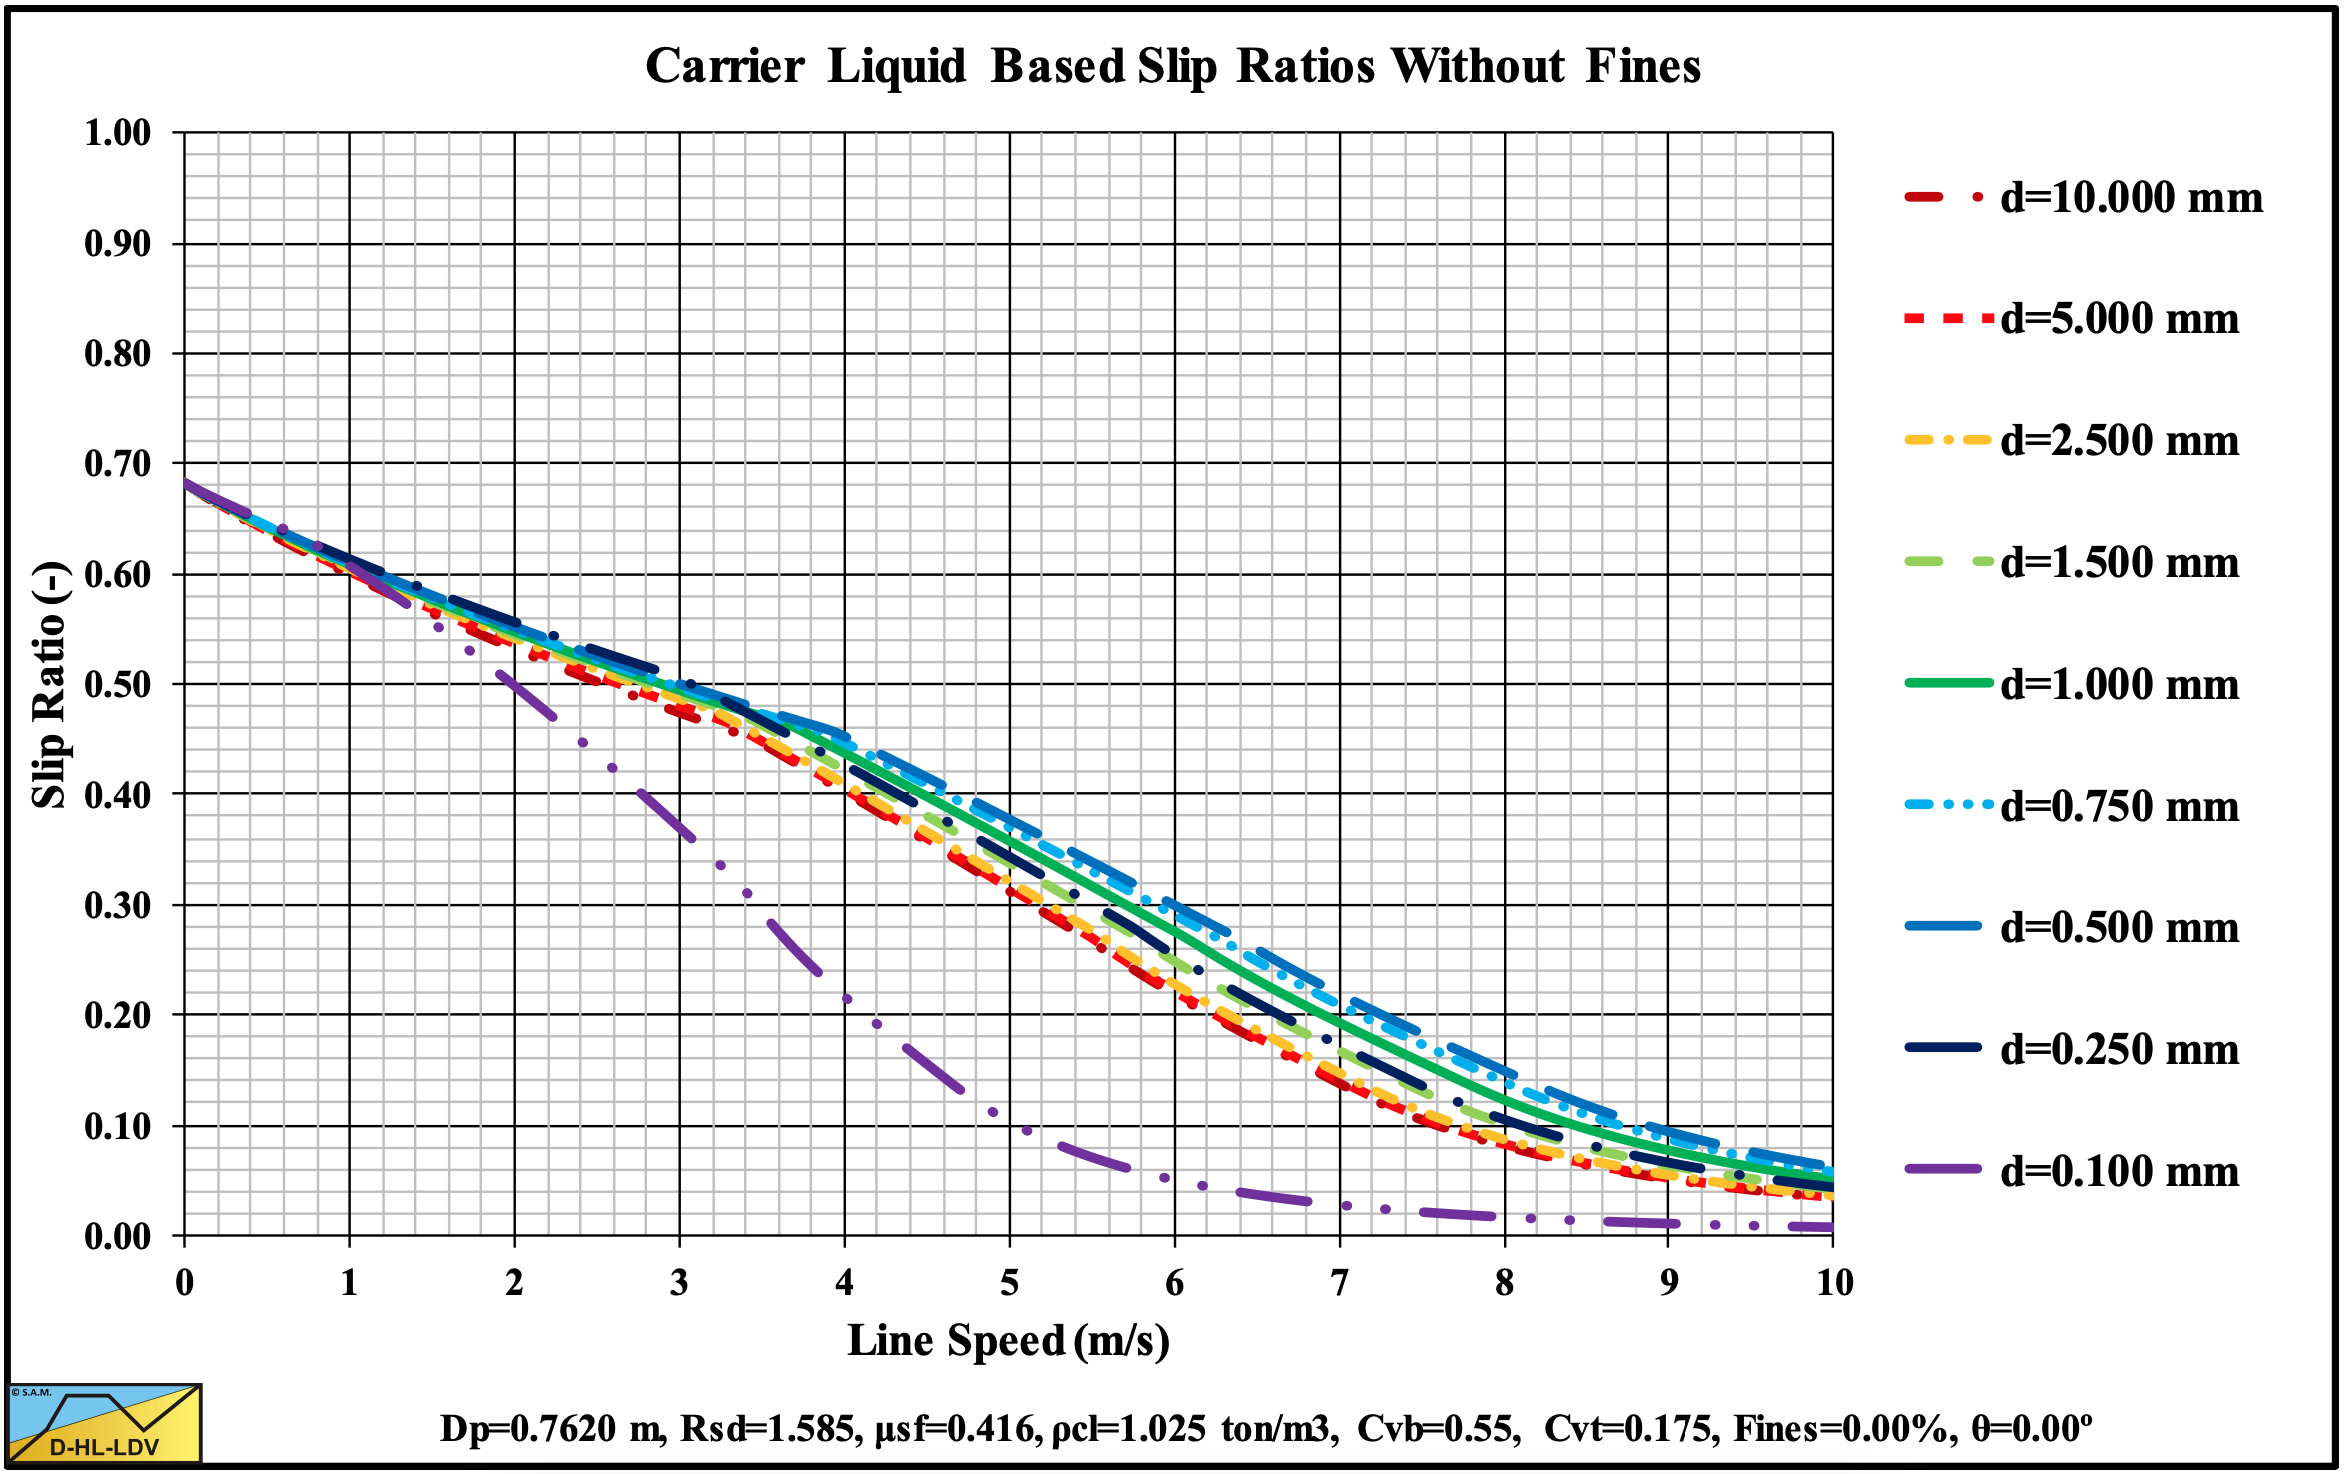
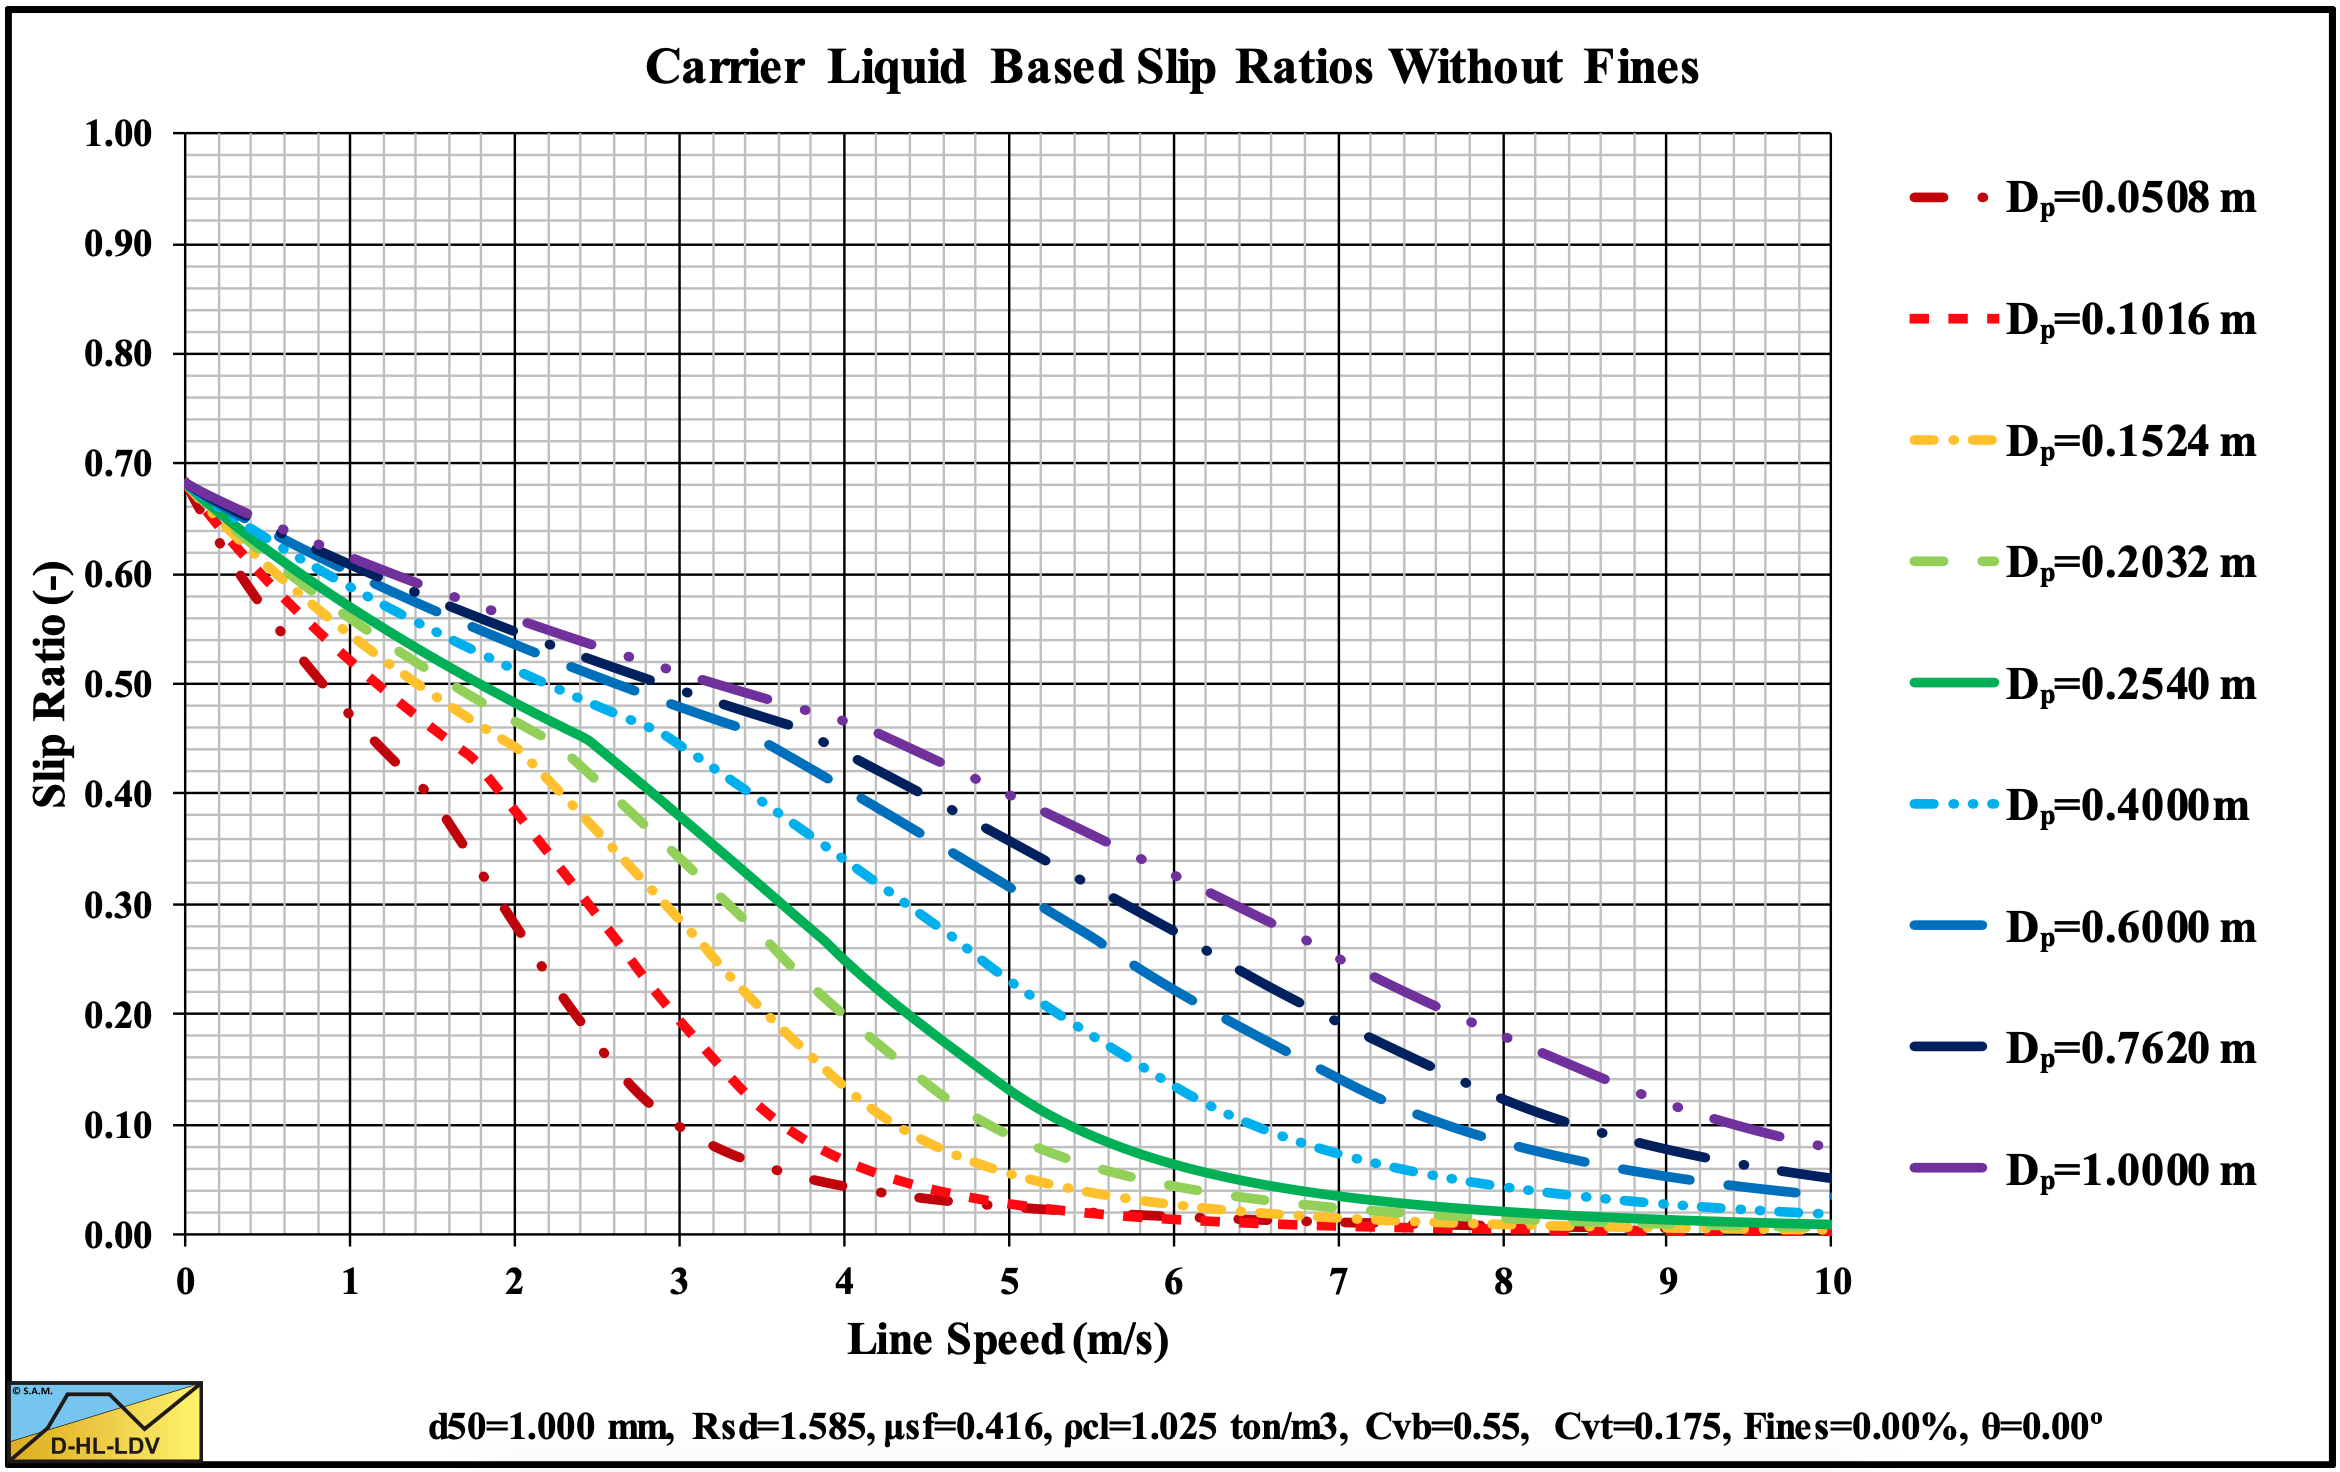
Figure 13.5-15: The slip ratio for 9 particle diameters.
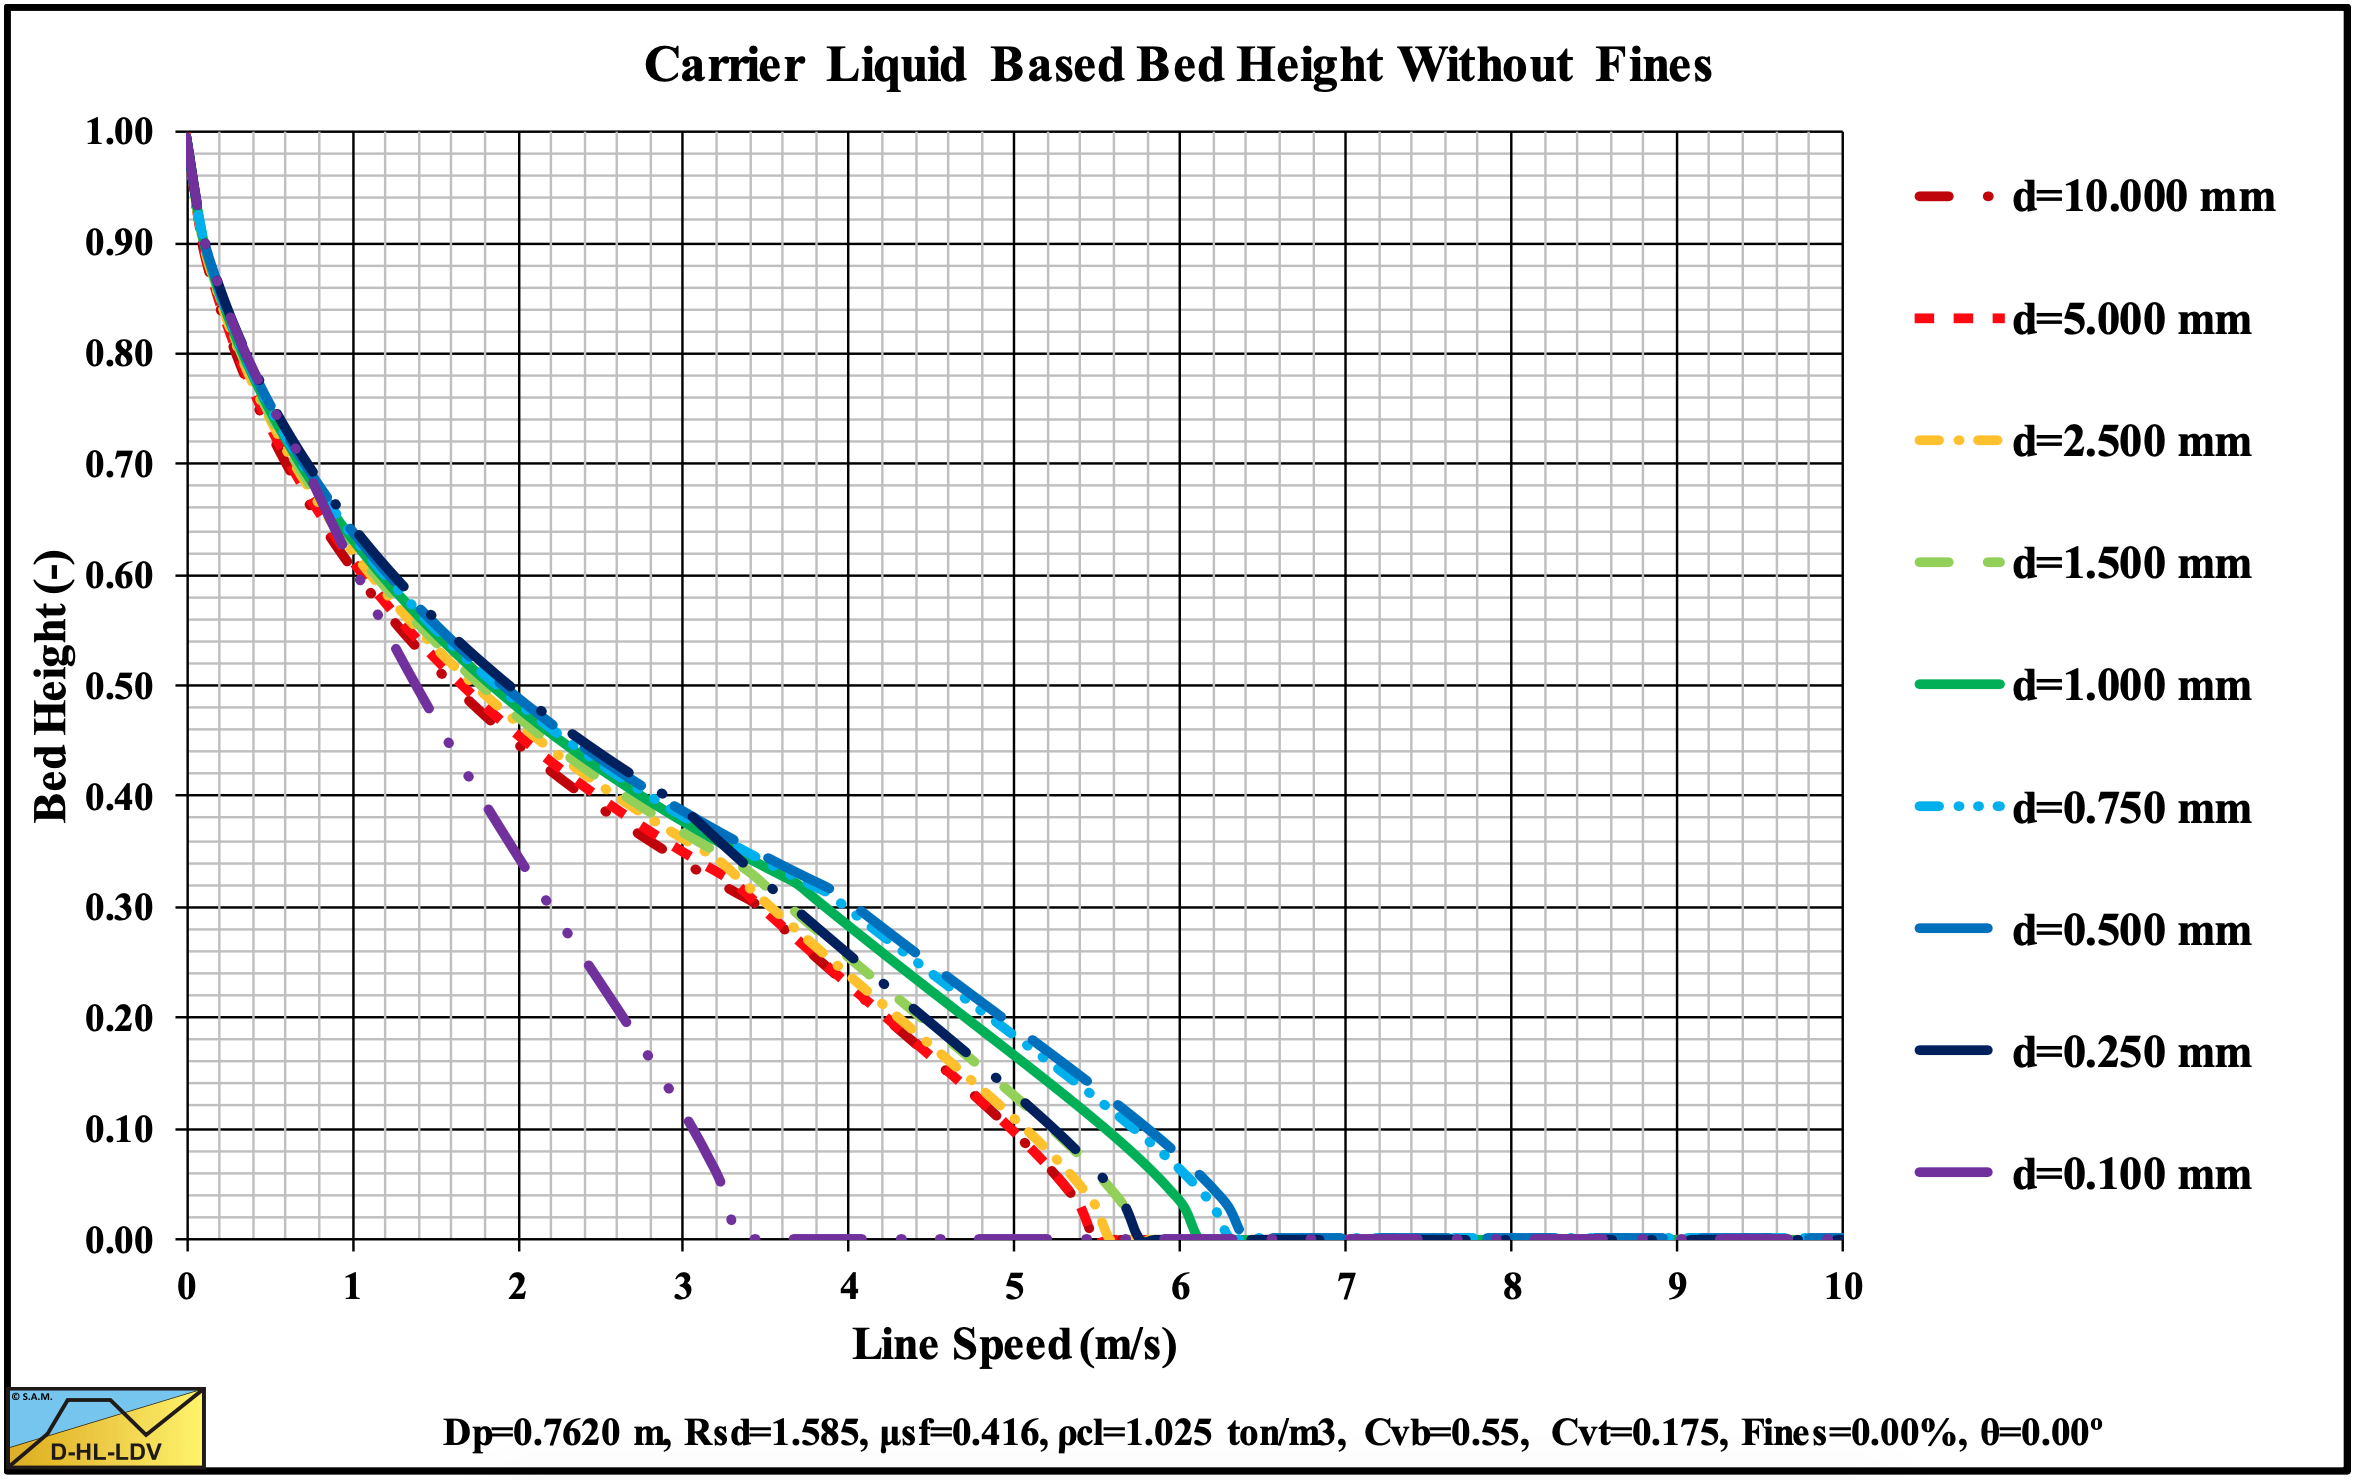
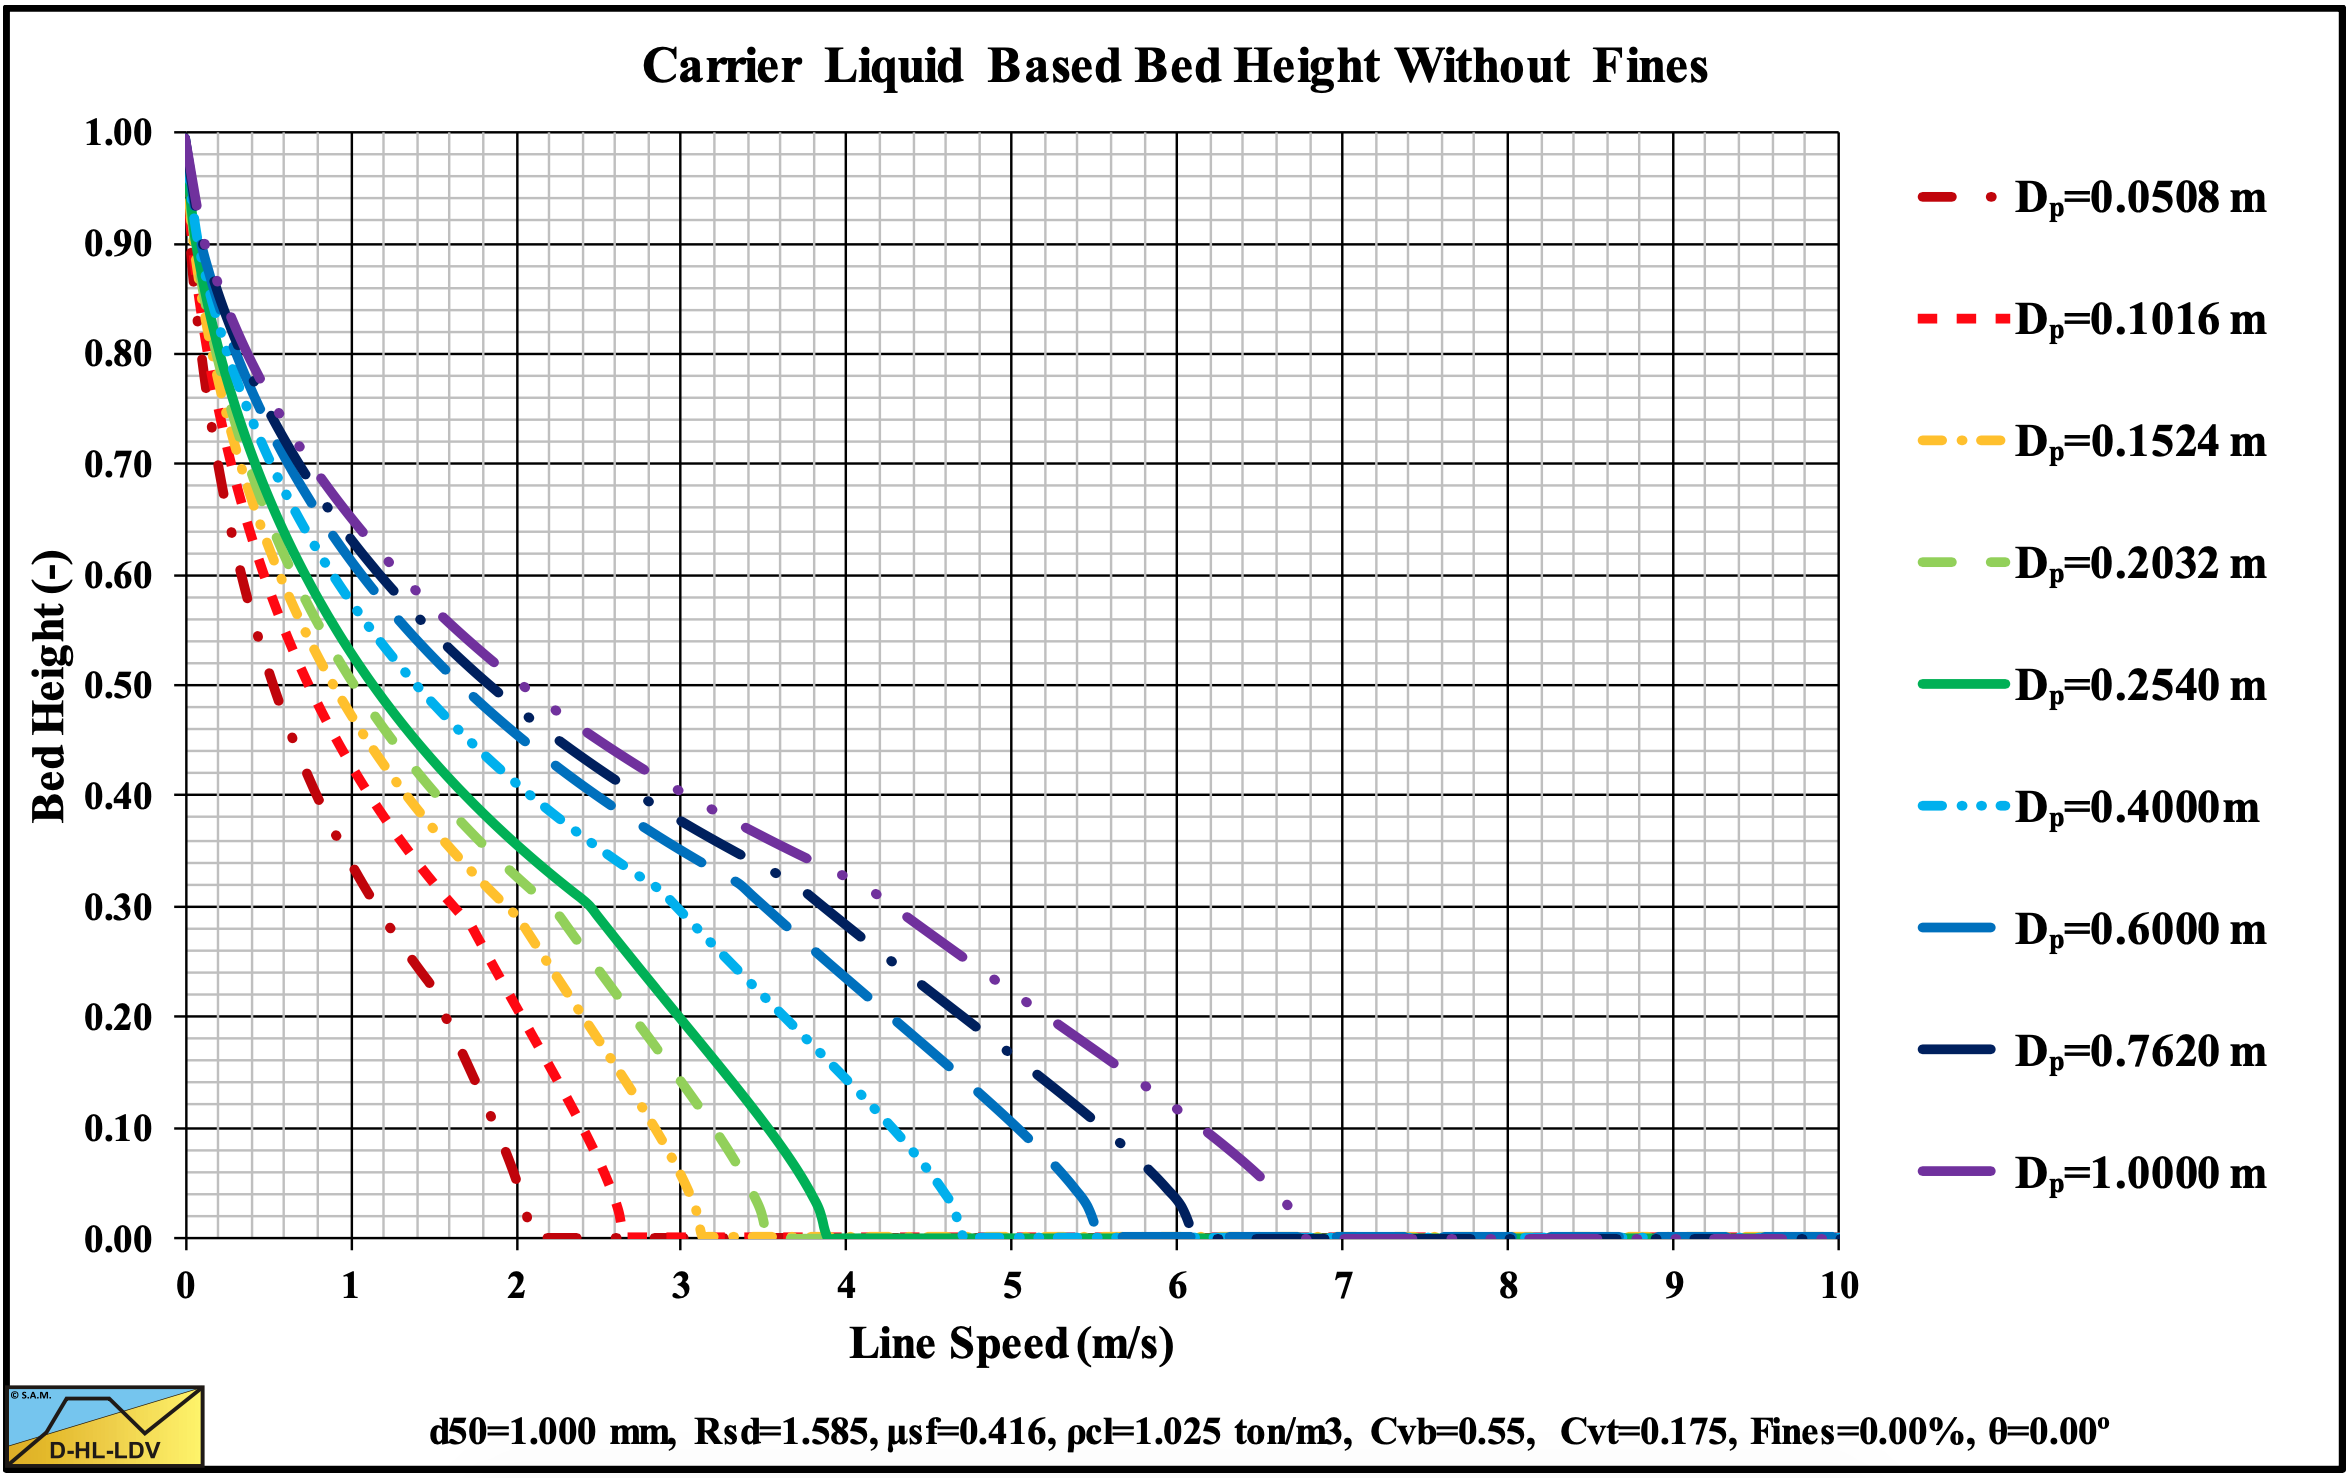
Figure 13.5-16: The bed height for 9 particle diameters.
13.5.3 9 Concentrations
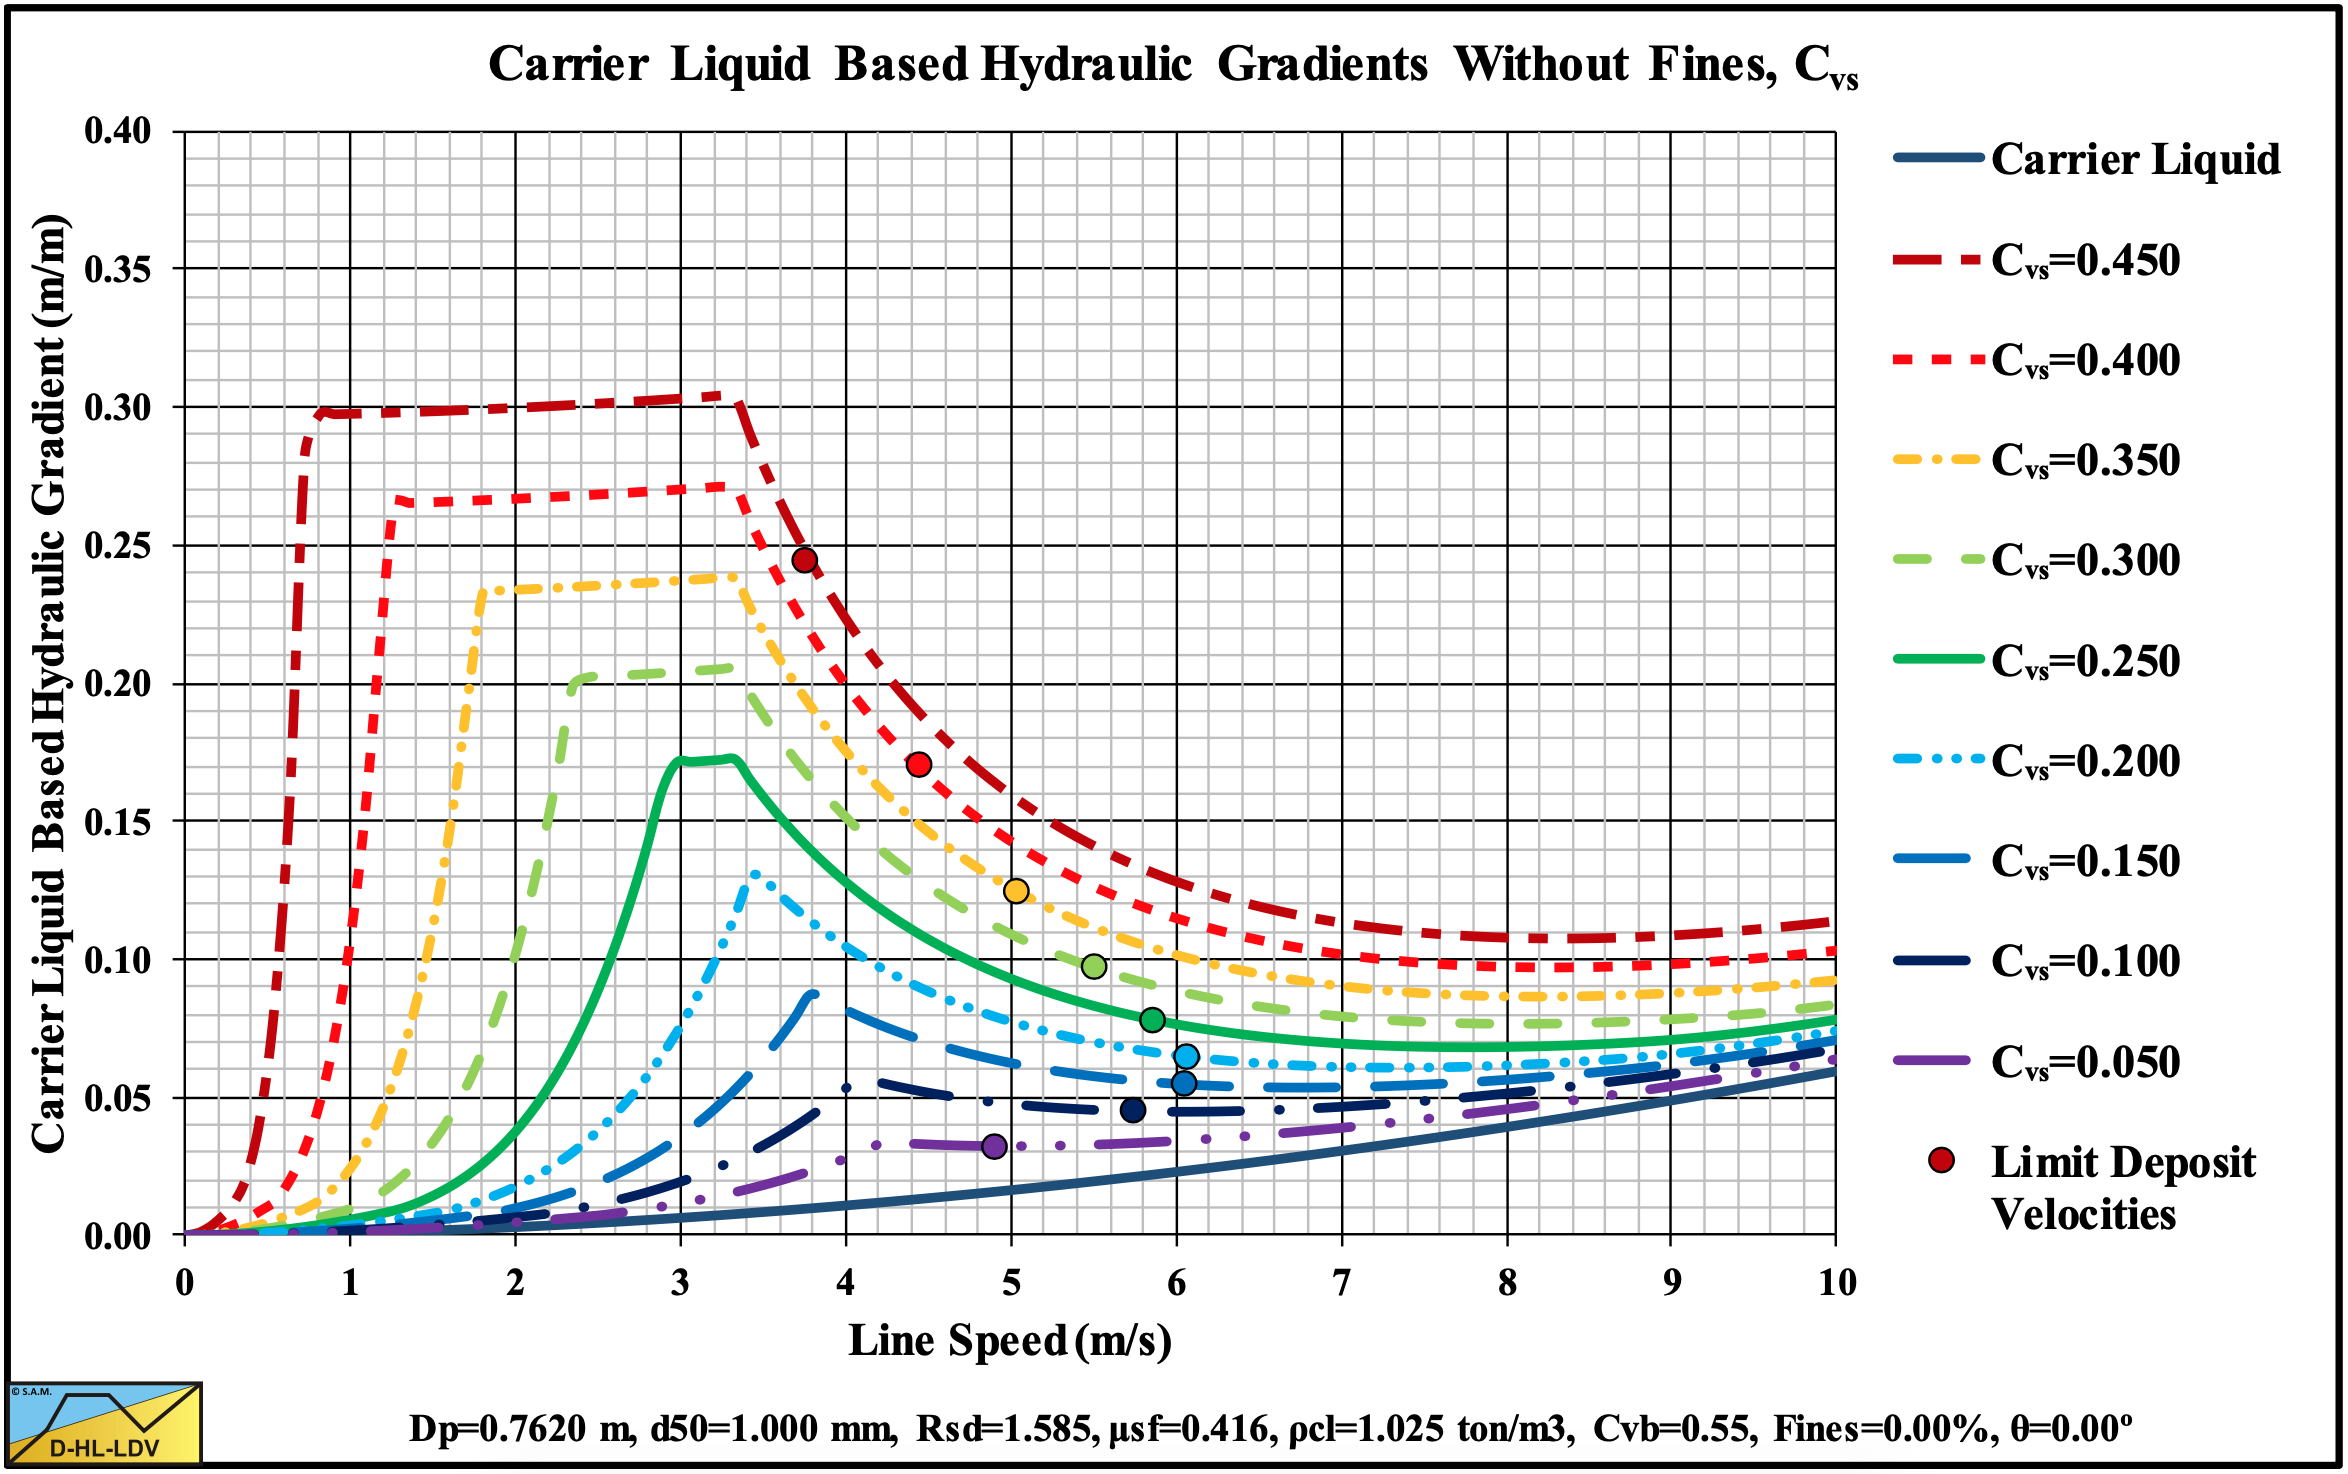
Figure 13.5-17: The hydraulic gradient versus the line speed for 9 concentrations, Cvs.
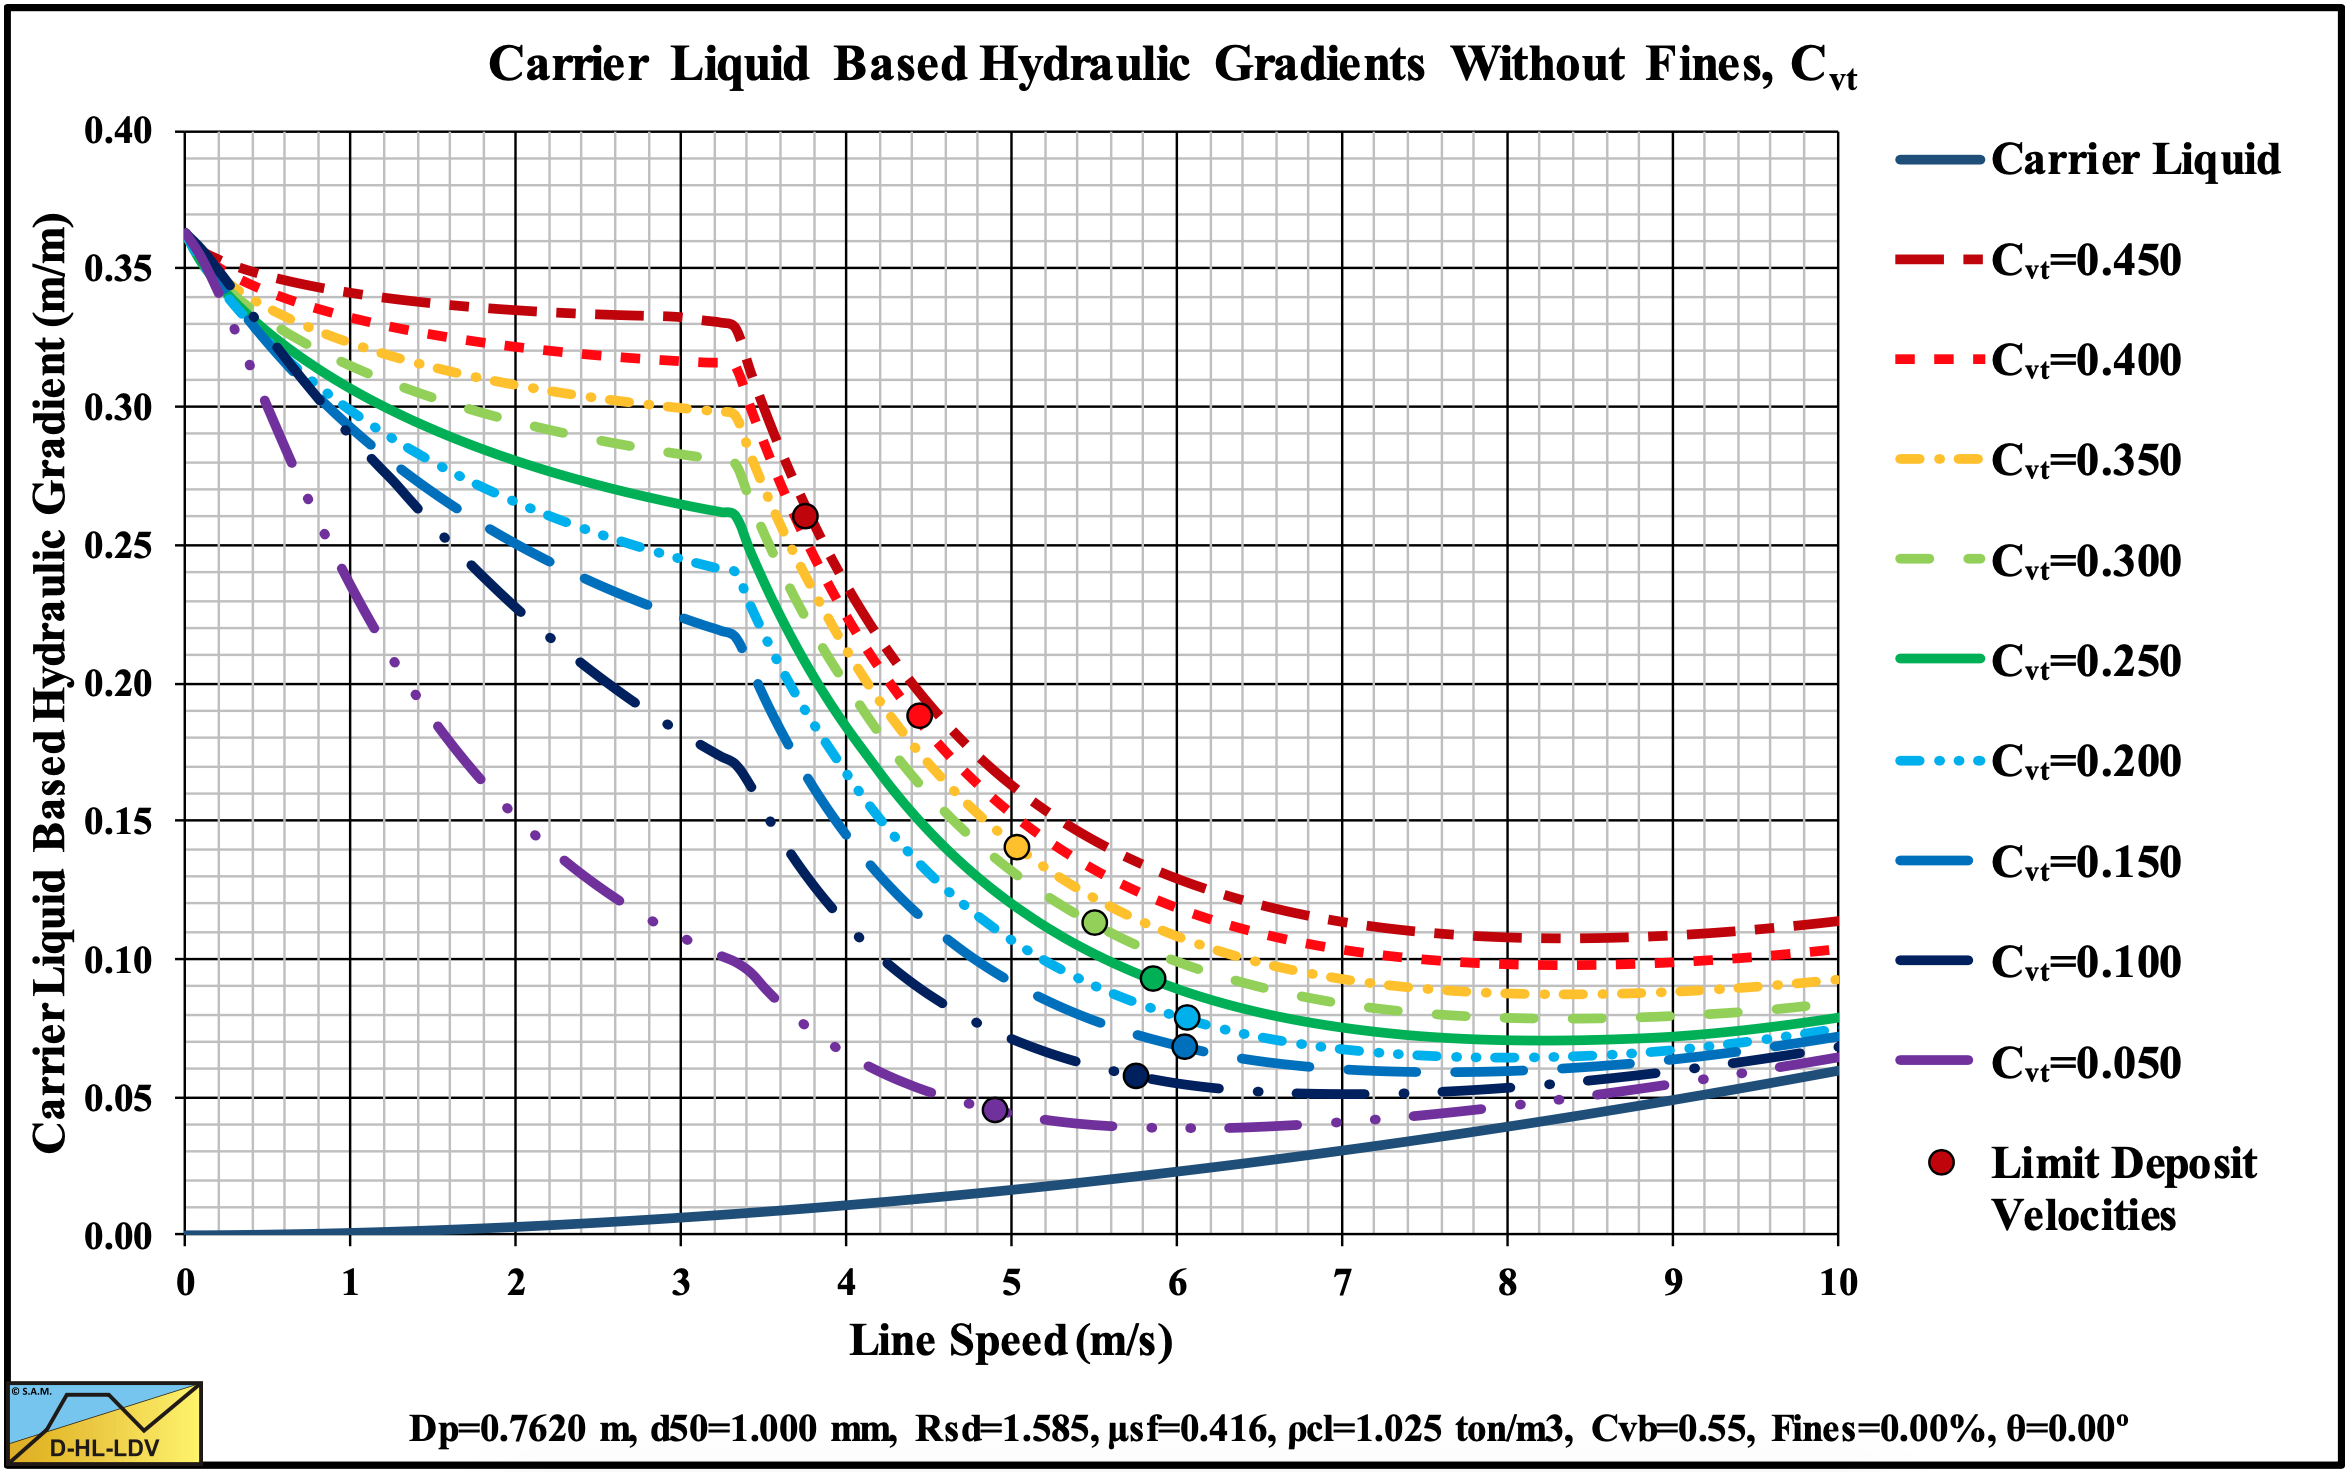
Figure 13.5-18: The hydraulic gradient versus the line speed for 9 concentrations, Cvt.
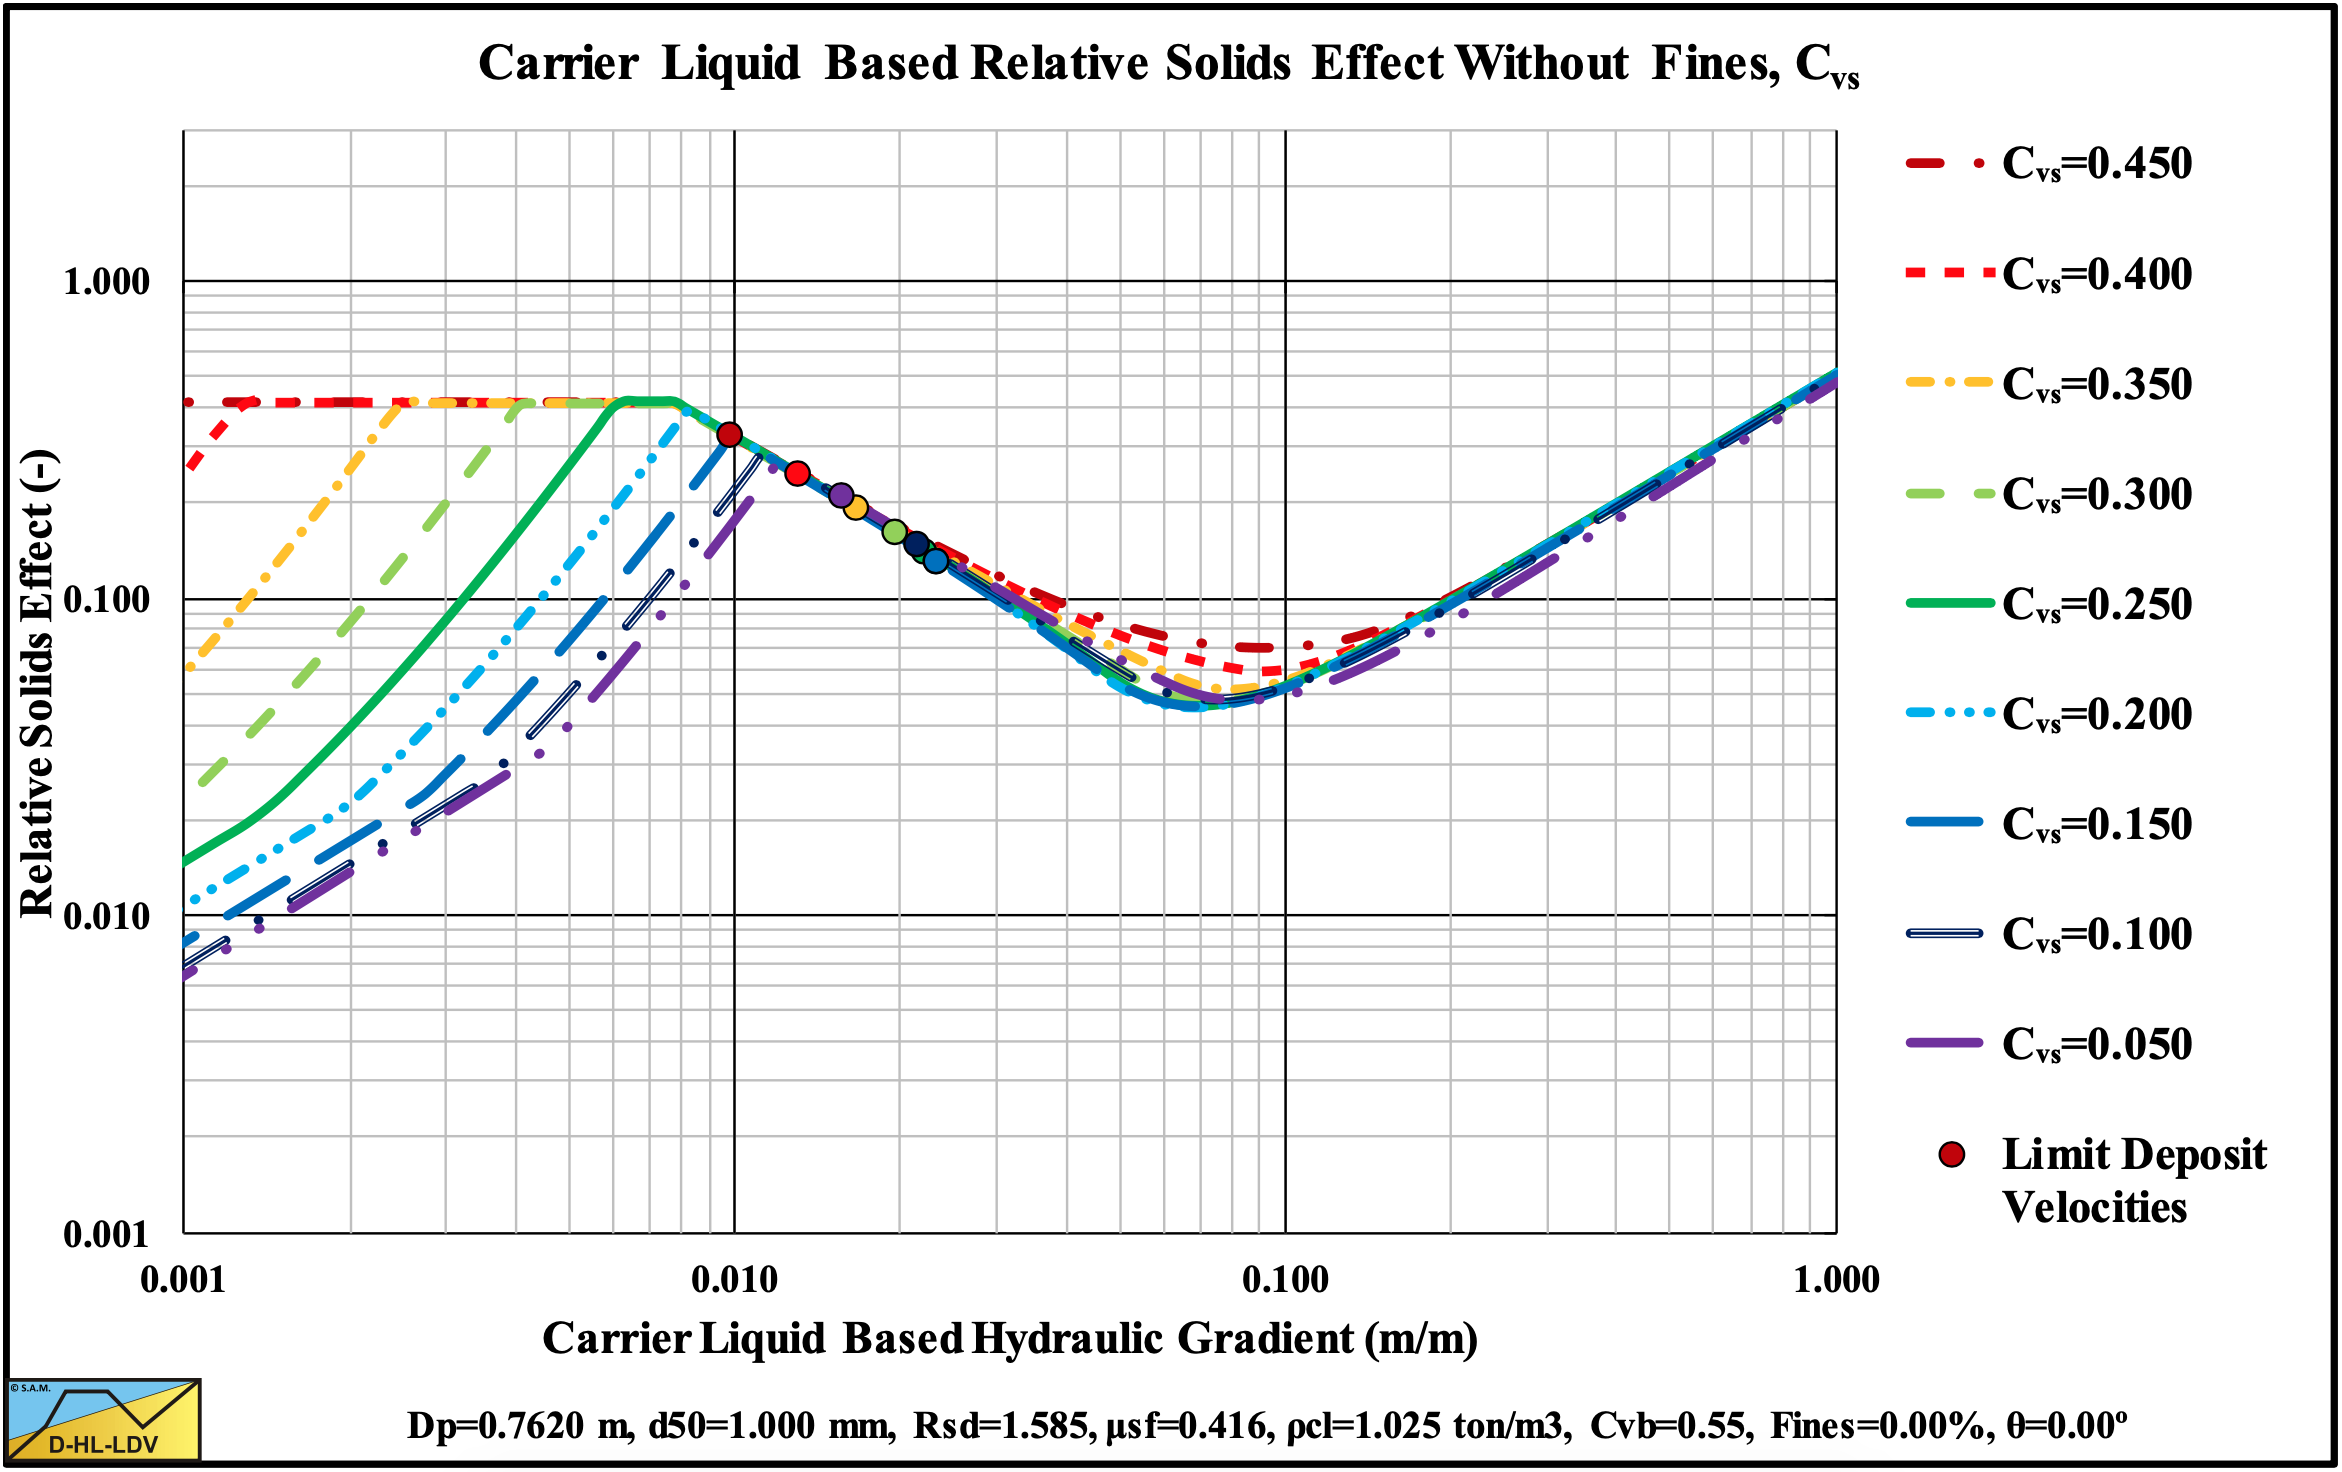
Figure 13.5-19: The relative excess hydraulic gradient versus the liquid hydraulic gradient for 9 concentrations, Cvs.
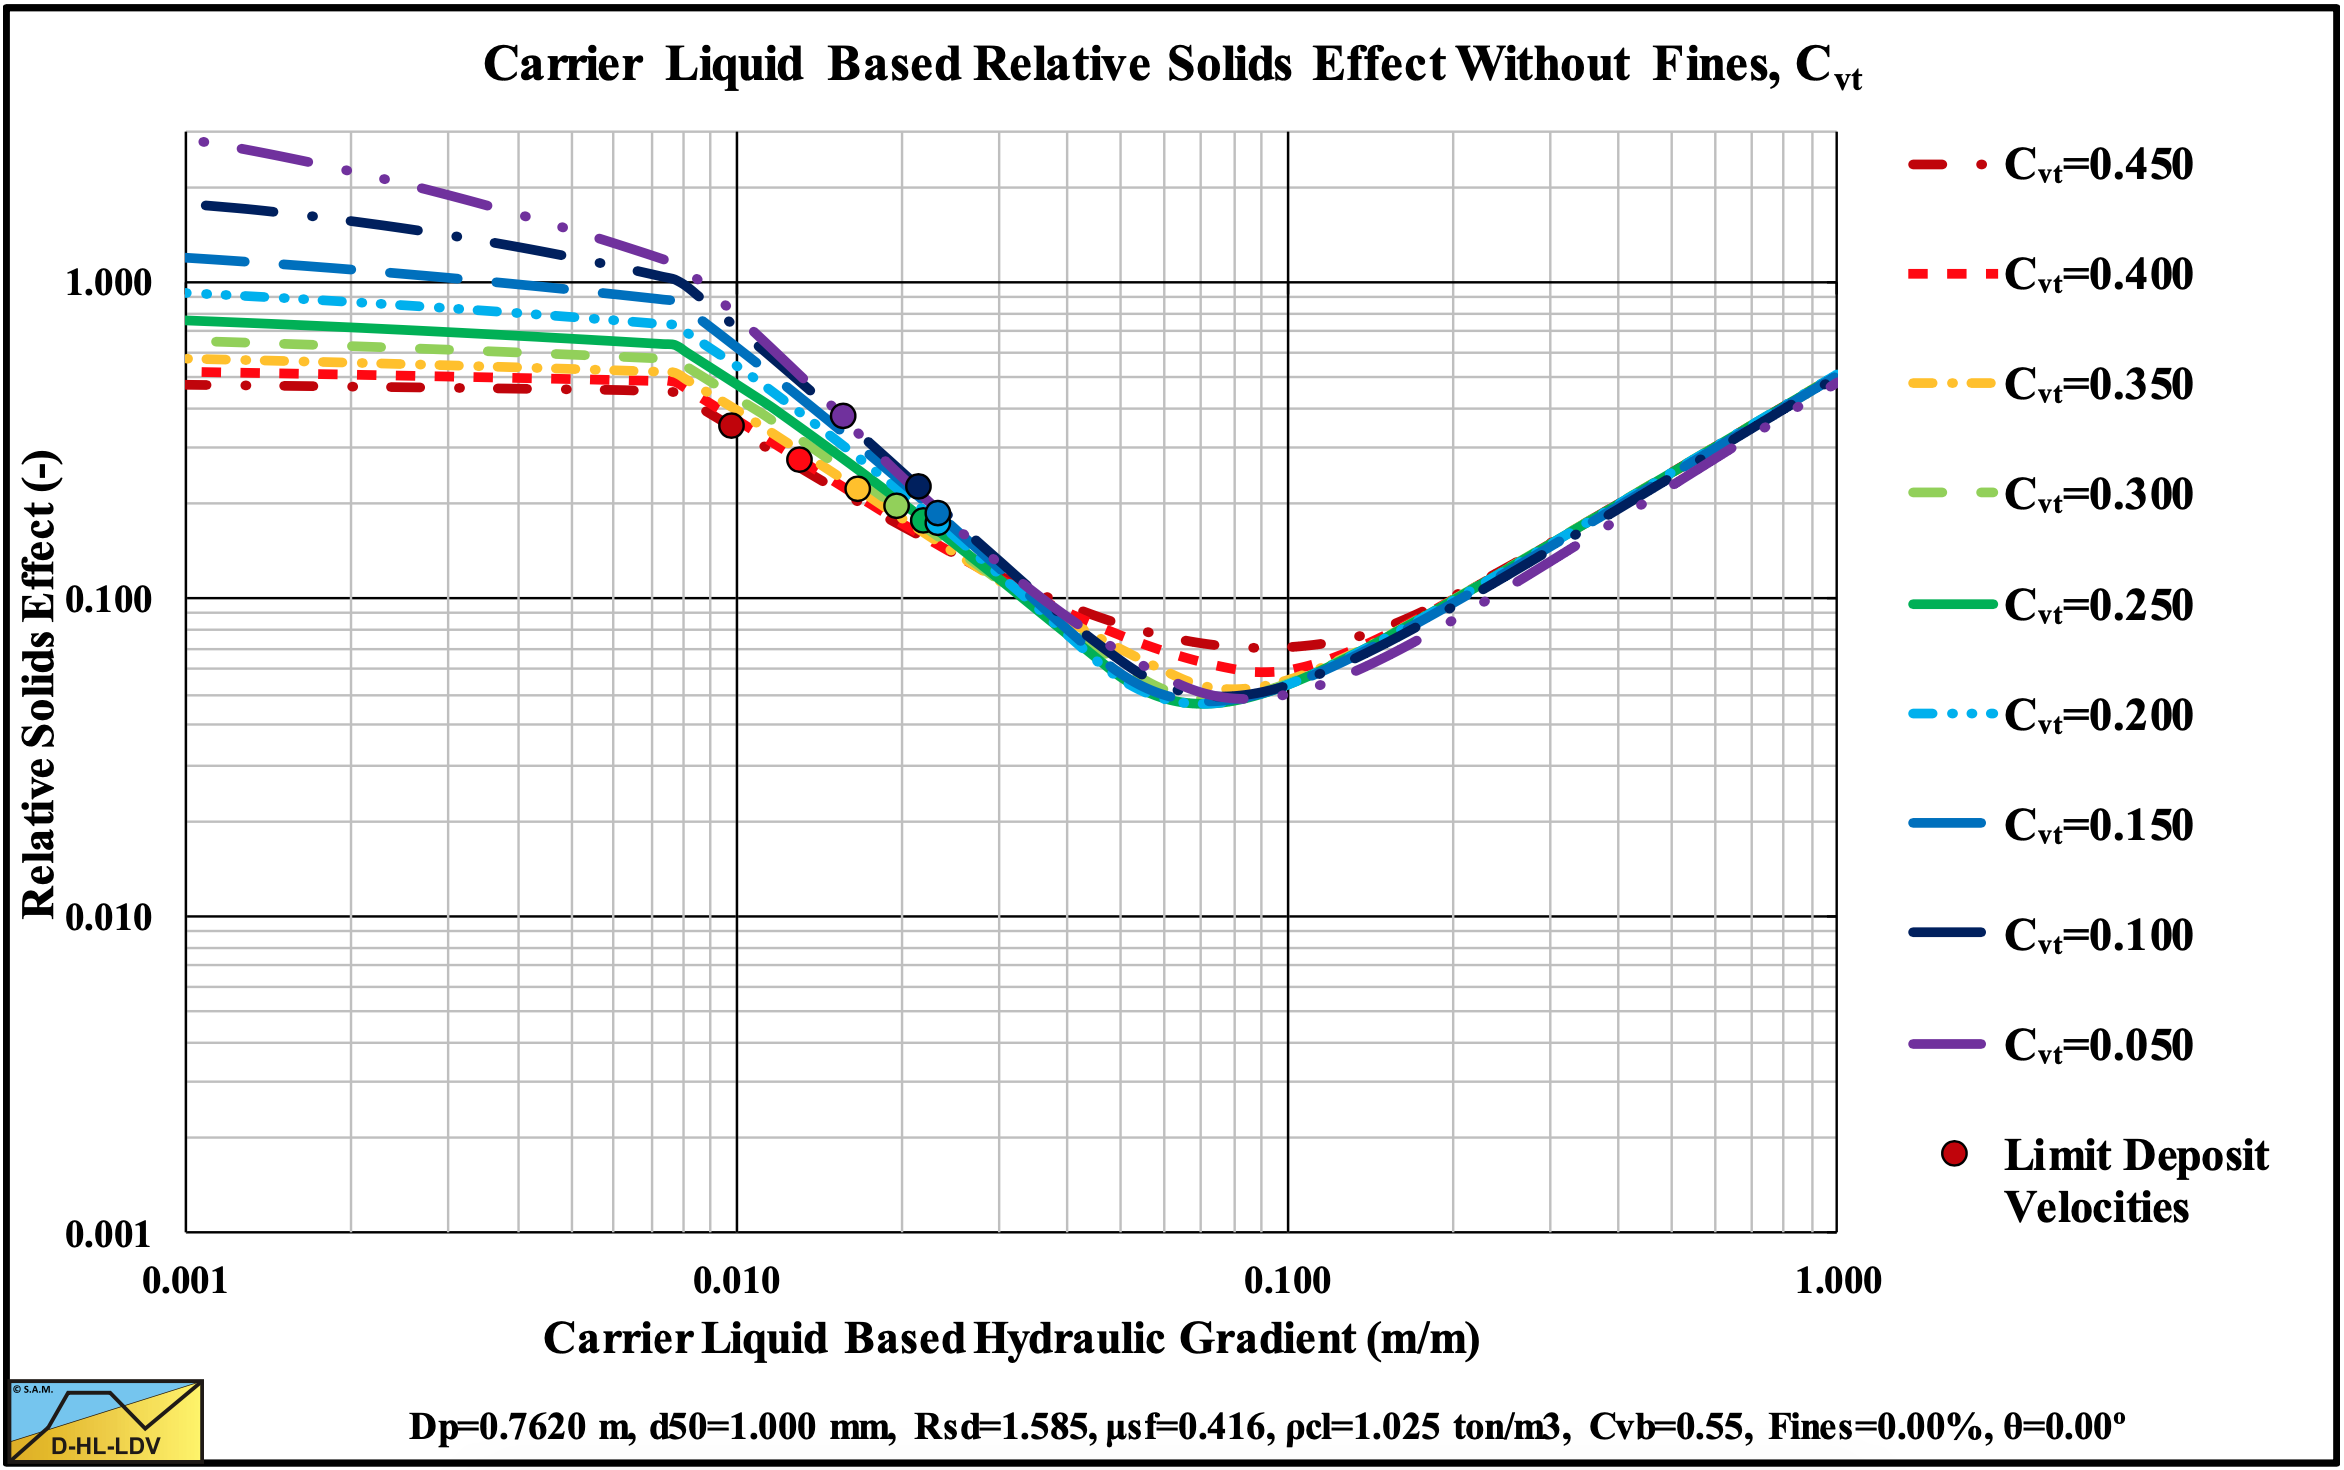
Figure 13.5-20: The relative excess hydraulic gradient versus the liquid hydraulic gradient for 9 concentrations, Cvt.
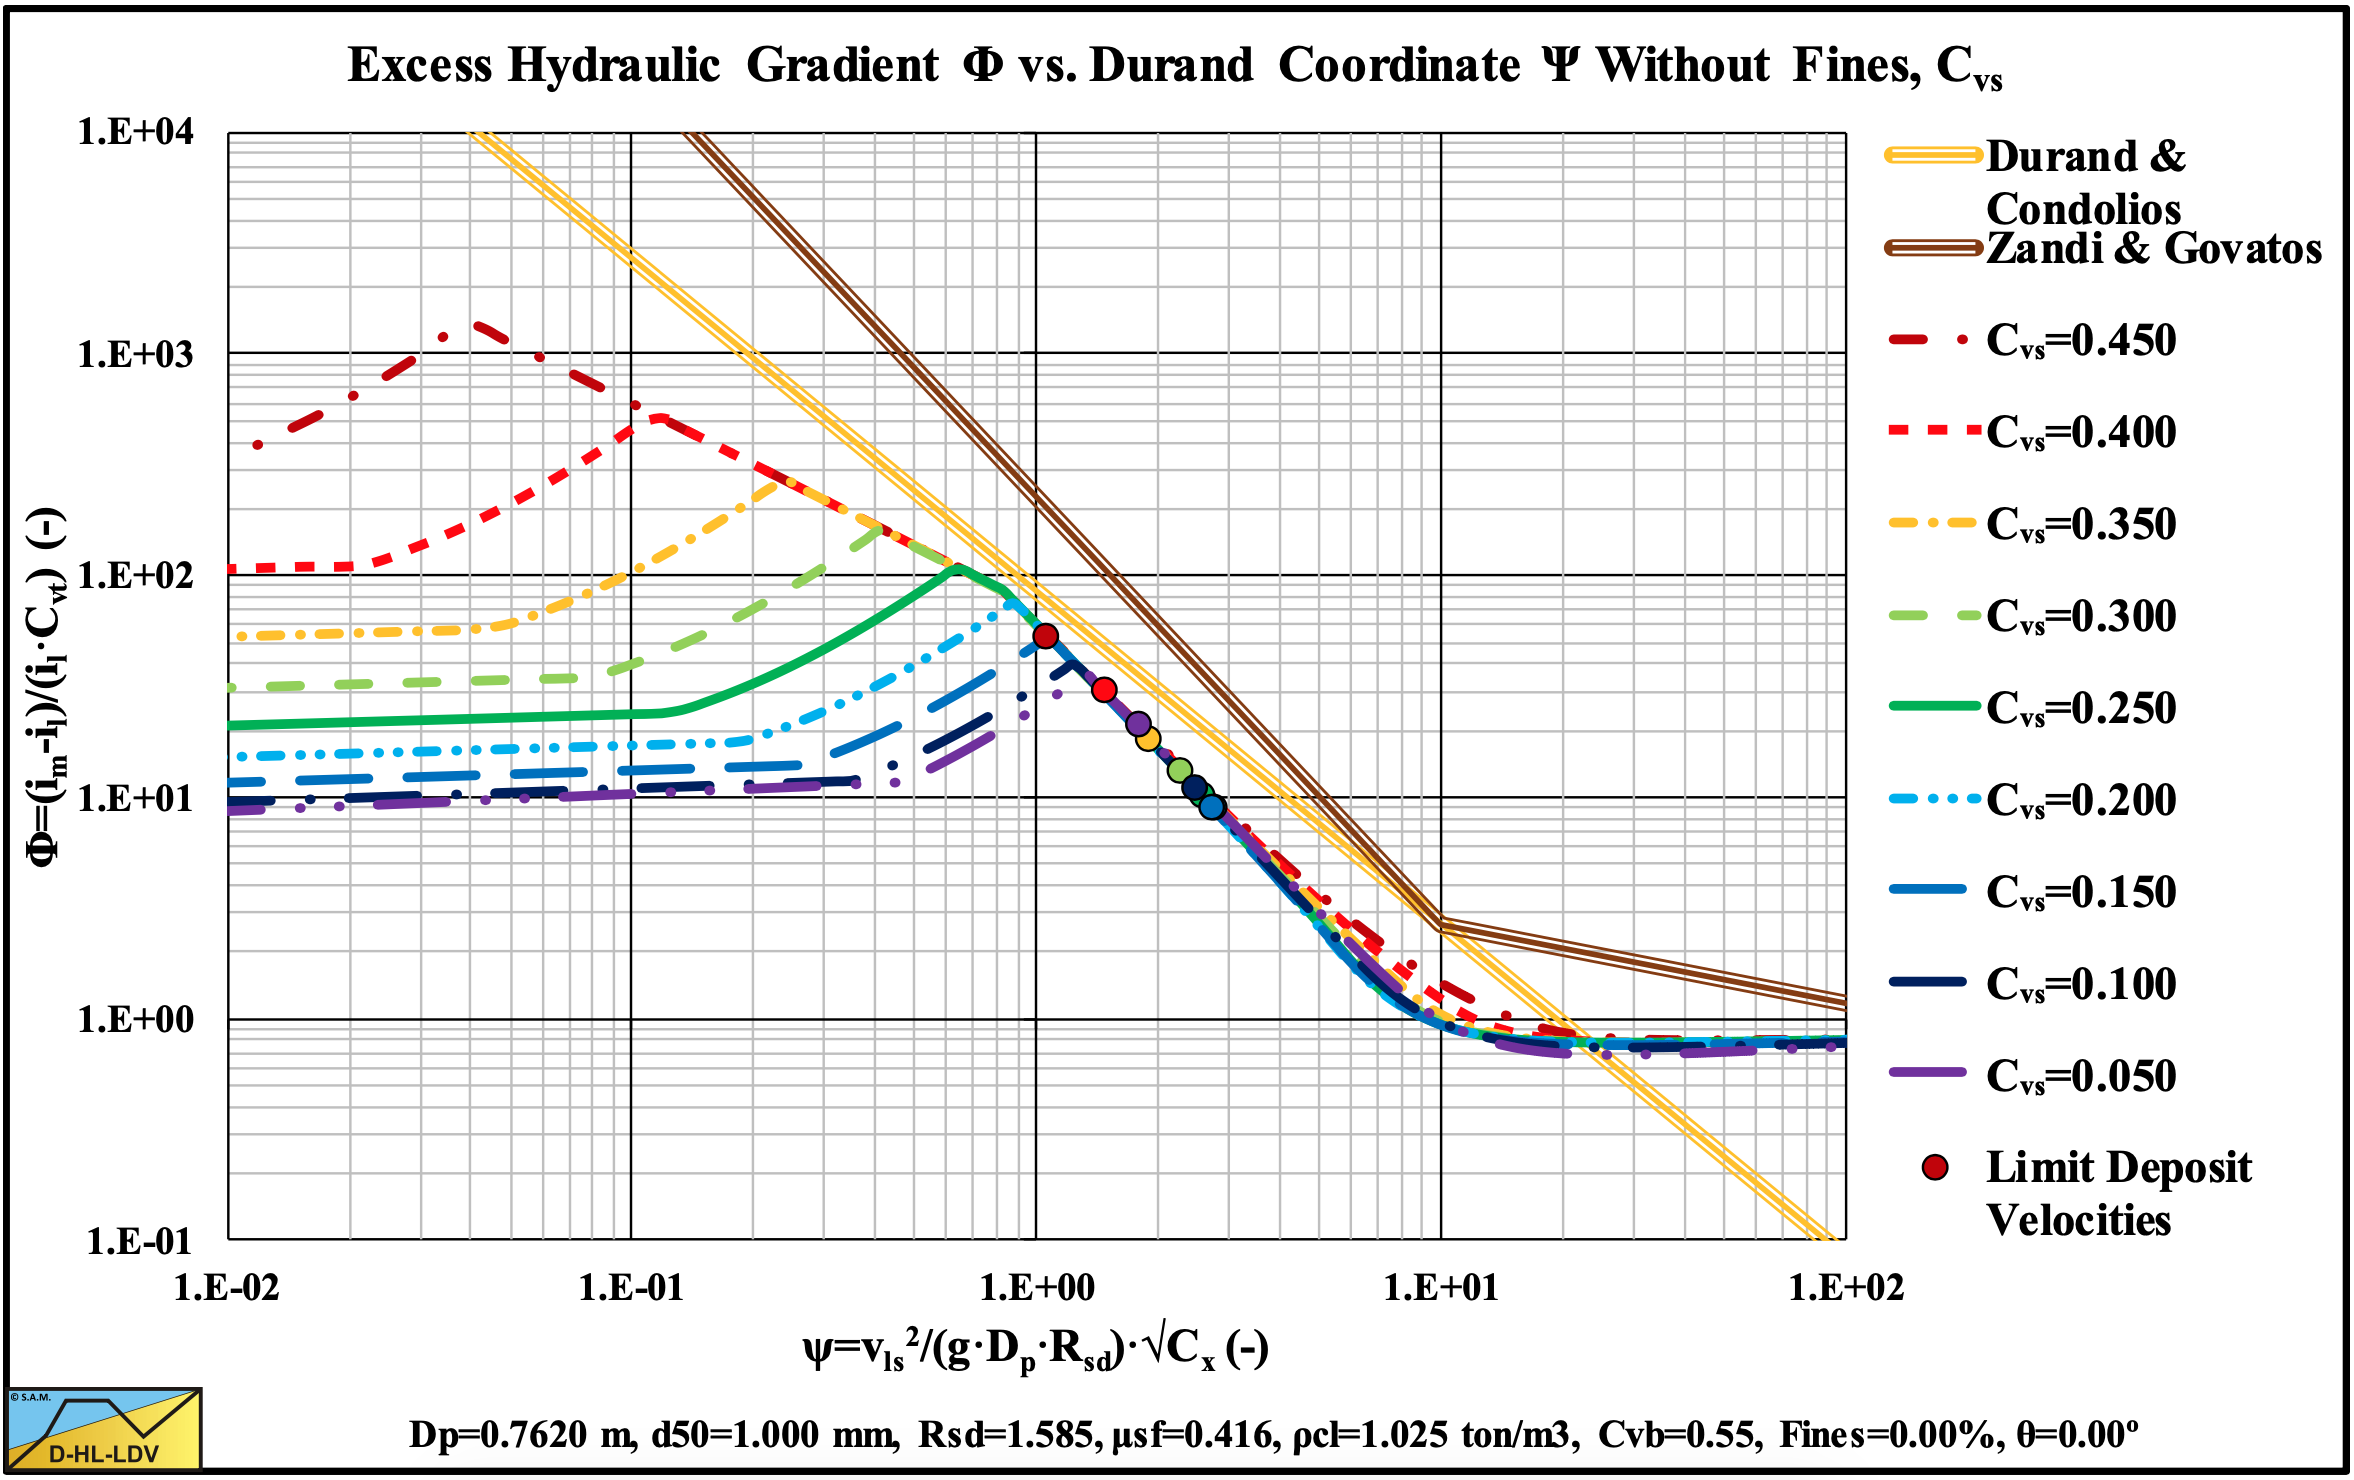
Figure 13.5-21: The hydraulic gradient on Durand coordinates for 9 concentrations, Cvs.
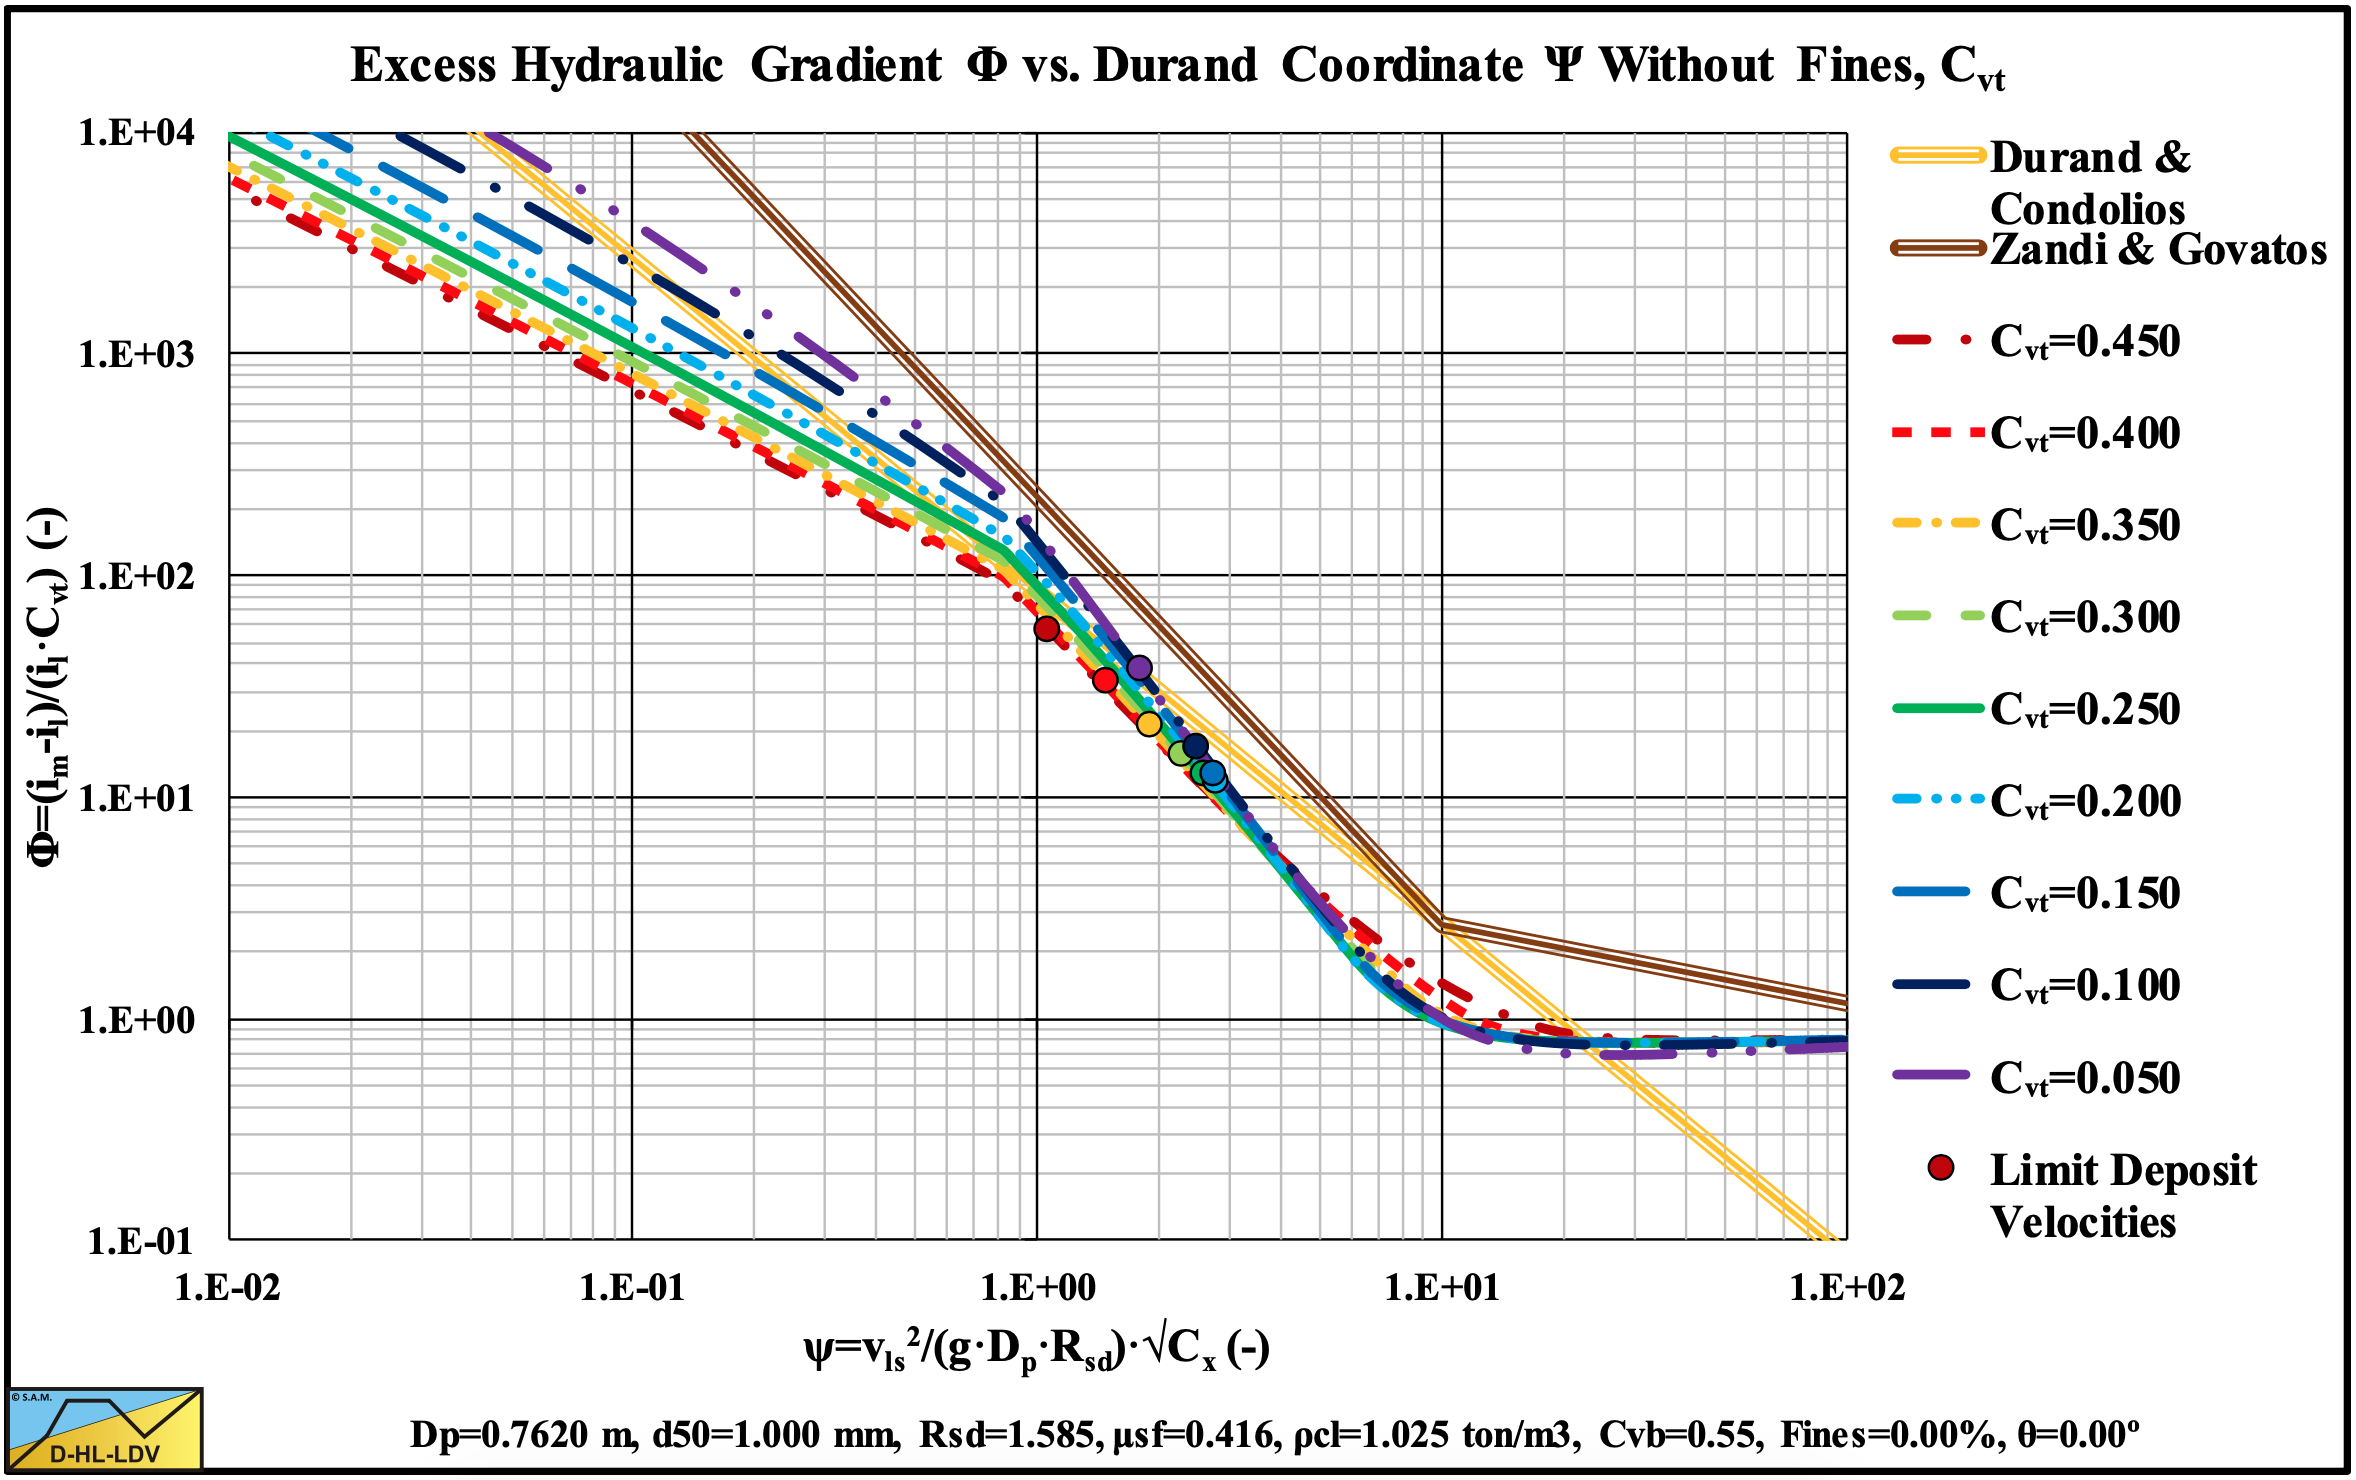
Figure 13.5-22: The hydraulic gradient on Durand coordinates for 9 concentrations, Cvt.
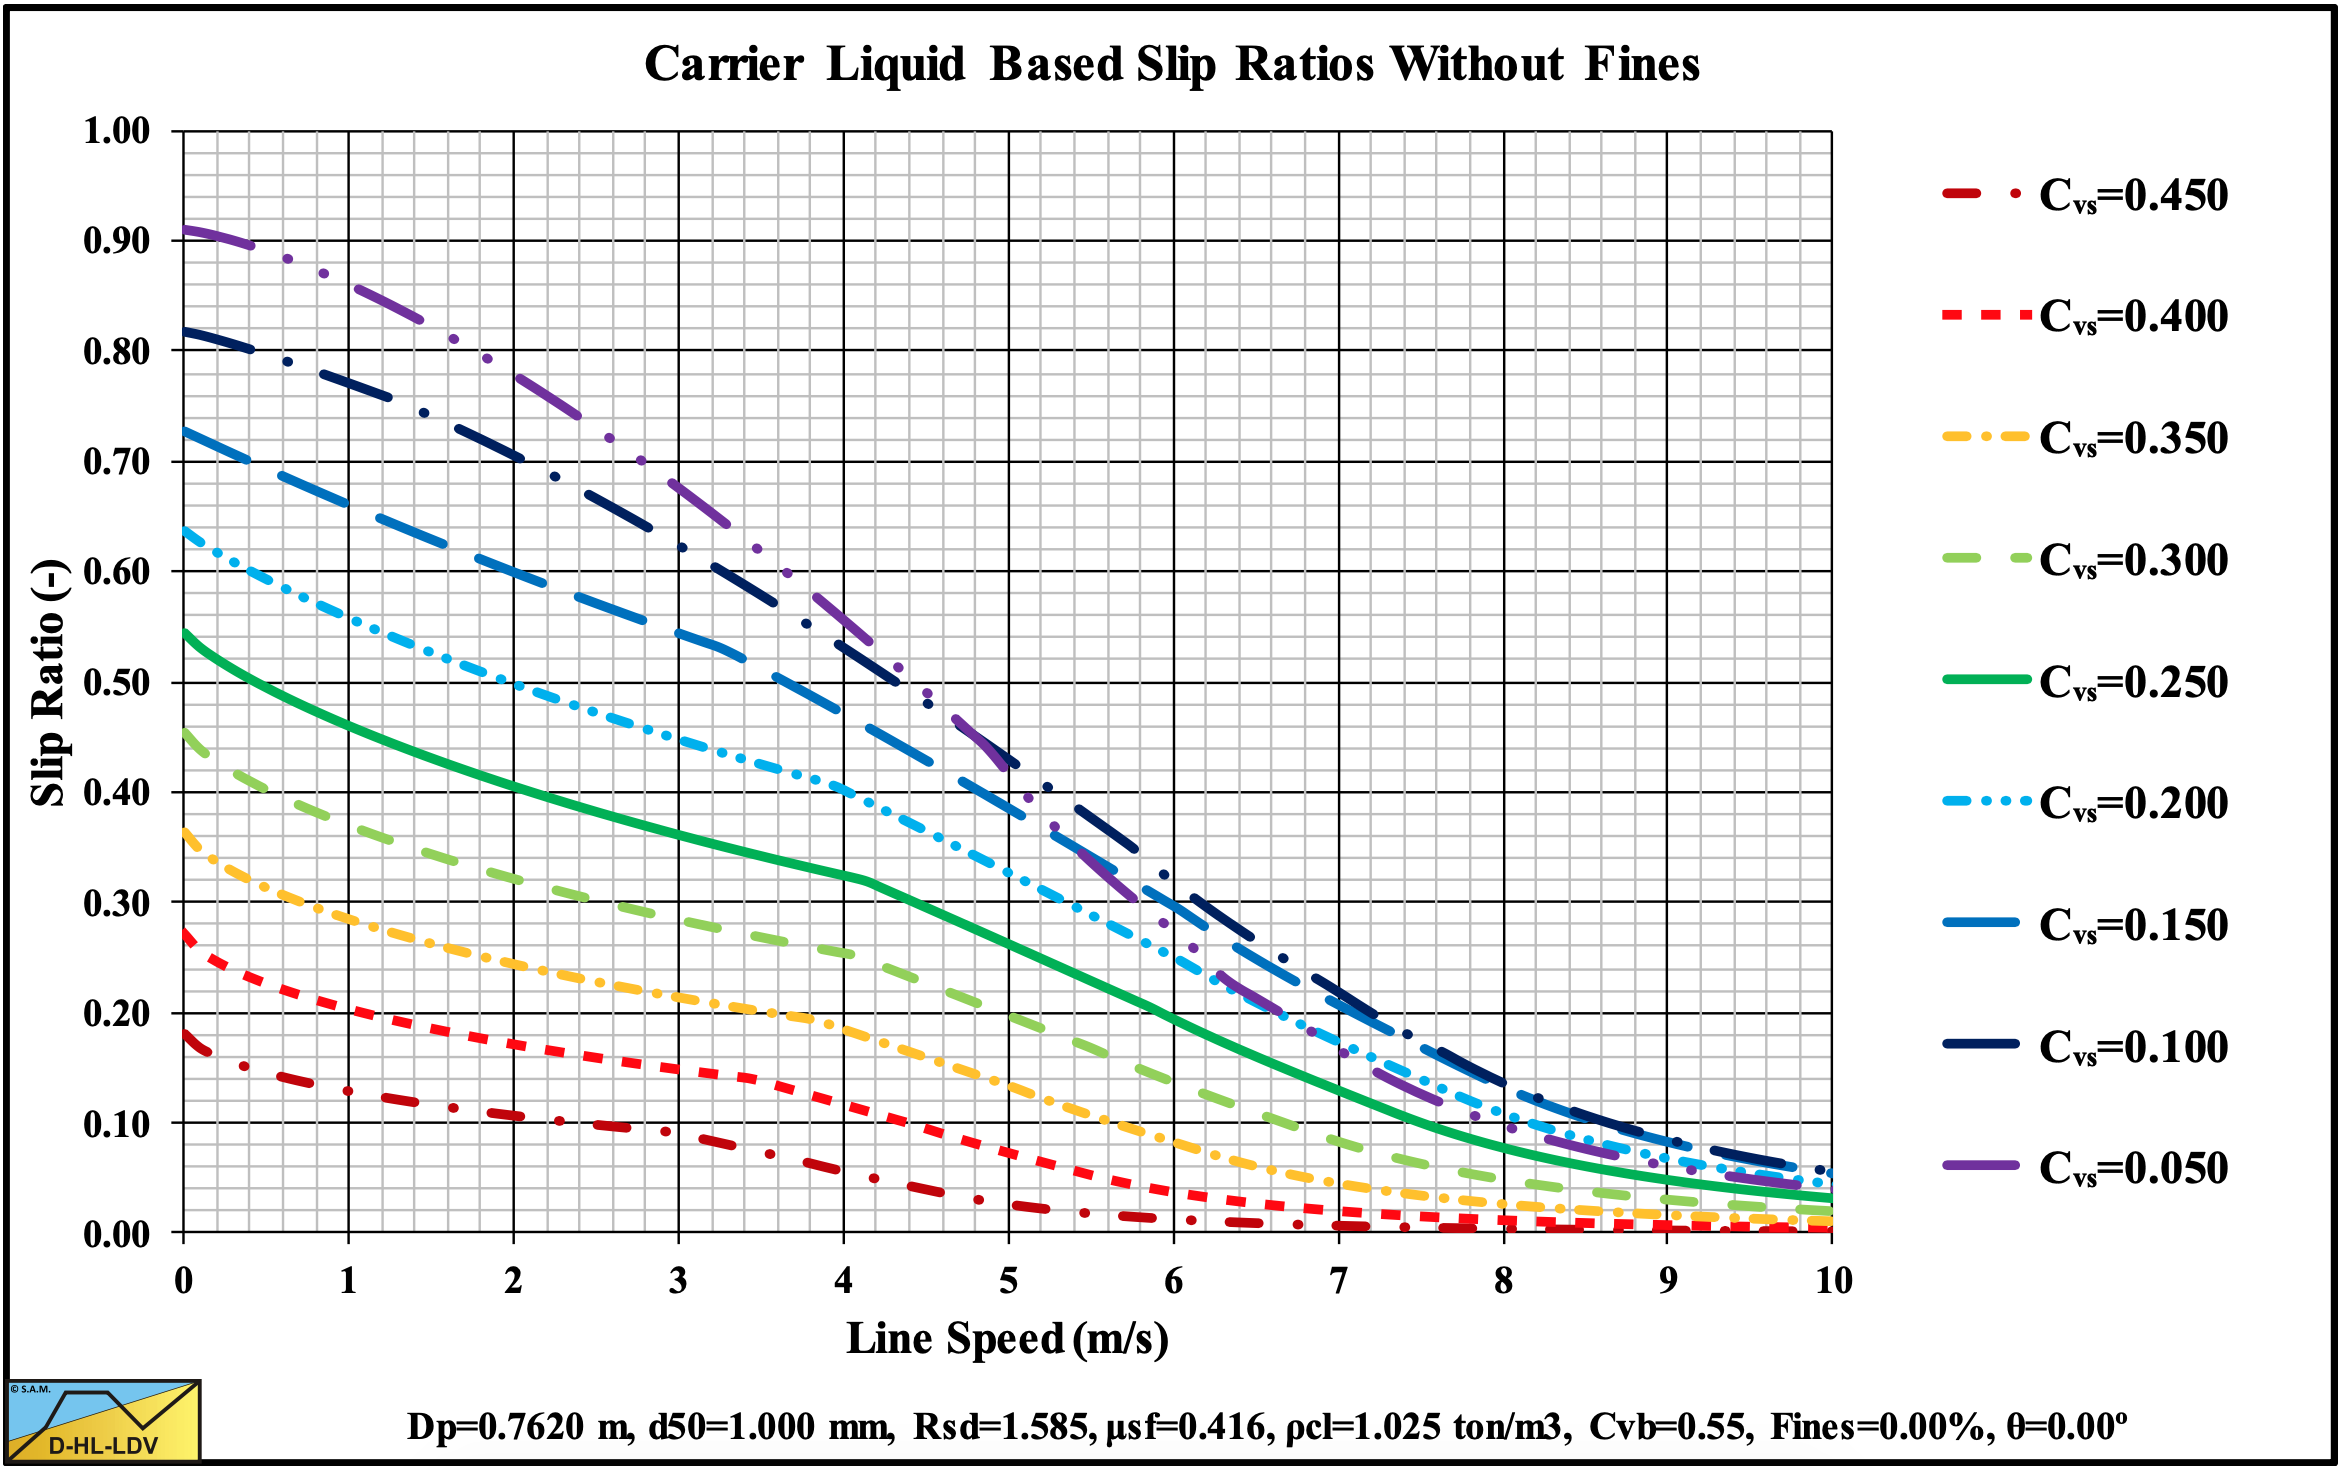
Figure 13.5-23: The slip ratio for 9 concentrations.
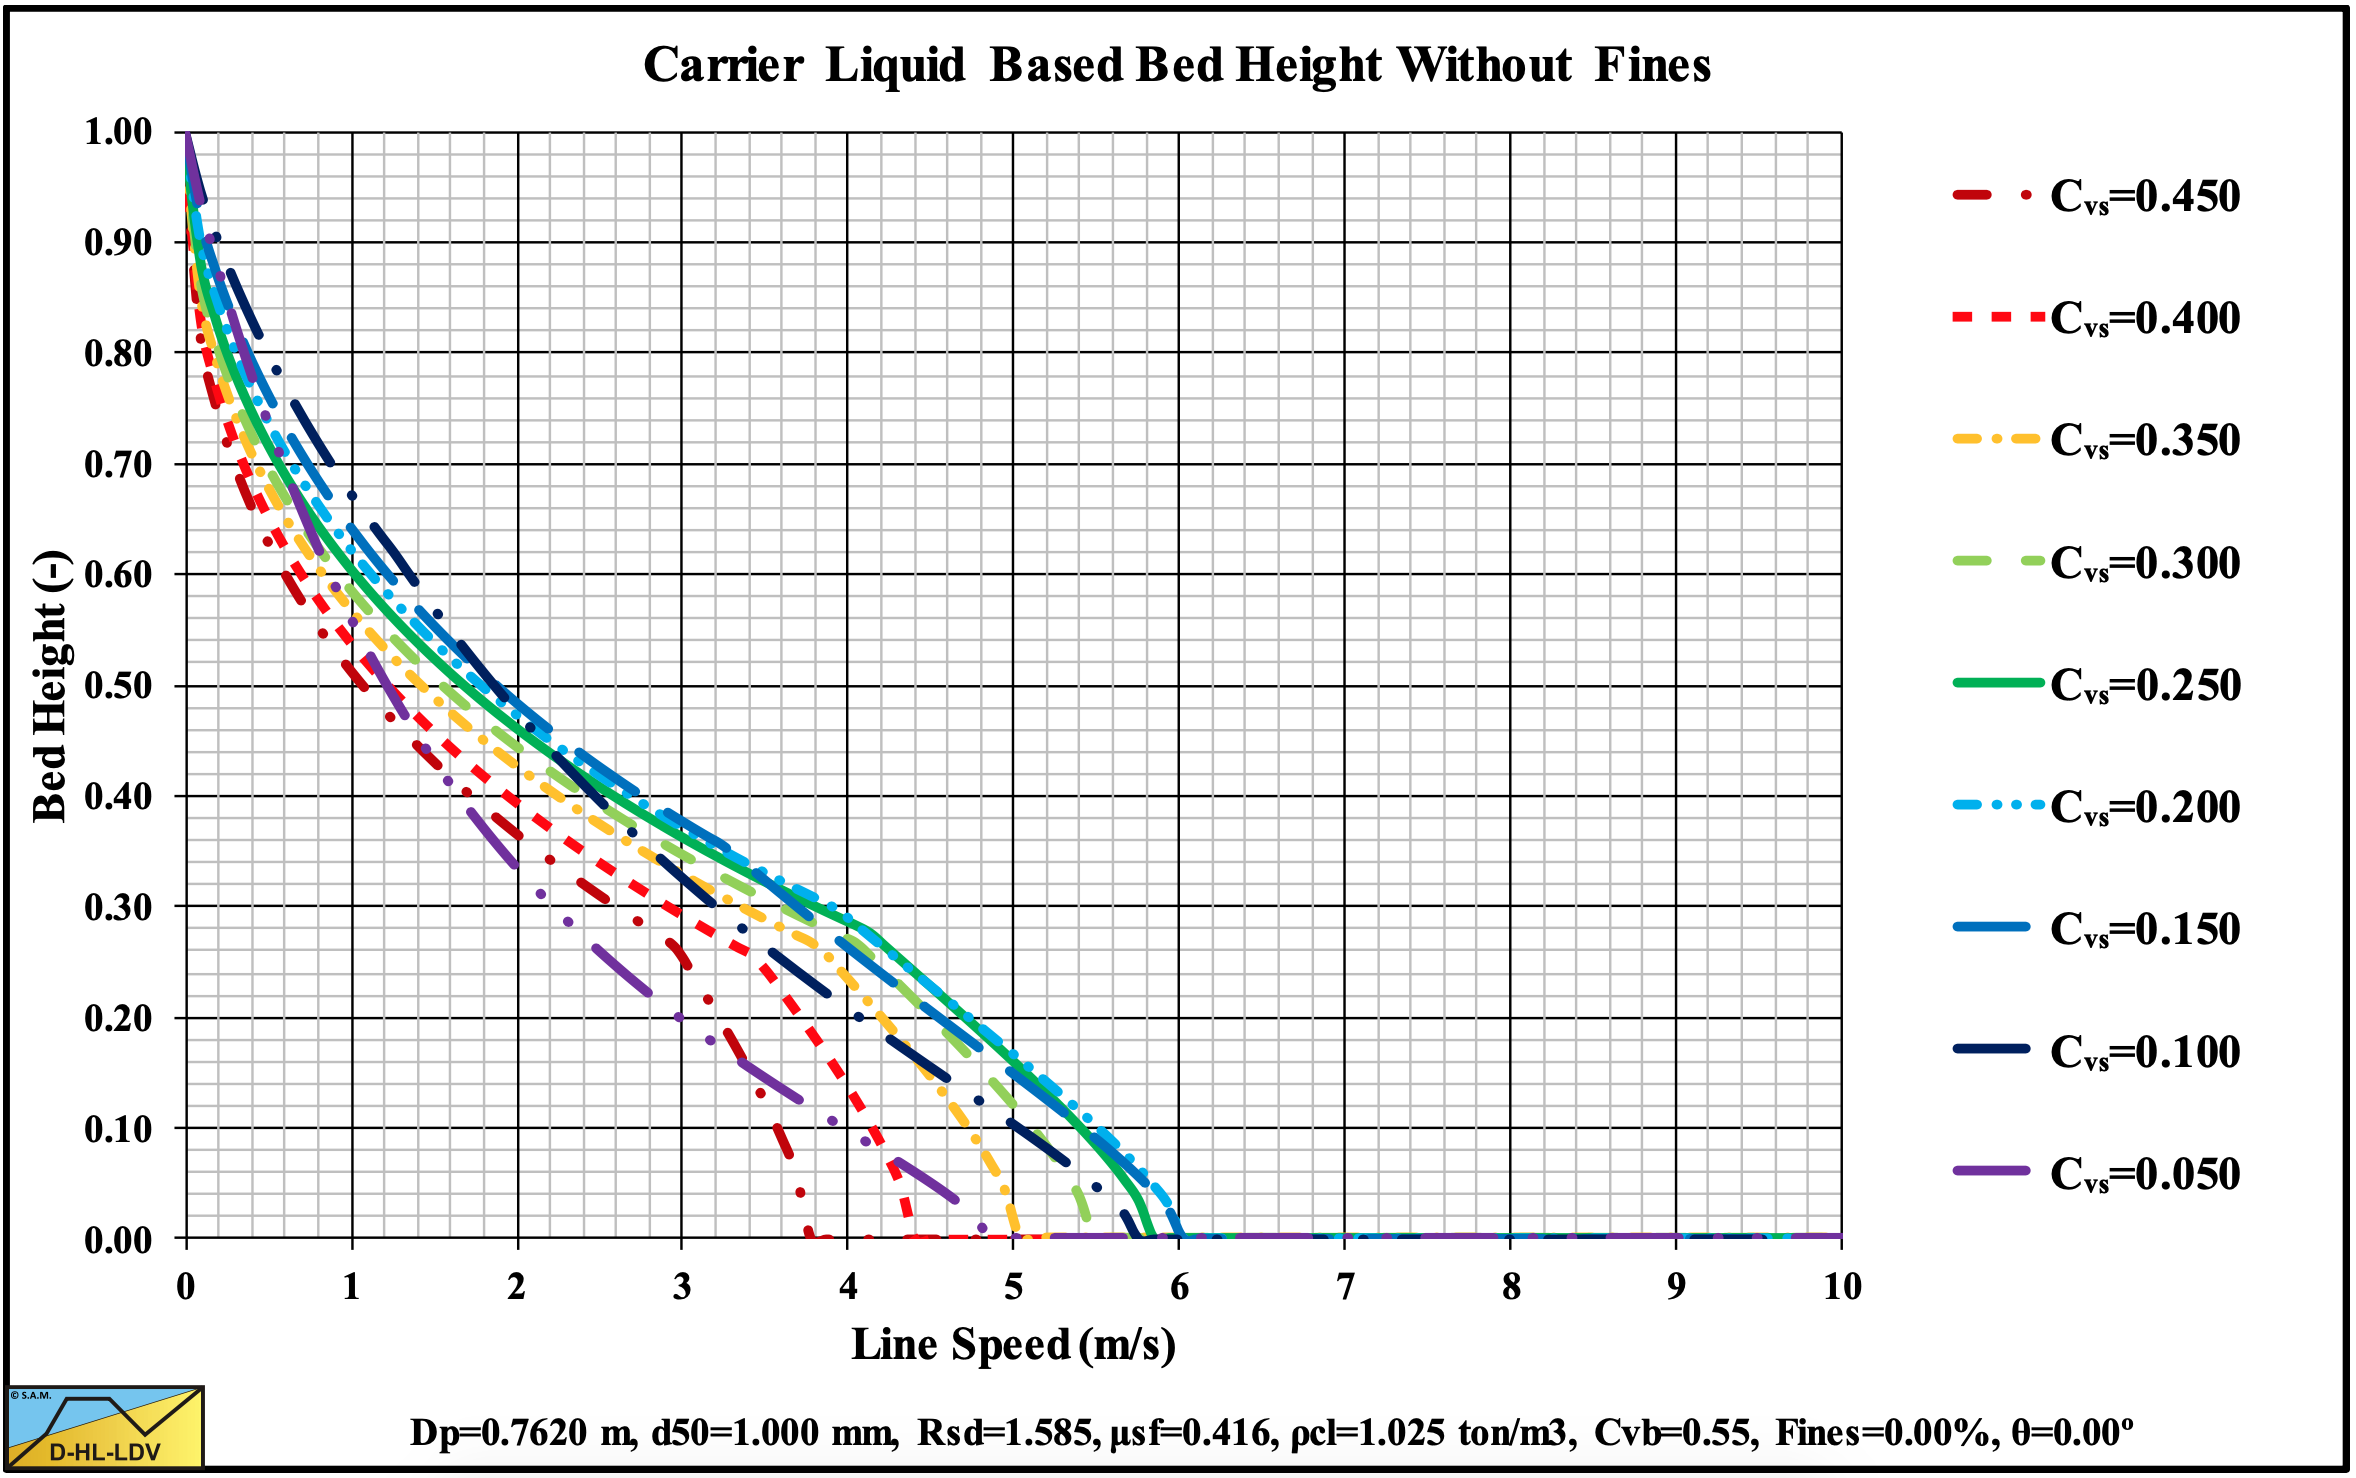
Figure 13.5-24: The bed height for 9 concentrations.
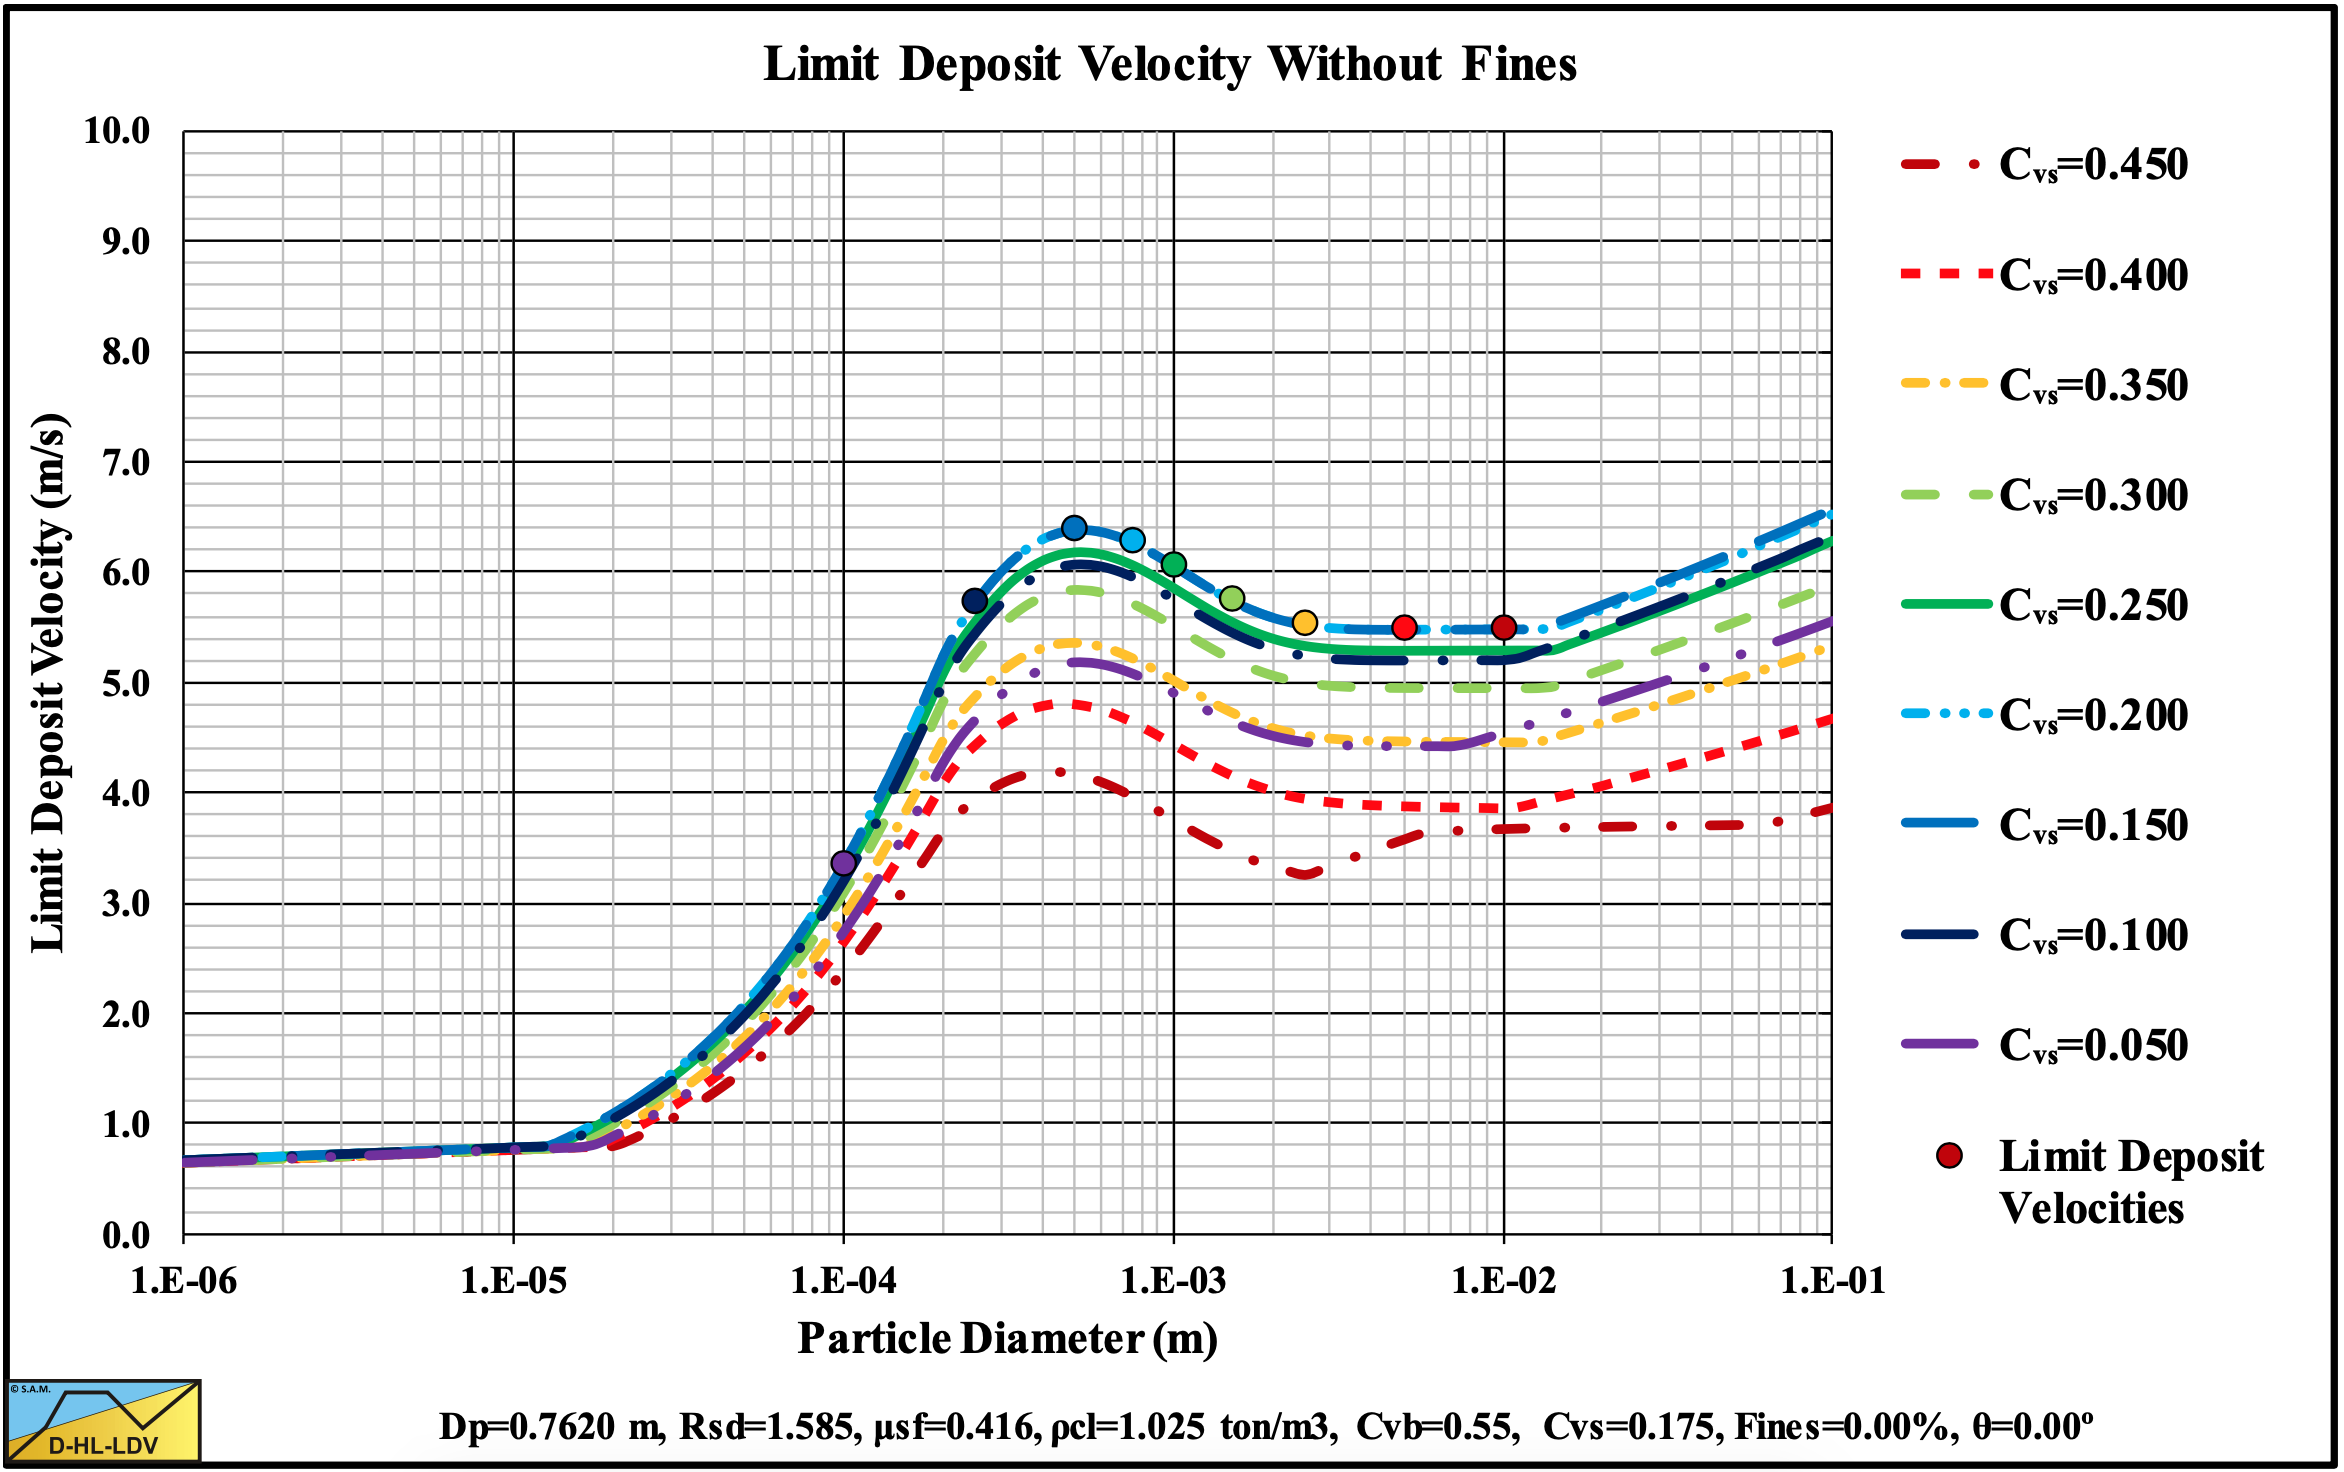
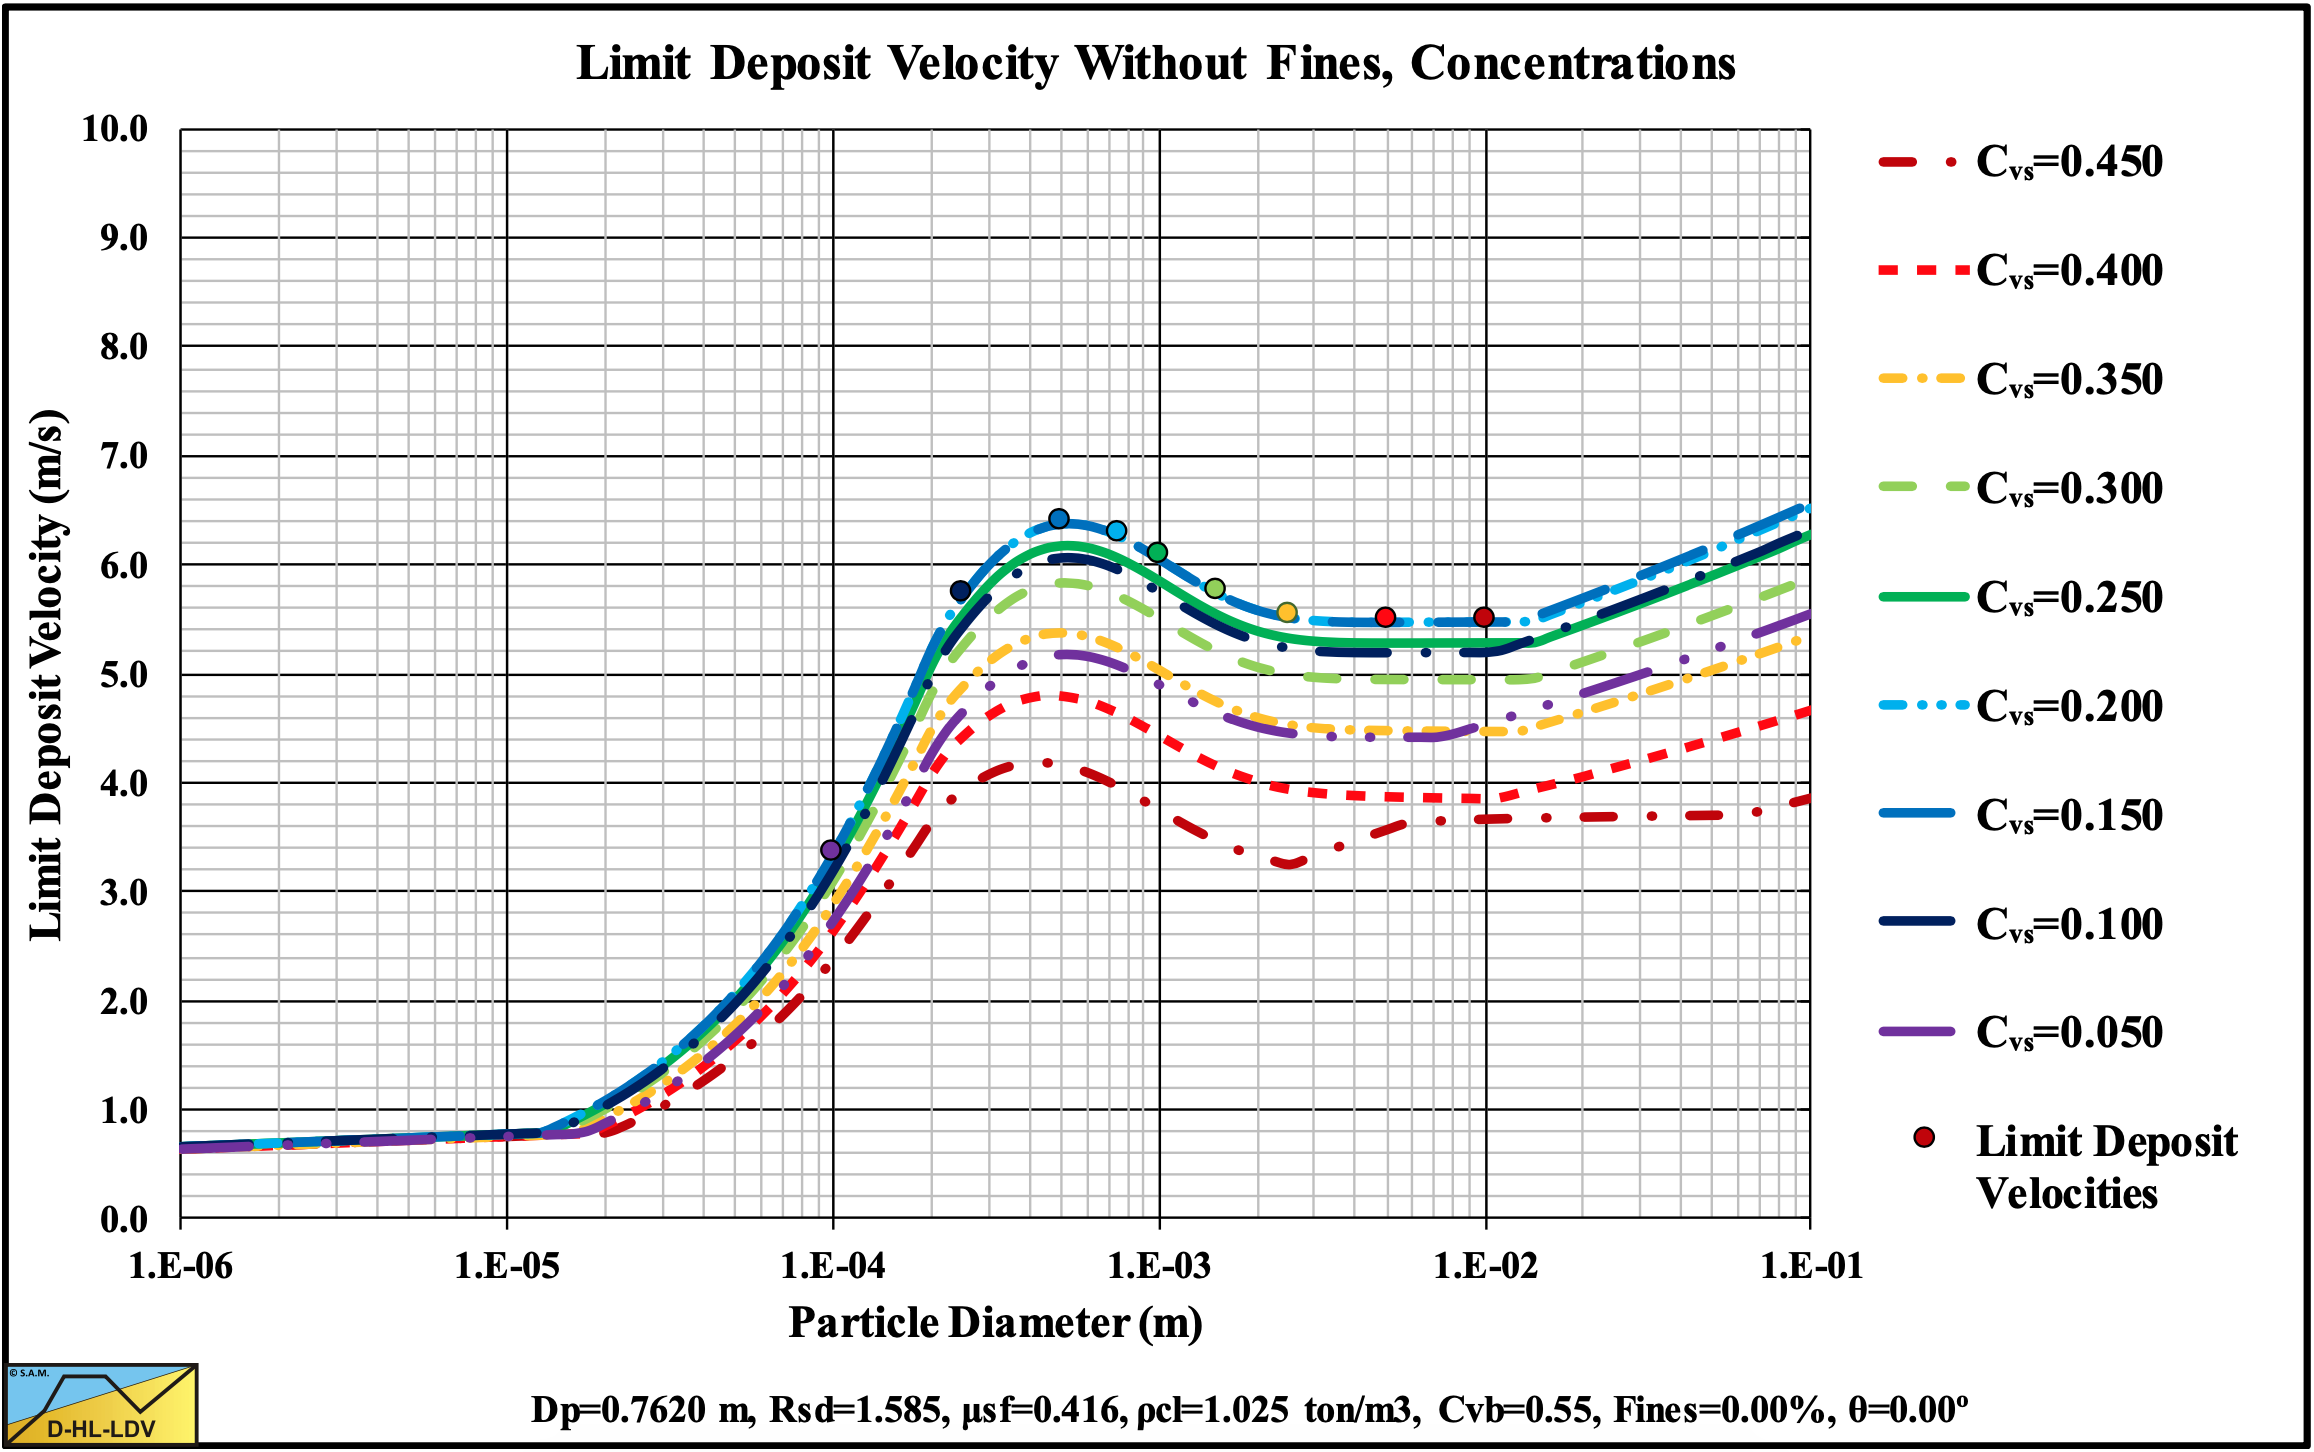
Figure 13.5-25: The Limit Deposit Velocity versus the particle diameter for 9 concentrations.
13.5.4 9 Pipe Diameters
Figure 13.5-26: The hydraulic gradient versus the line speed for 9 pipe diameters, Cvs.
Figure 13.5-27: The hydraulic gradient versus the line speed for 9 pipe diameters, Cvt.
Figure 13.5-28: The relative excess hydraulic gradient versus the liquid hydraulic gradient for 9 pipe diameters, Cvs.
Figure 13.5-29: The relative excess hydraulic gradient versus the liquid hydraulic gradient for 9 pipe diameters, Cvt.
Figure 13.5-30: The hydraulic gradient on Durand coordinates for 9 pipe diameters, Cvs.
Figure 13.5-31: The hydraulic gradient on Durand coordinates for 9 pipe diameters, Cvt.
Figure 13.5-32: The slip ratio for 9 pipe diameters.
Figure 13.5-33: The bed height for 9 pipe diameters.
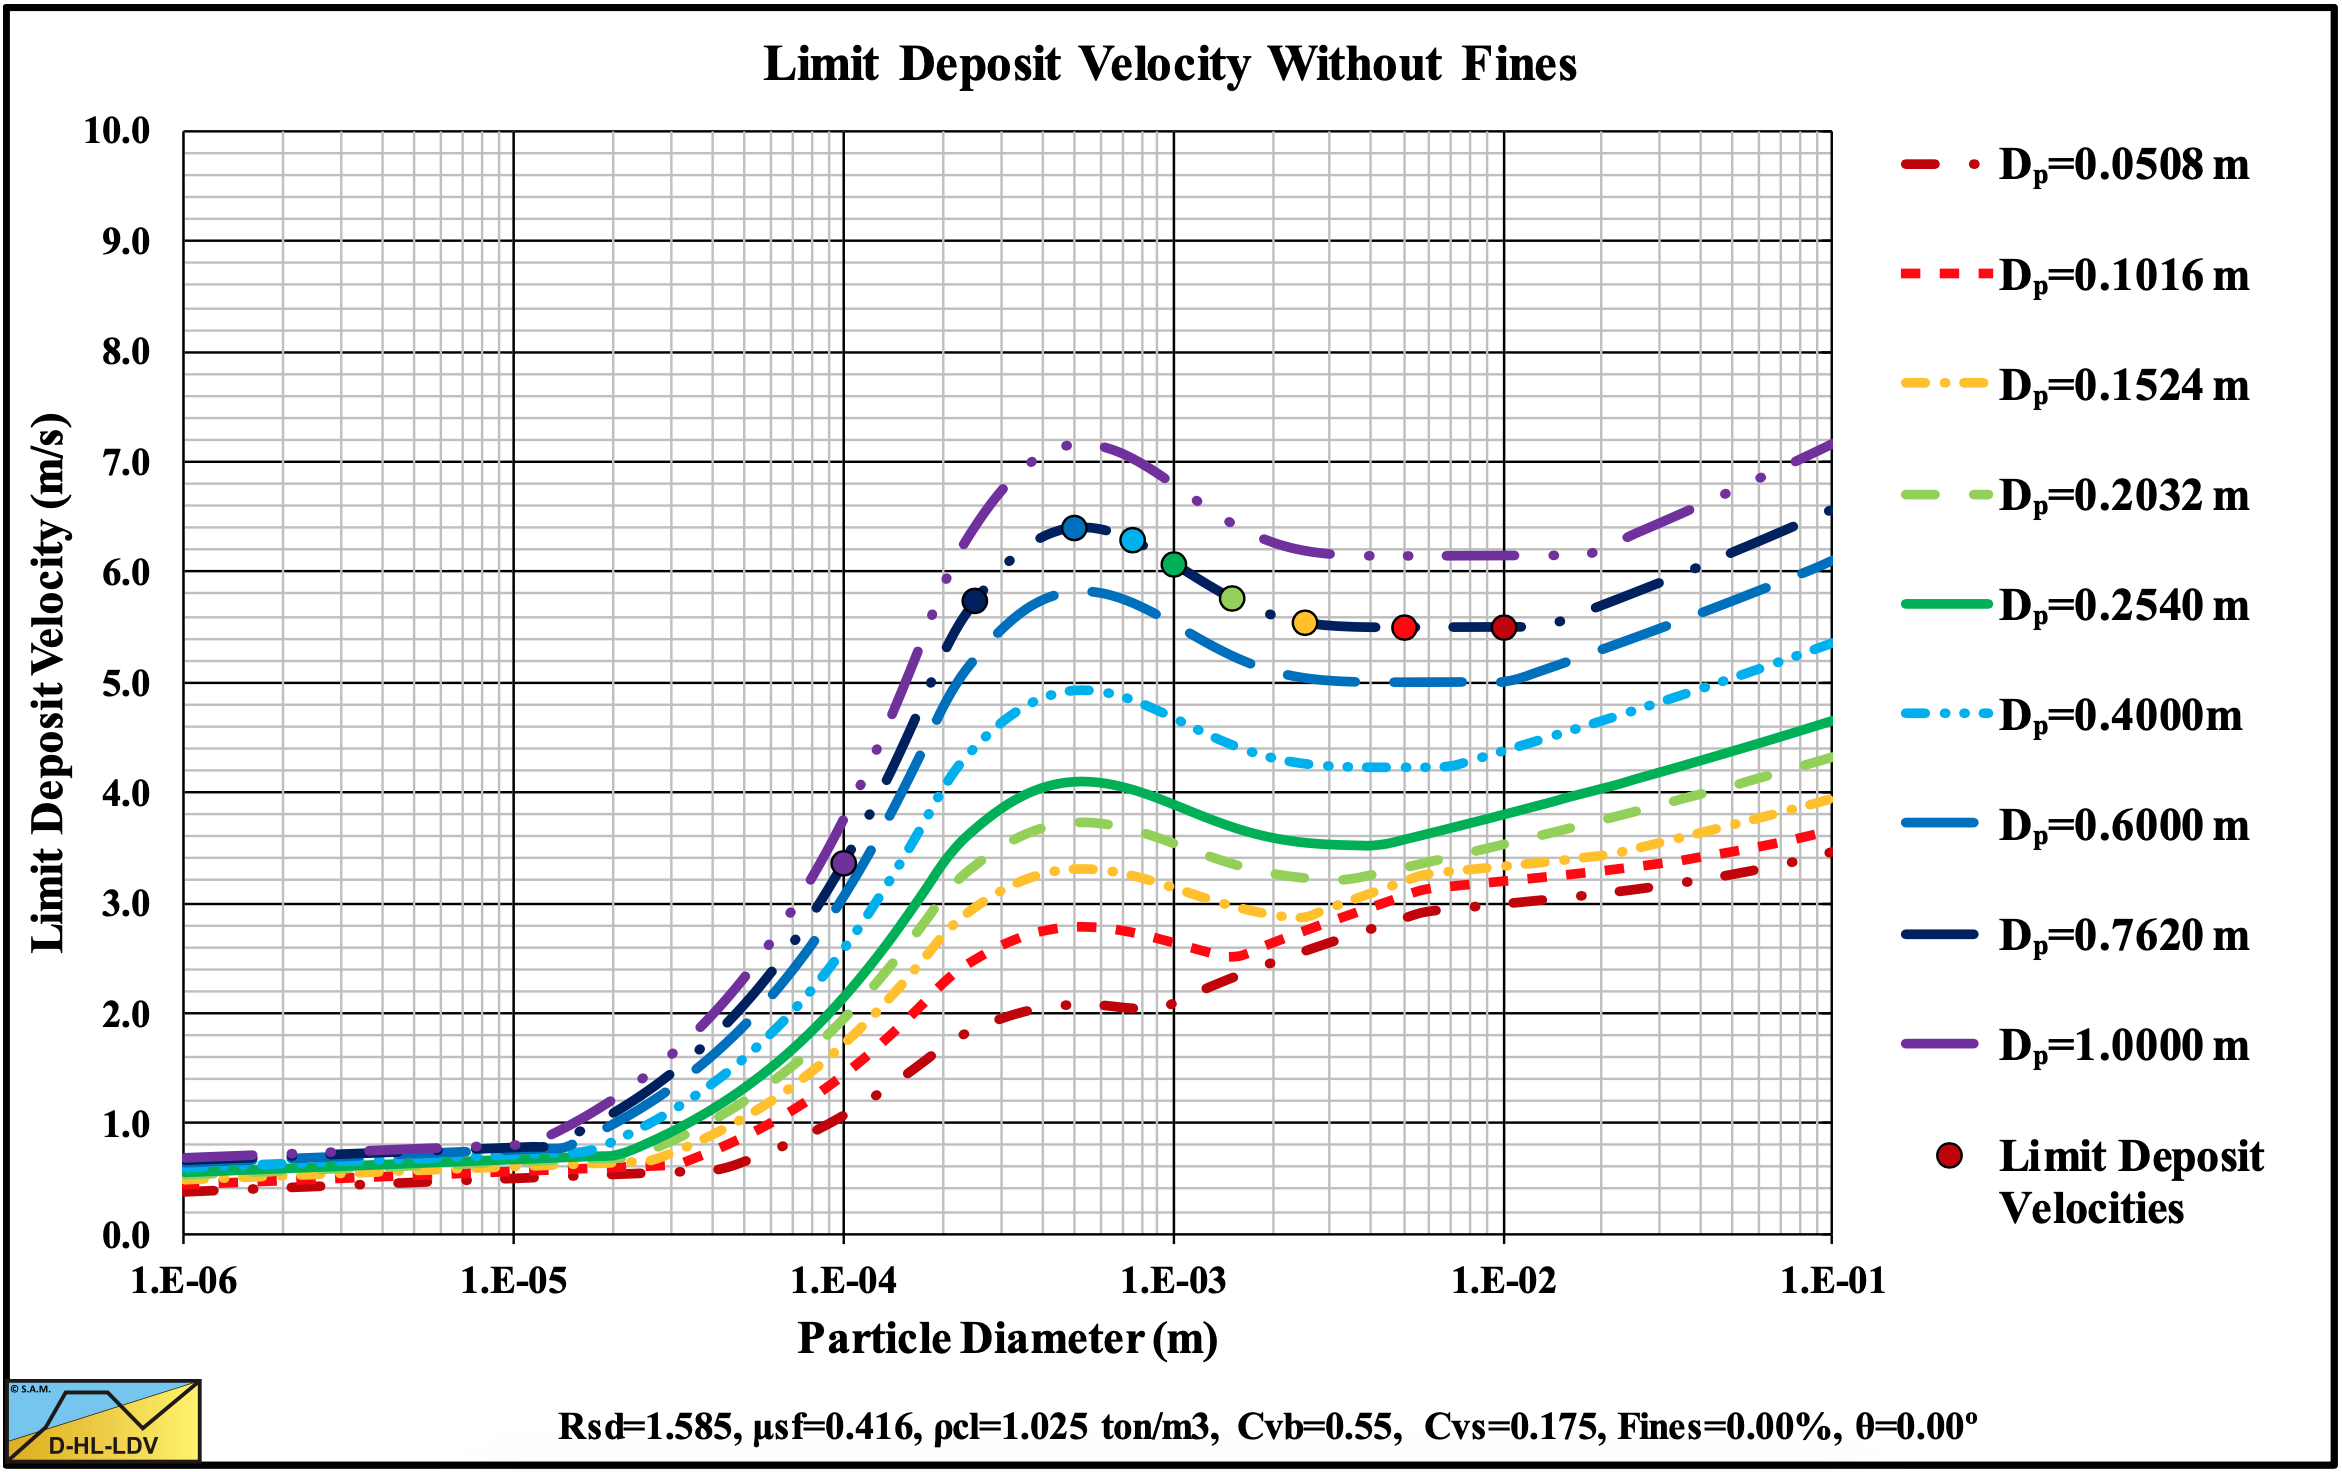
Figure 13.5-34: The Limit Deposit Velocity versus the particle diameter for 9 pipe diameters.
13.5.5 9 Inclination Angles
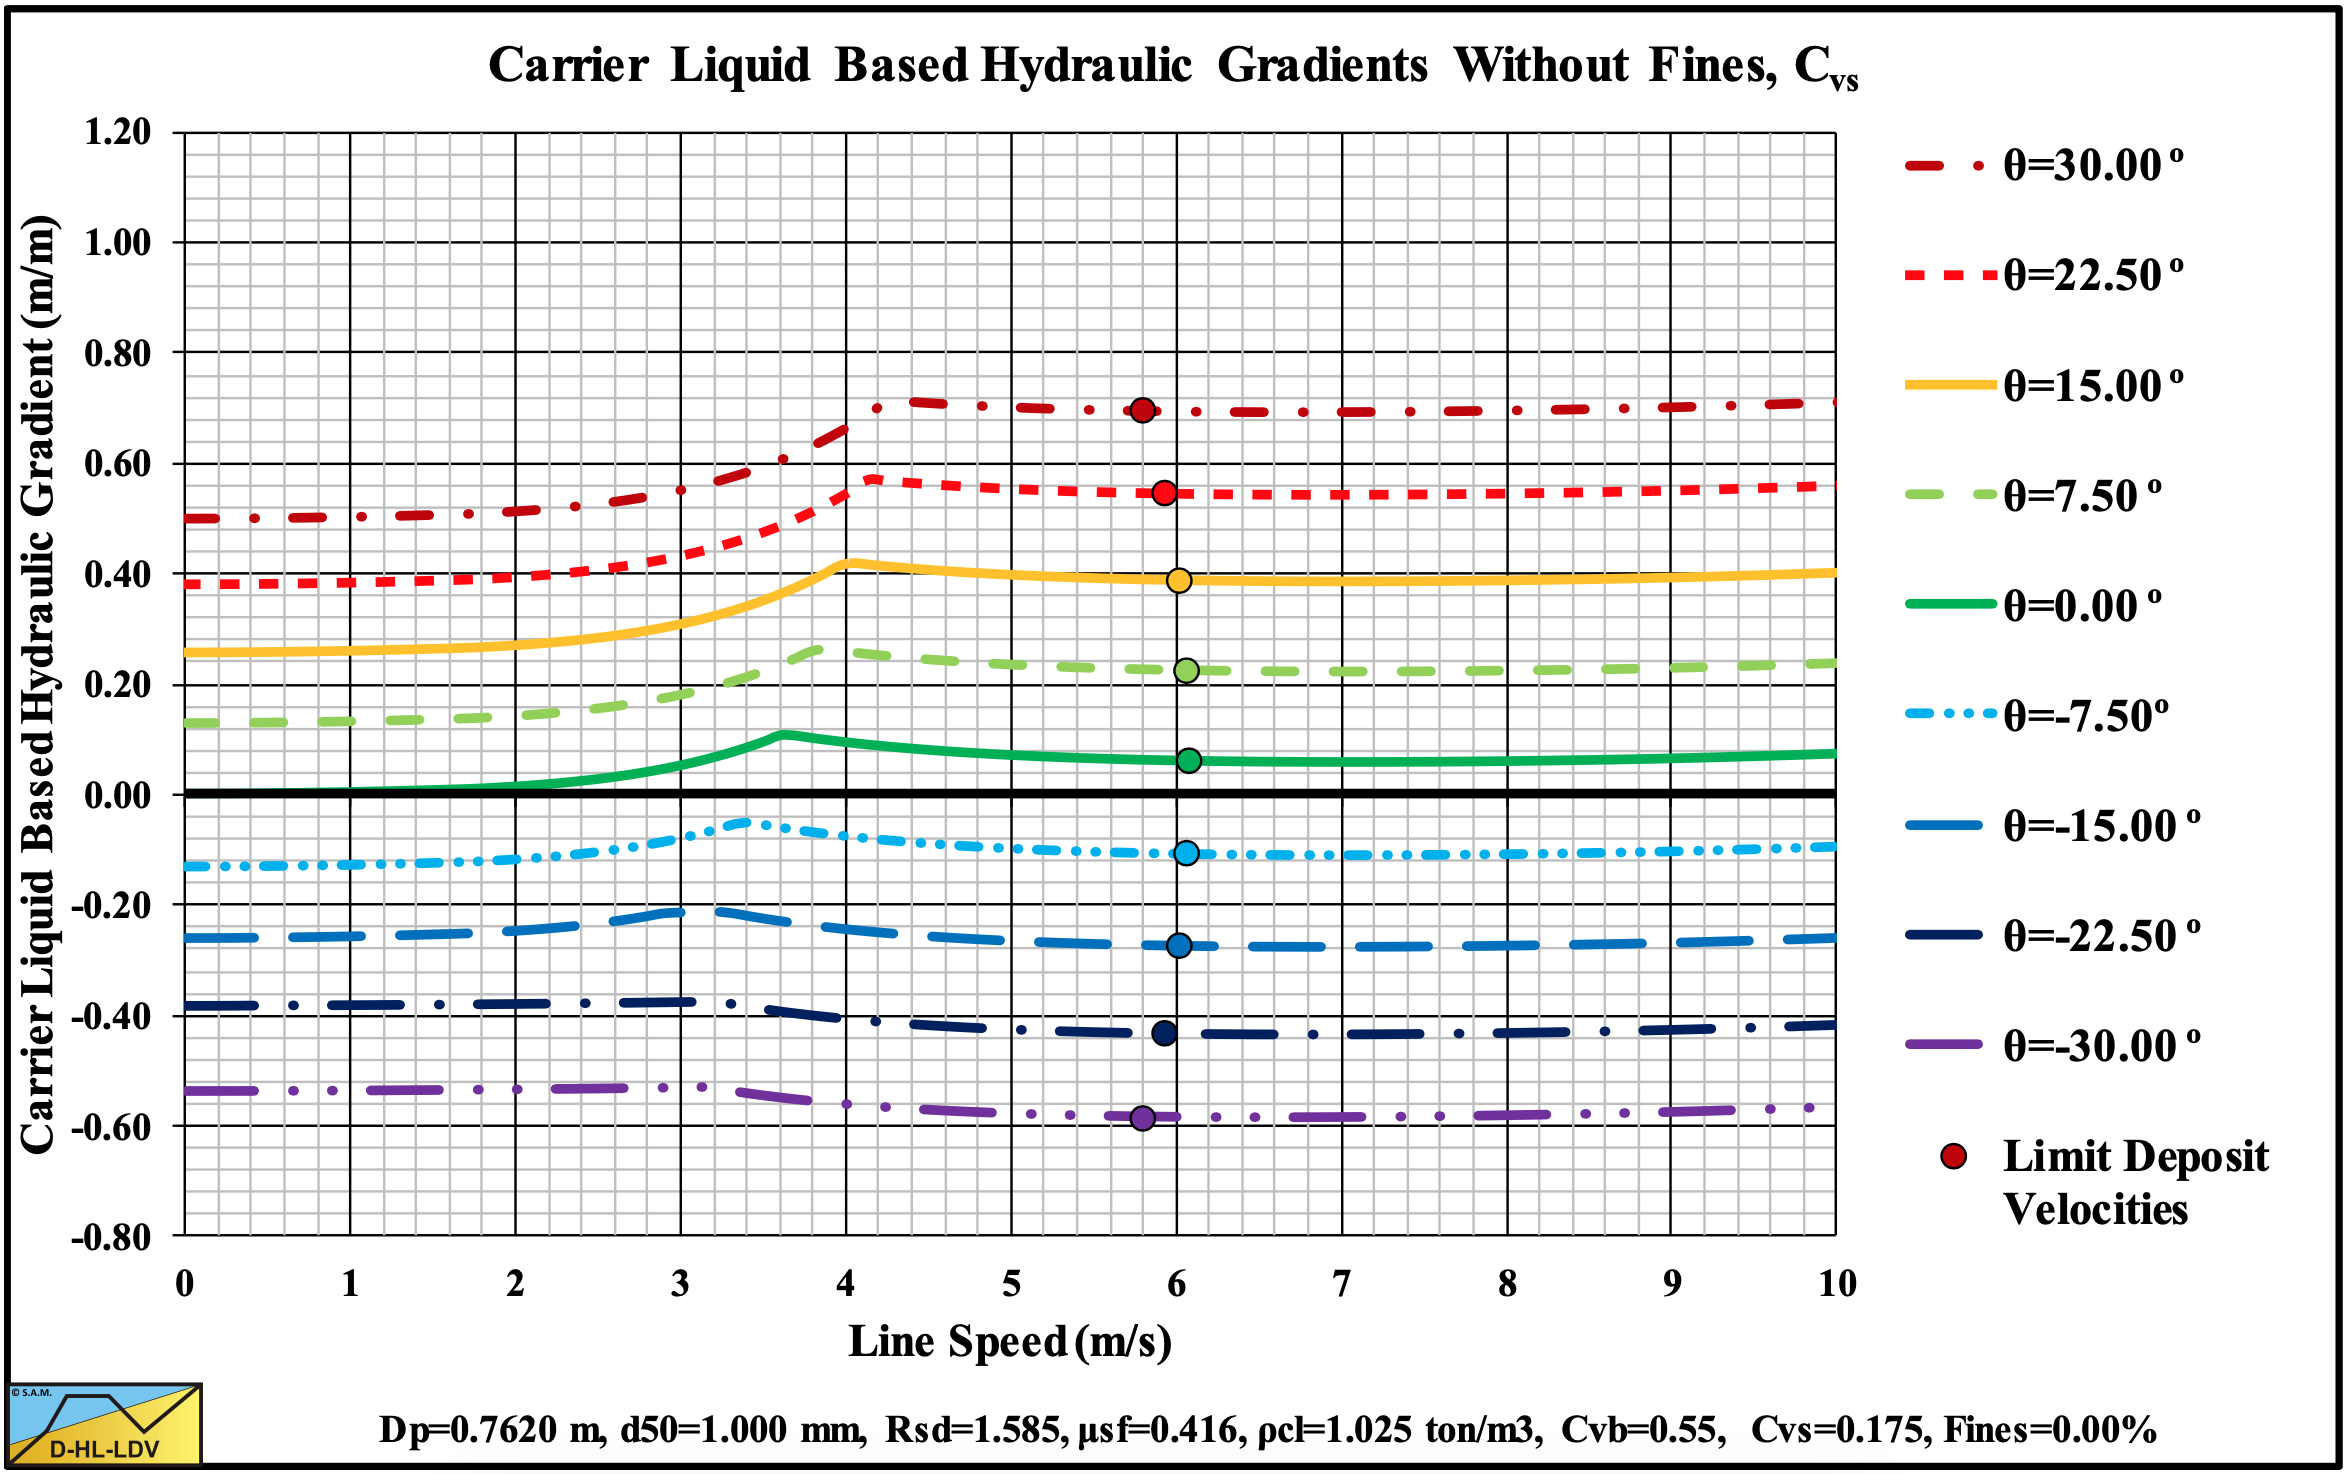
Figure 13.5-35: The hydraulic gradient versus the line speed for 9 inclination angles, Cvs.
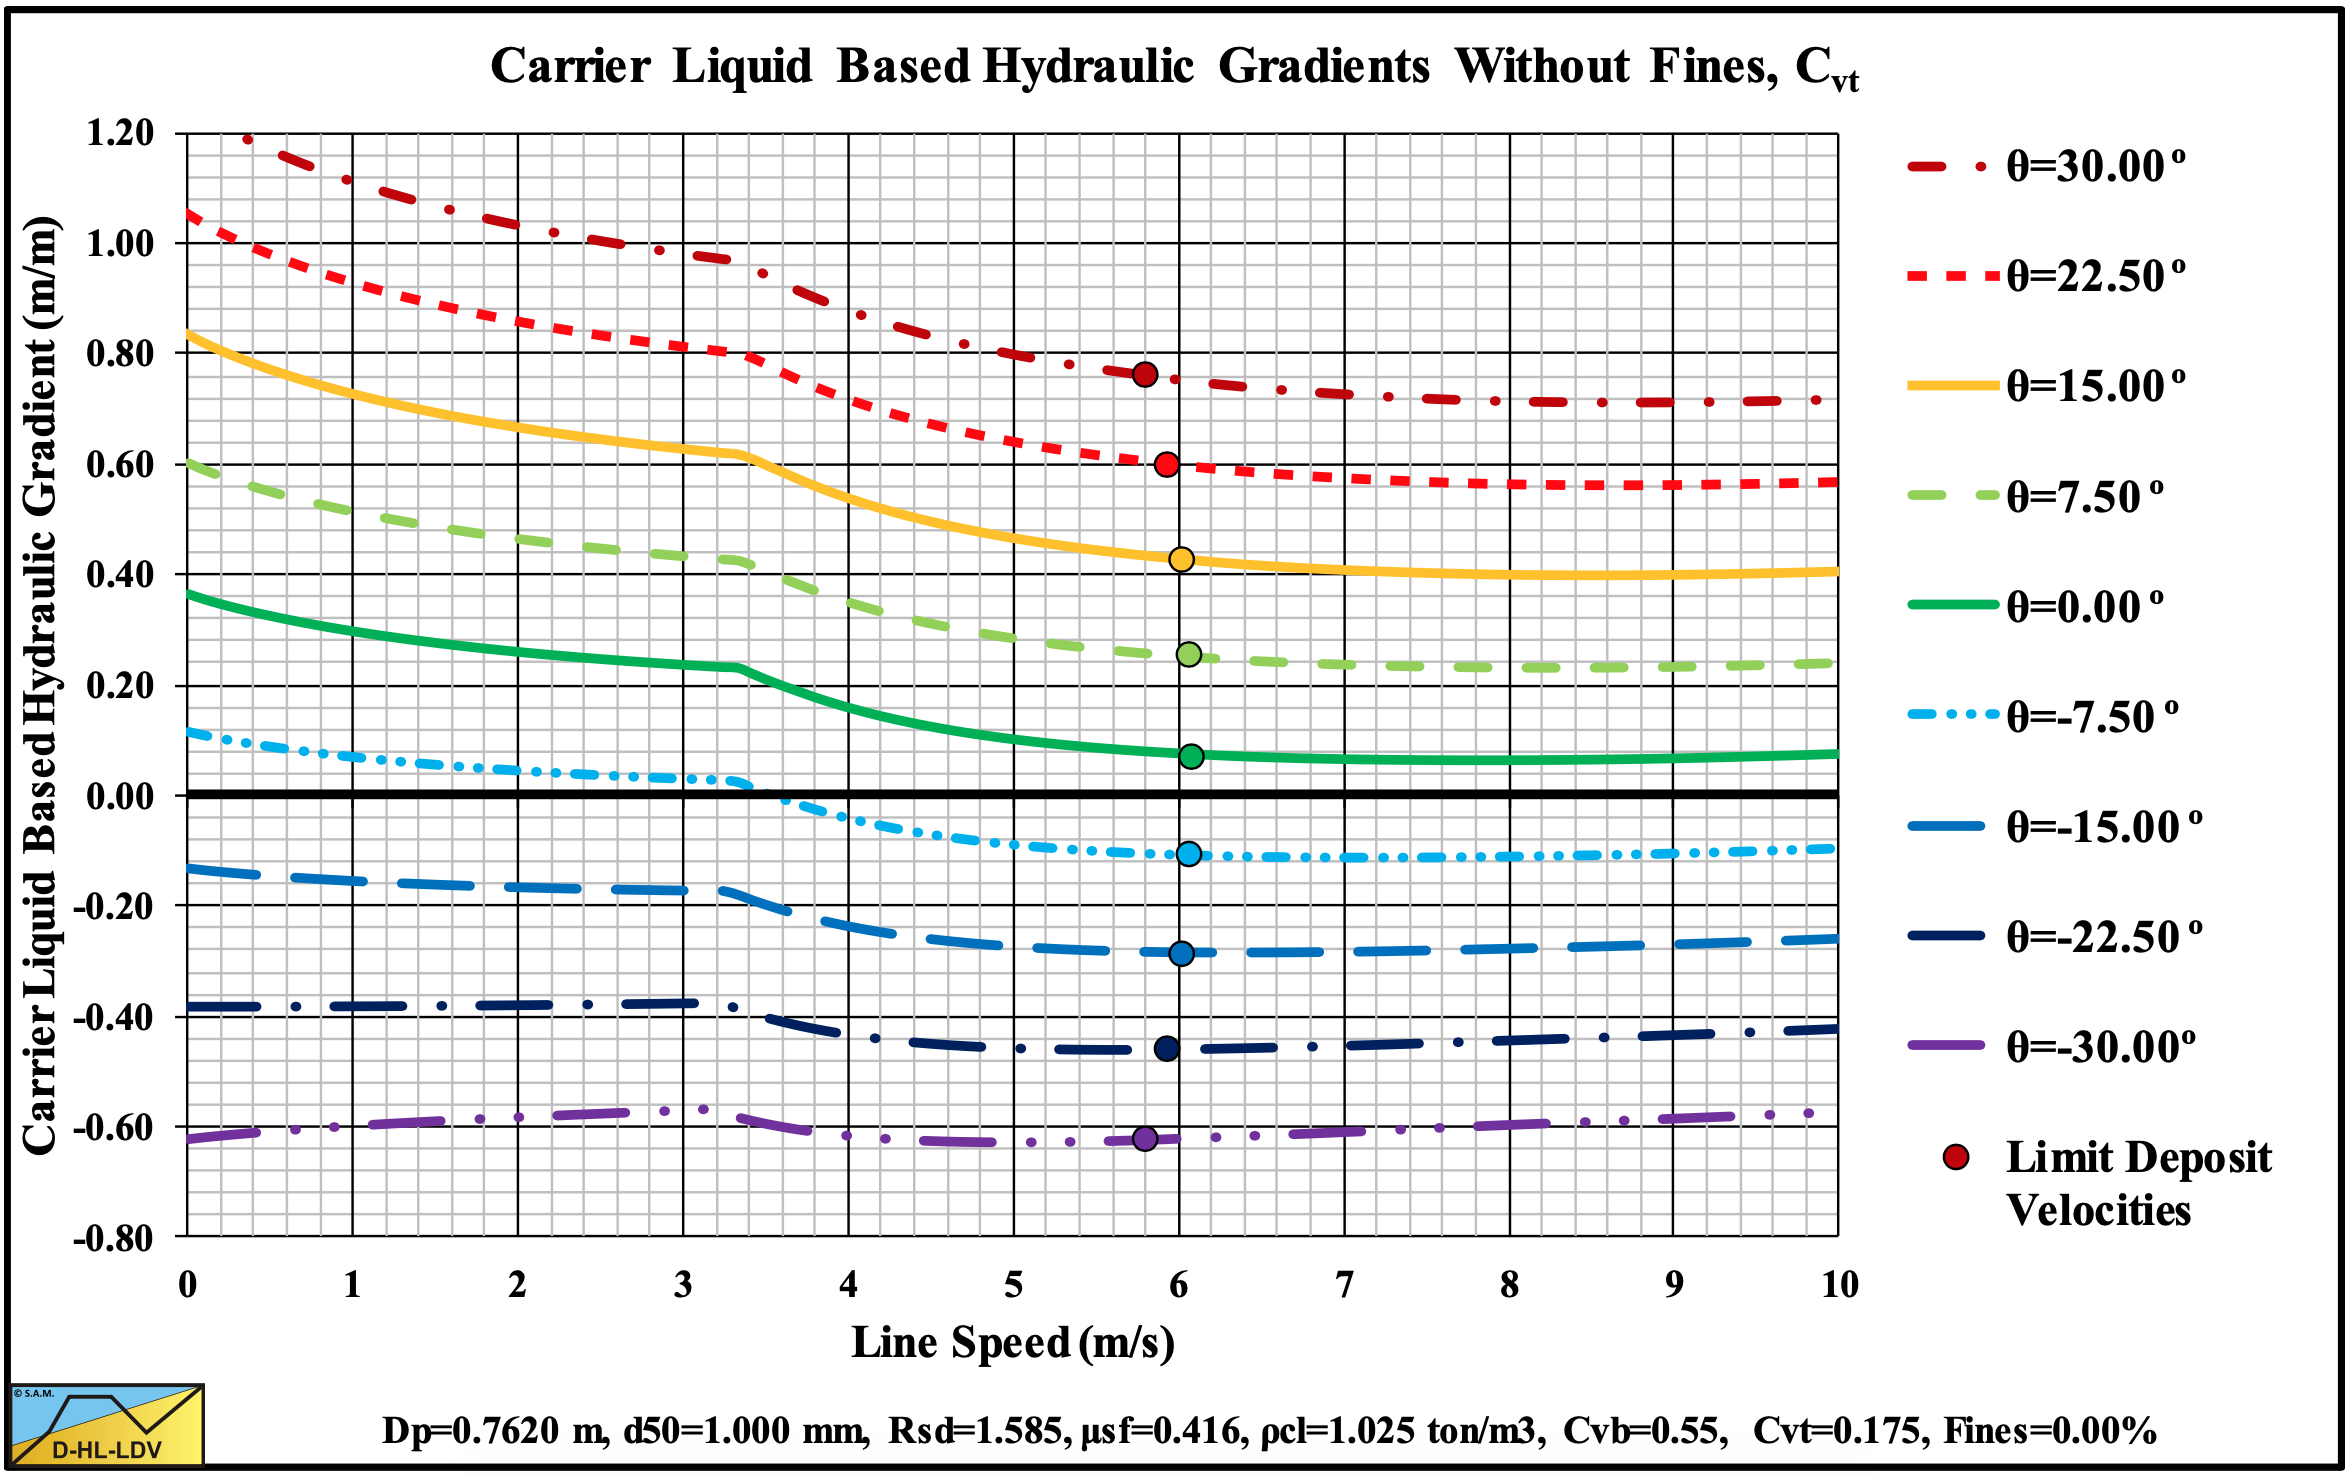
Figure 13.5-36: The hydraulic gradient versus the line speed for 9 inclination angles, Cvt.
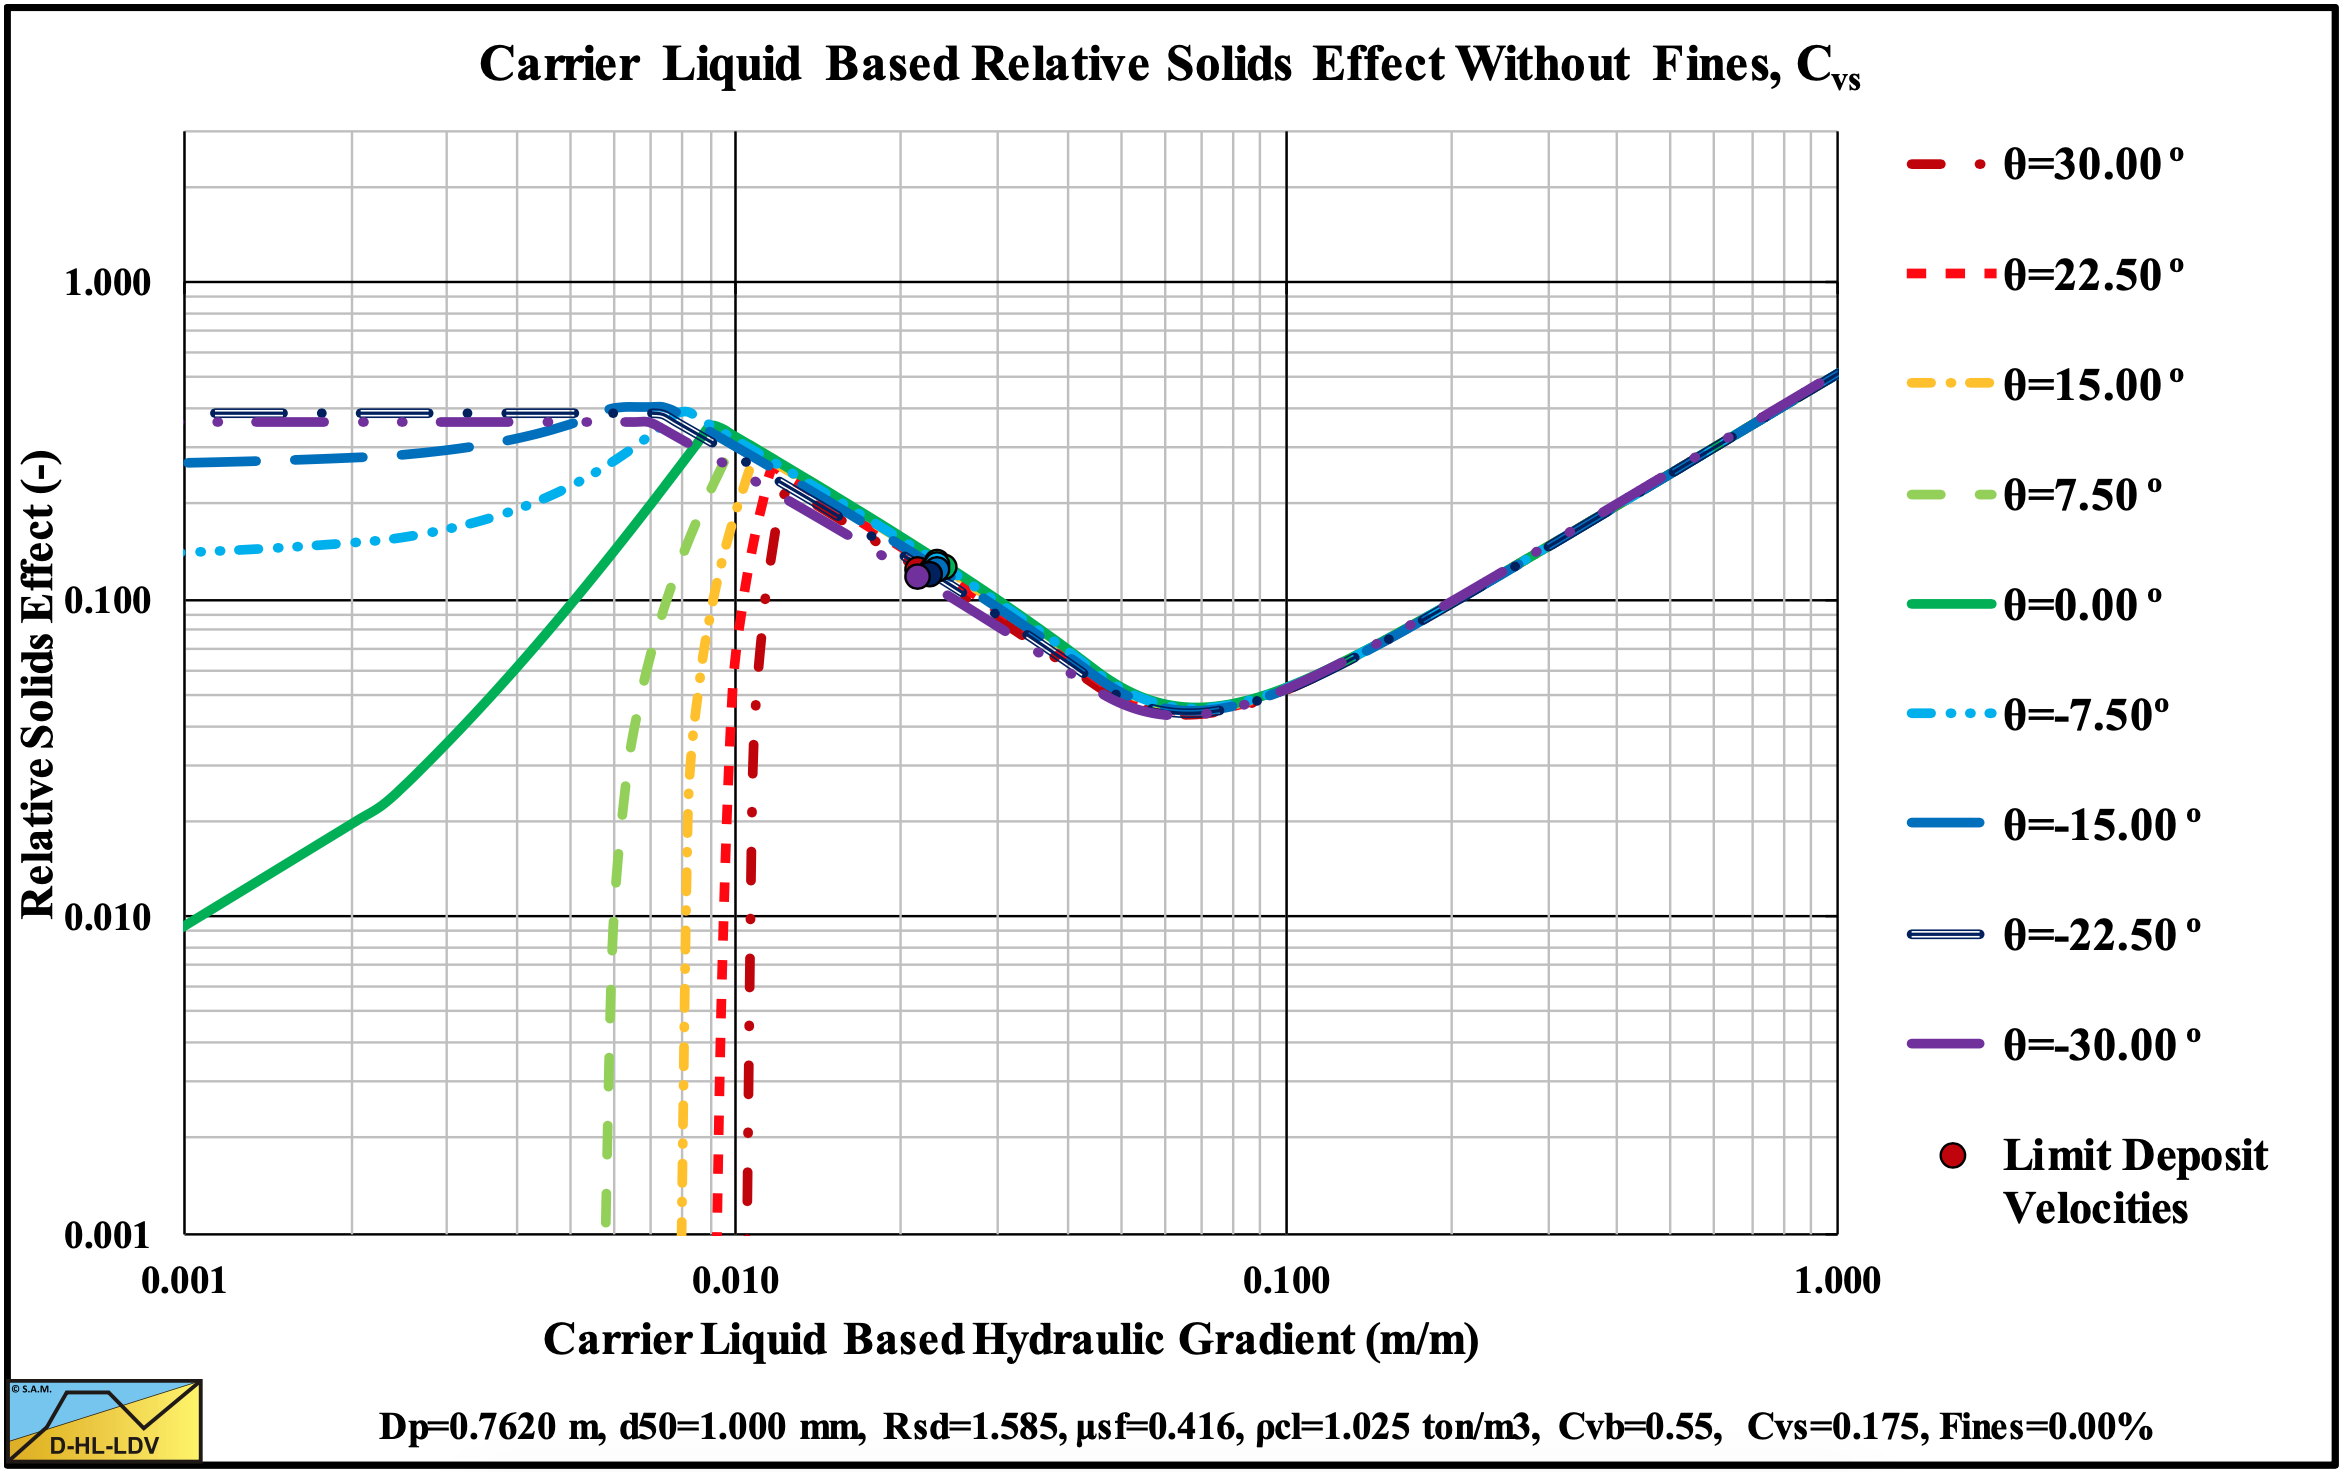
Figure 13.5-37: The relative excess hydraulic gradient versus the liquid hydraulic gradient for 9 inclination angles, Cvs.
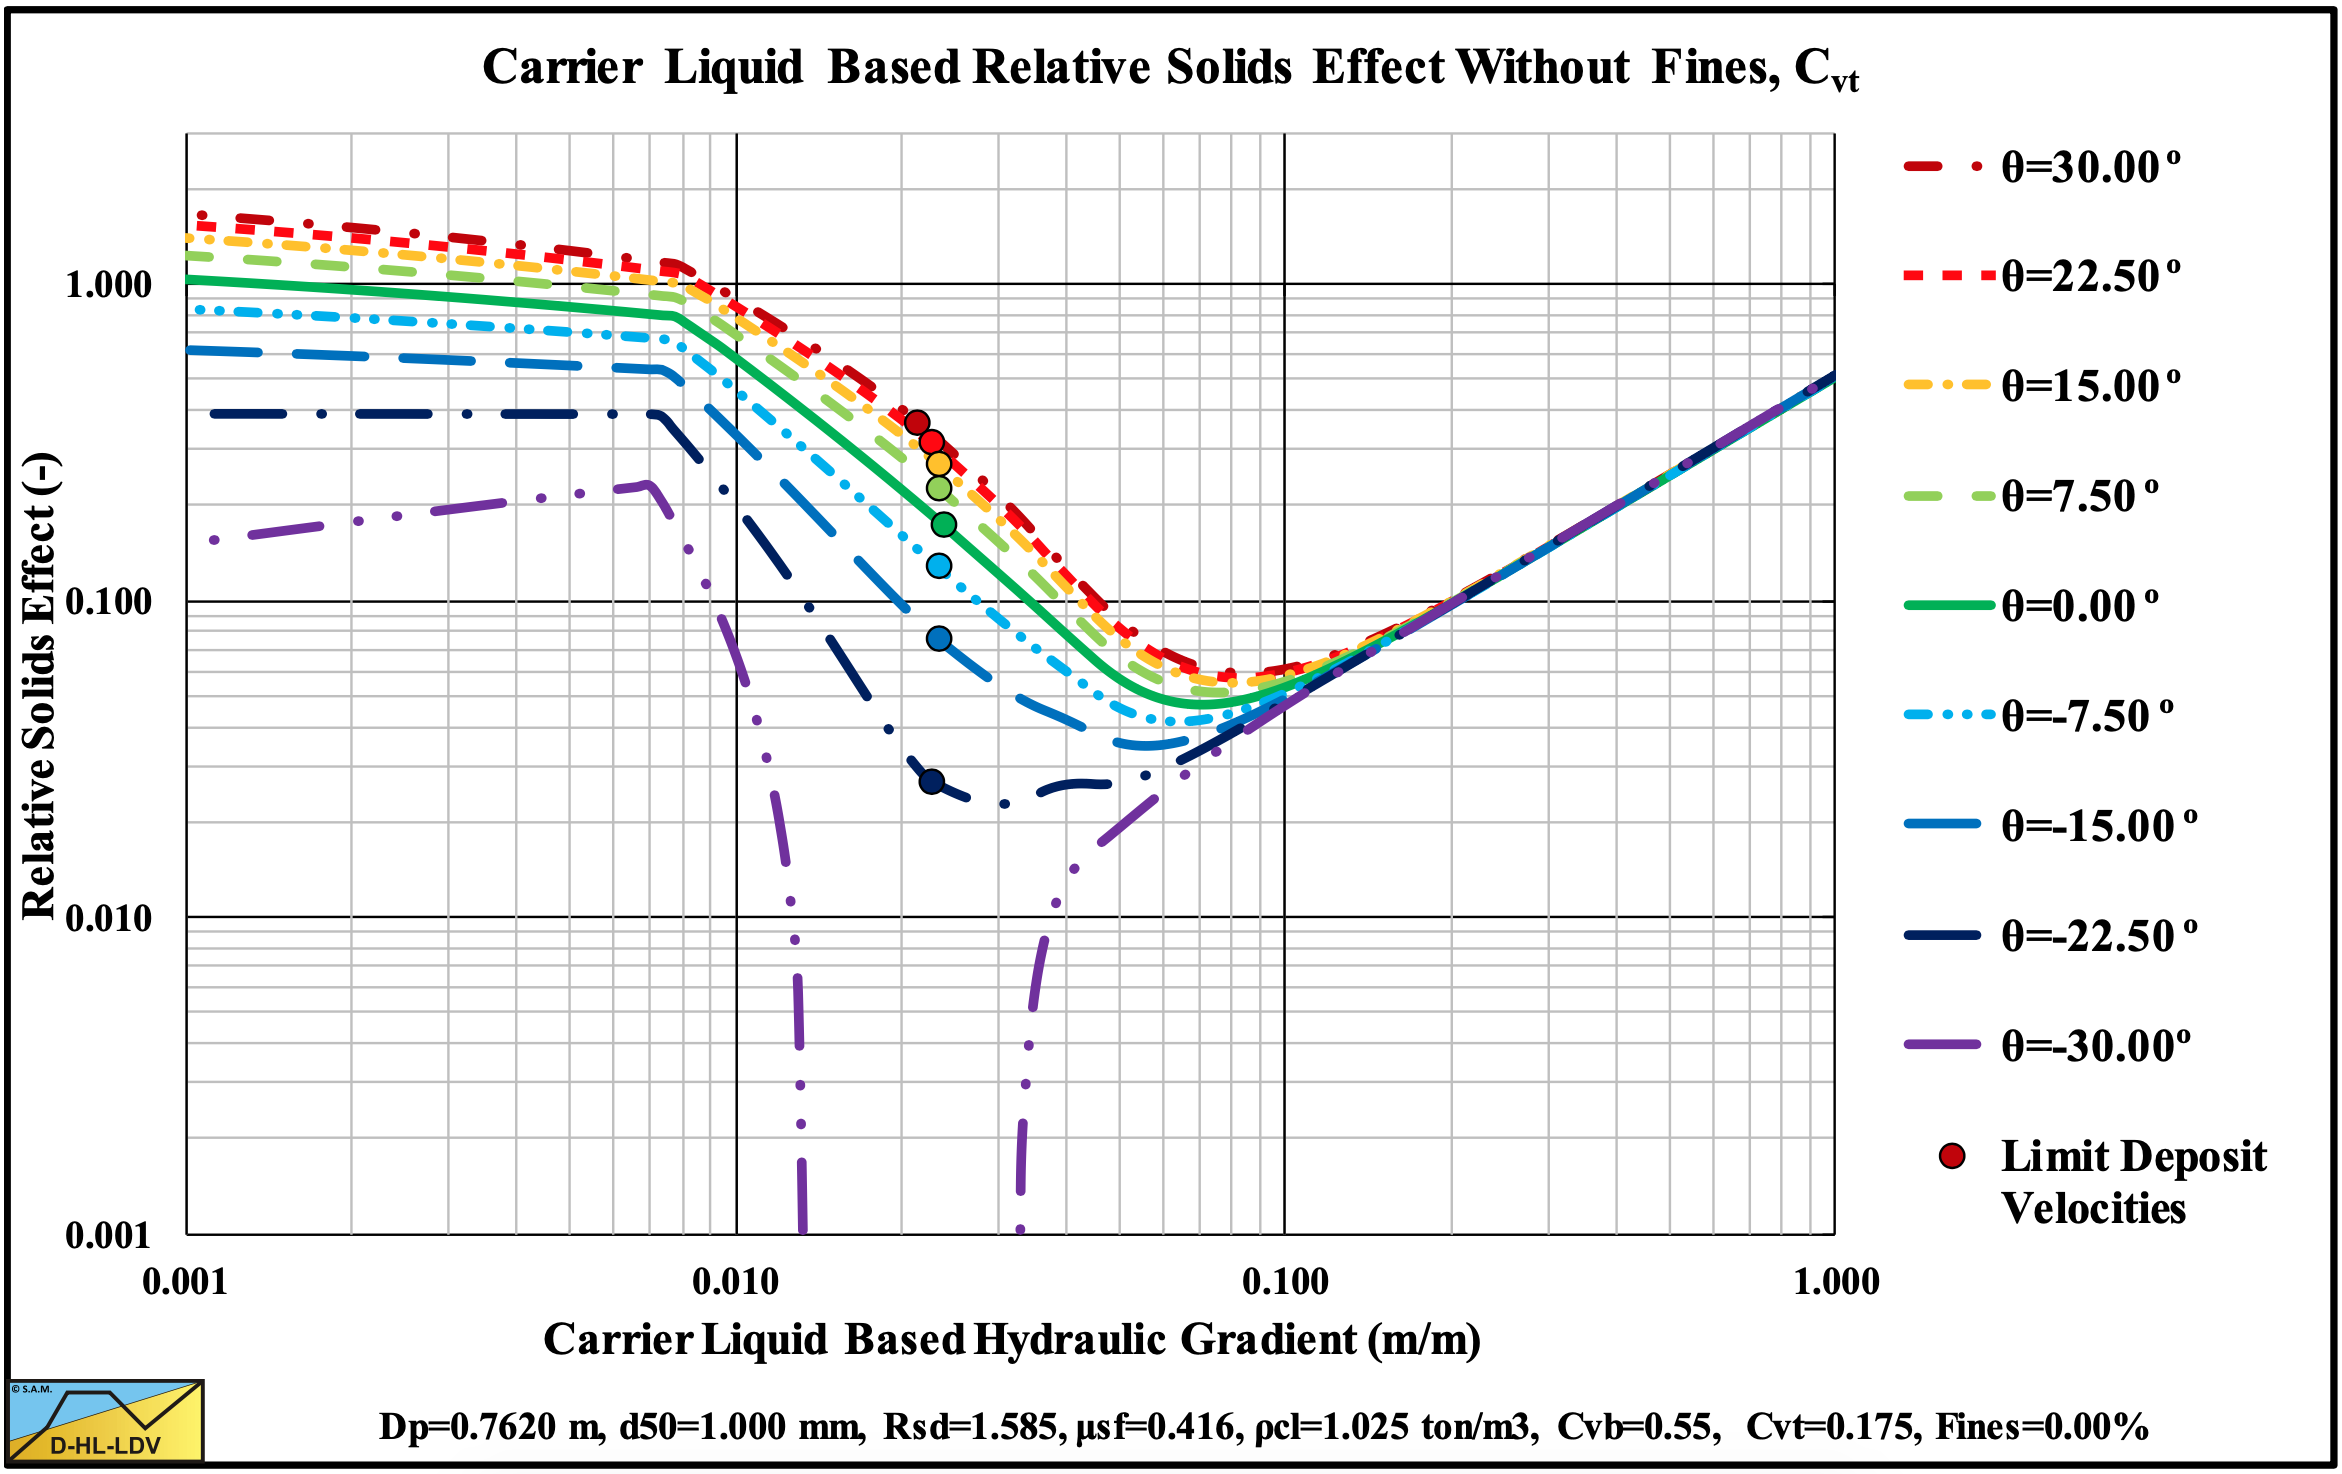
Figure 13.5-38: The relative excess hydraulic gradient versus the liquid hydraulic gradient for 9 inclination angles, Cvt.
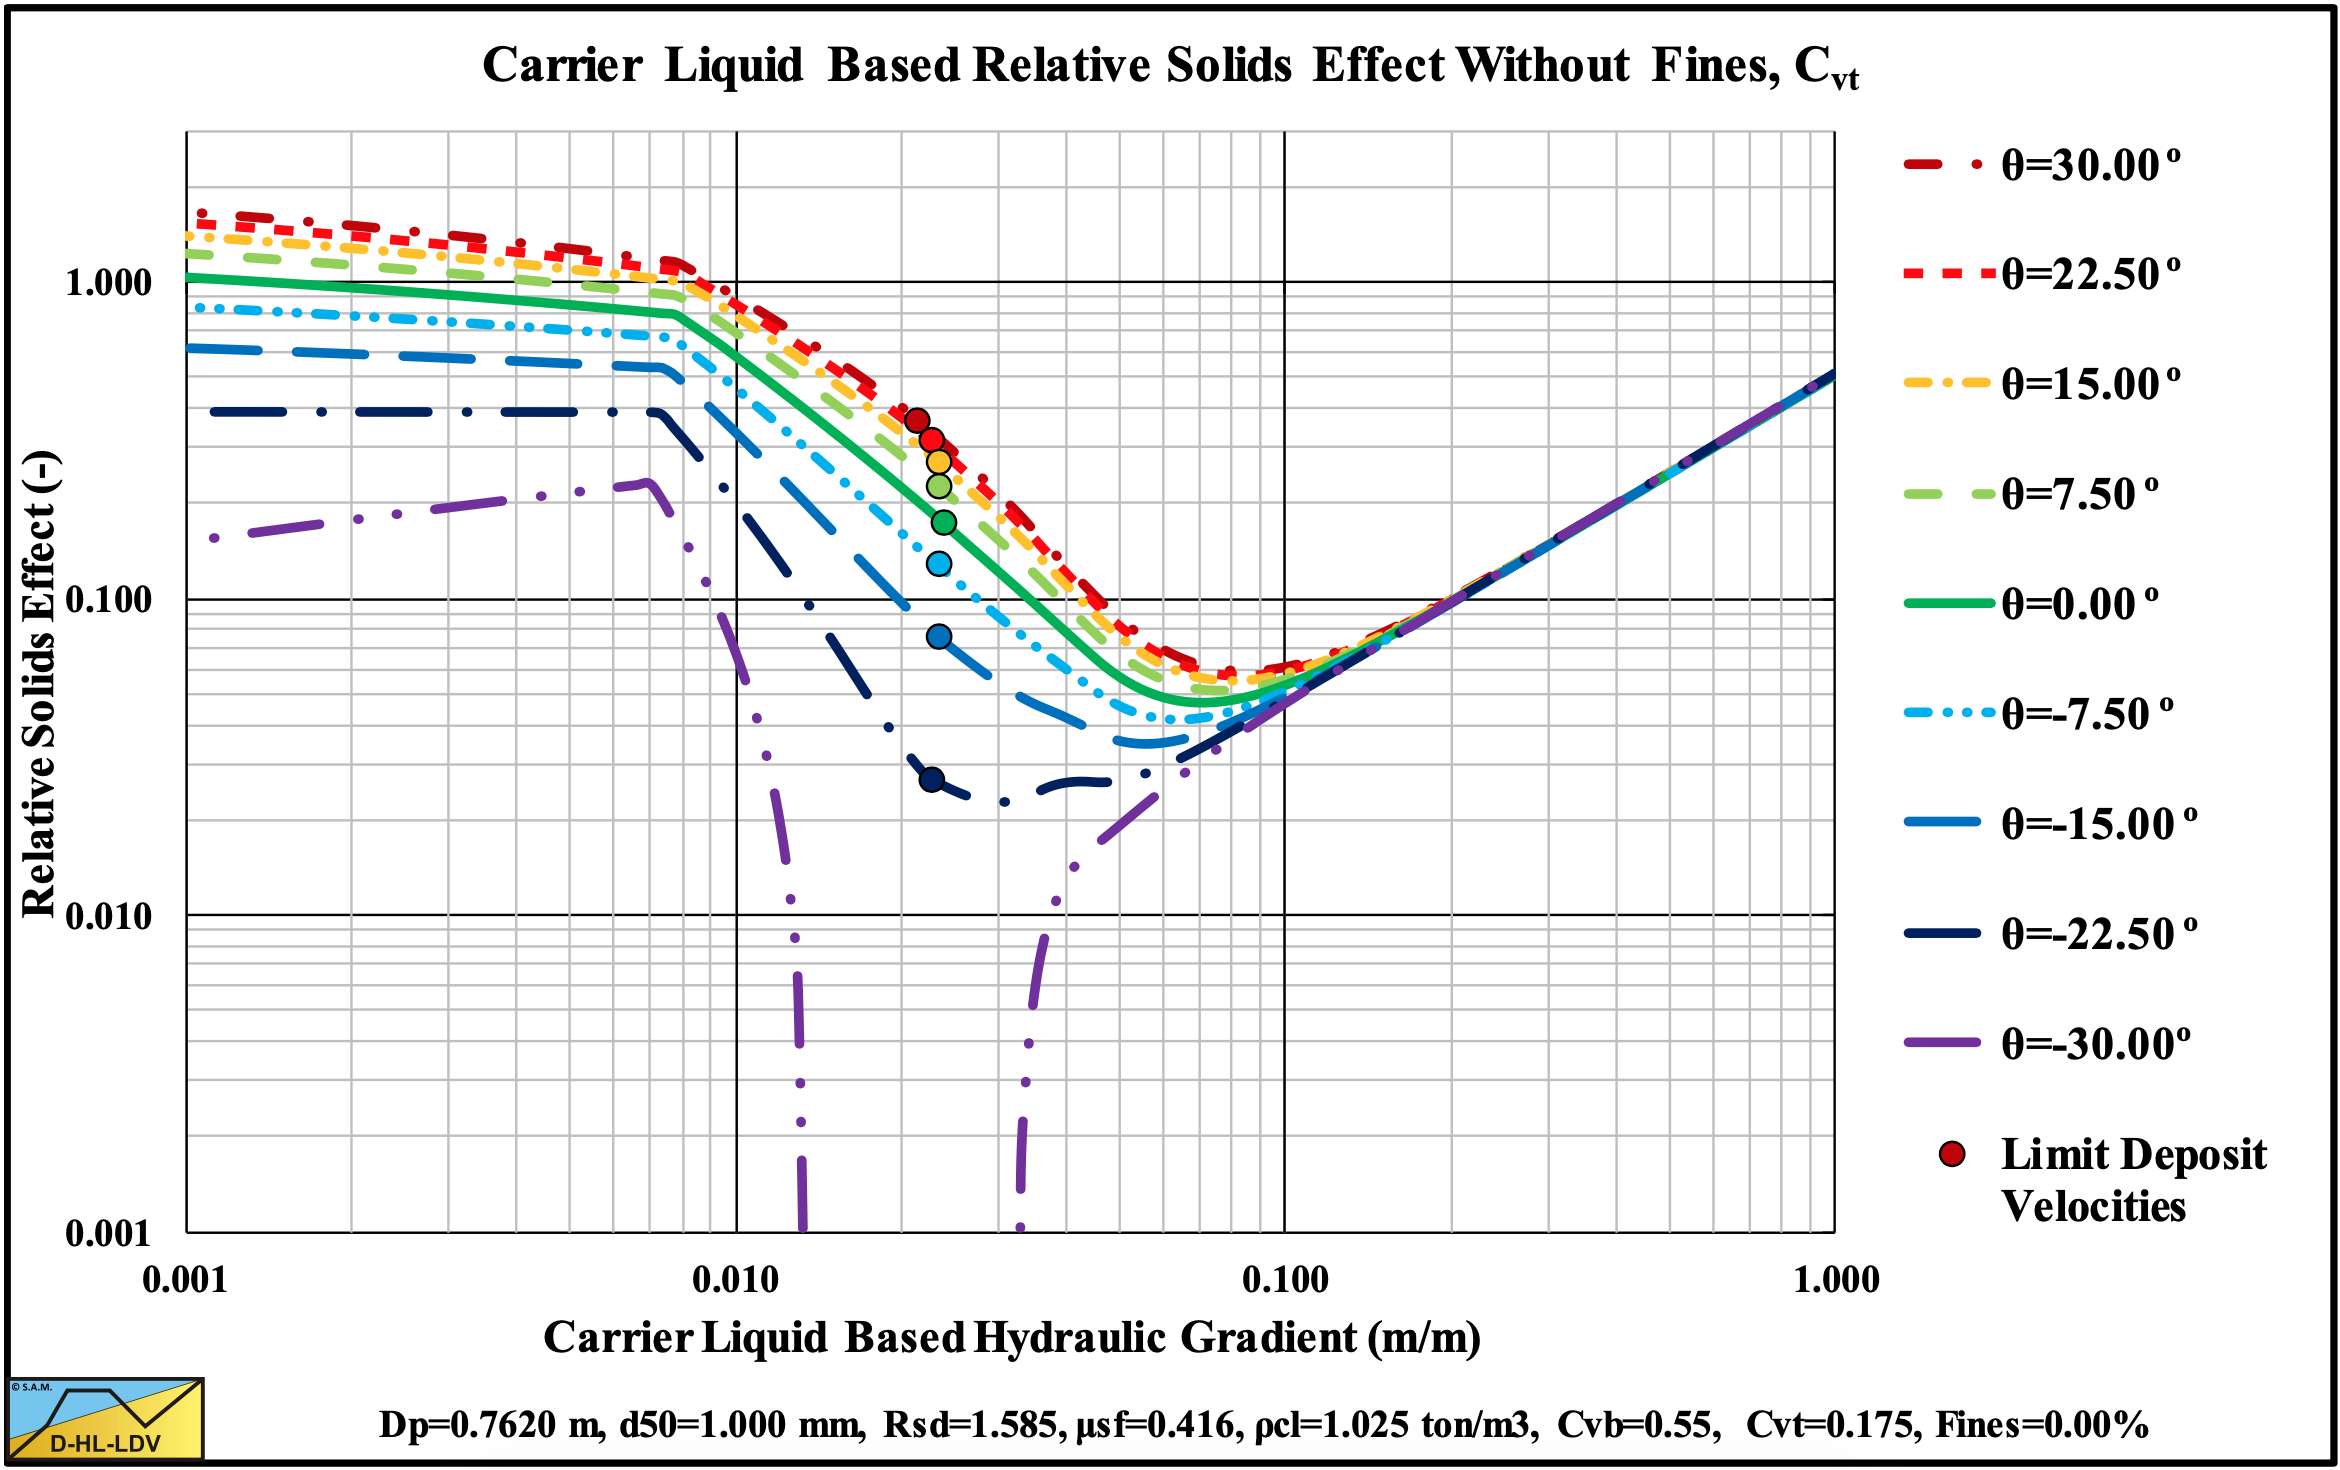
Figure 13.5-38: The relative excess hydraulic gradient versus the liquid hydraulic gradient for 9 inclination angles, Cvt.
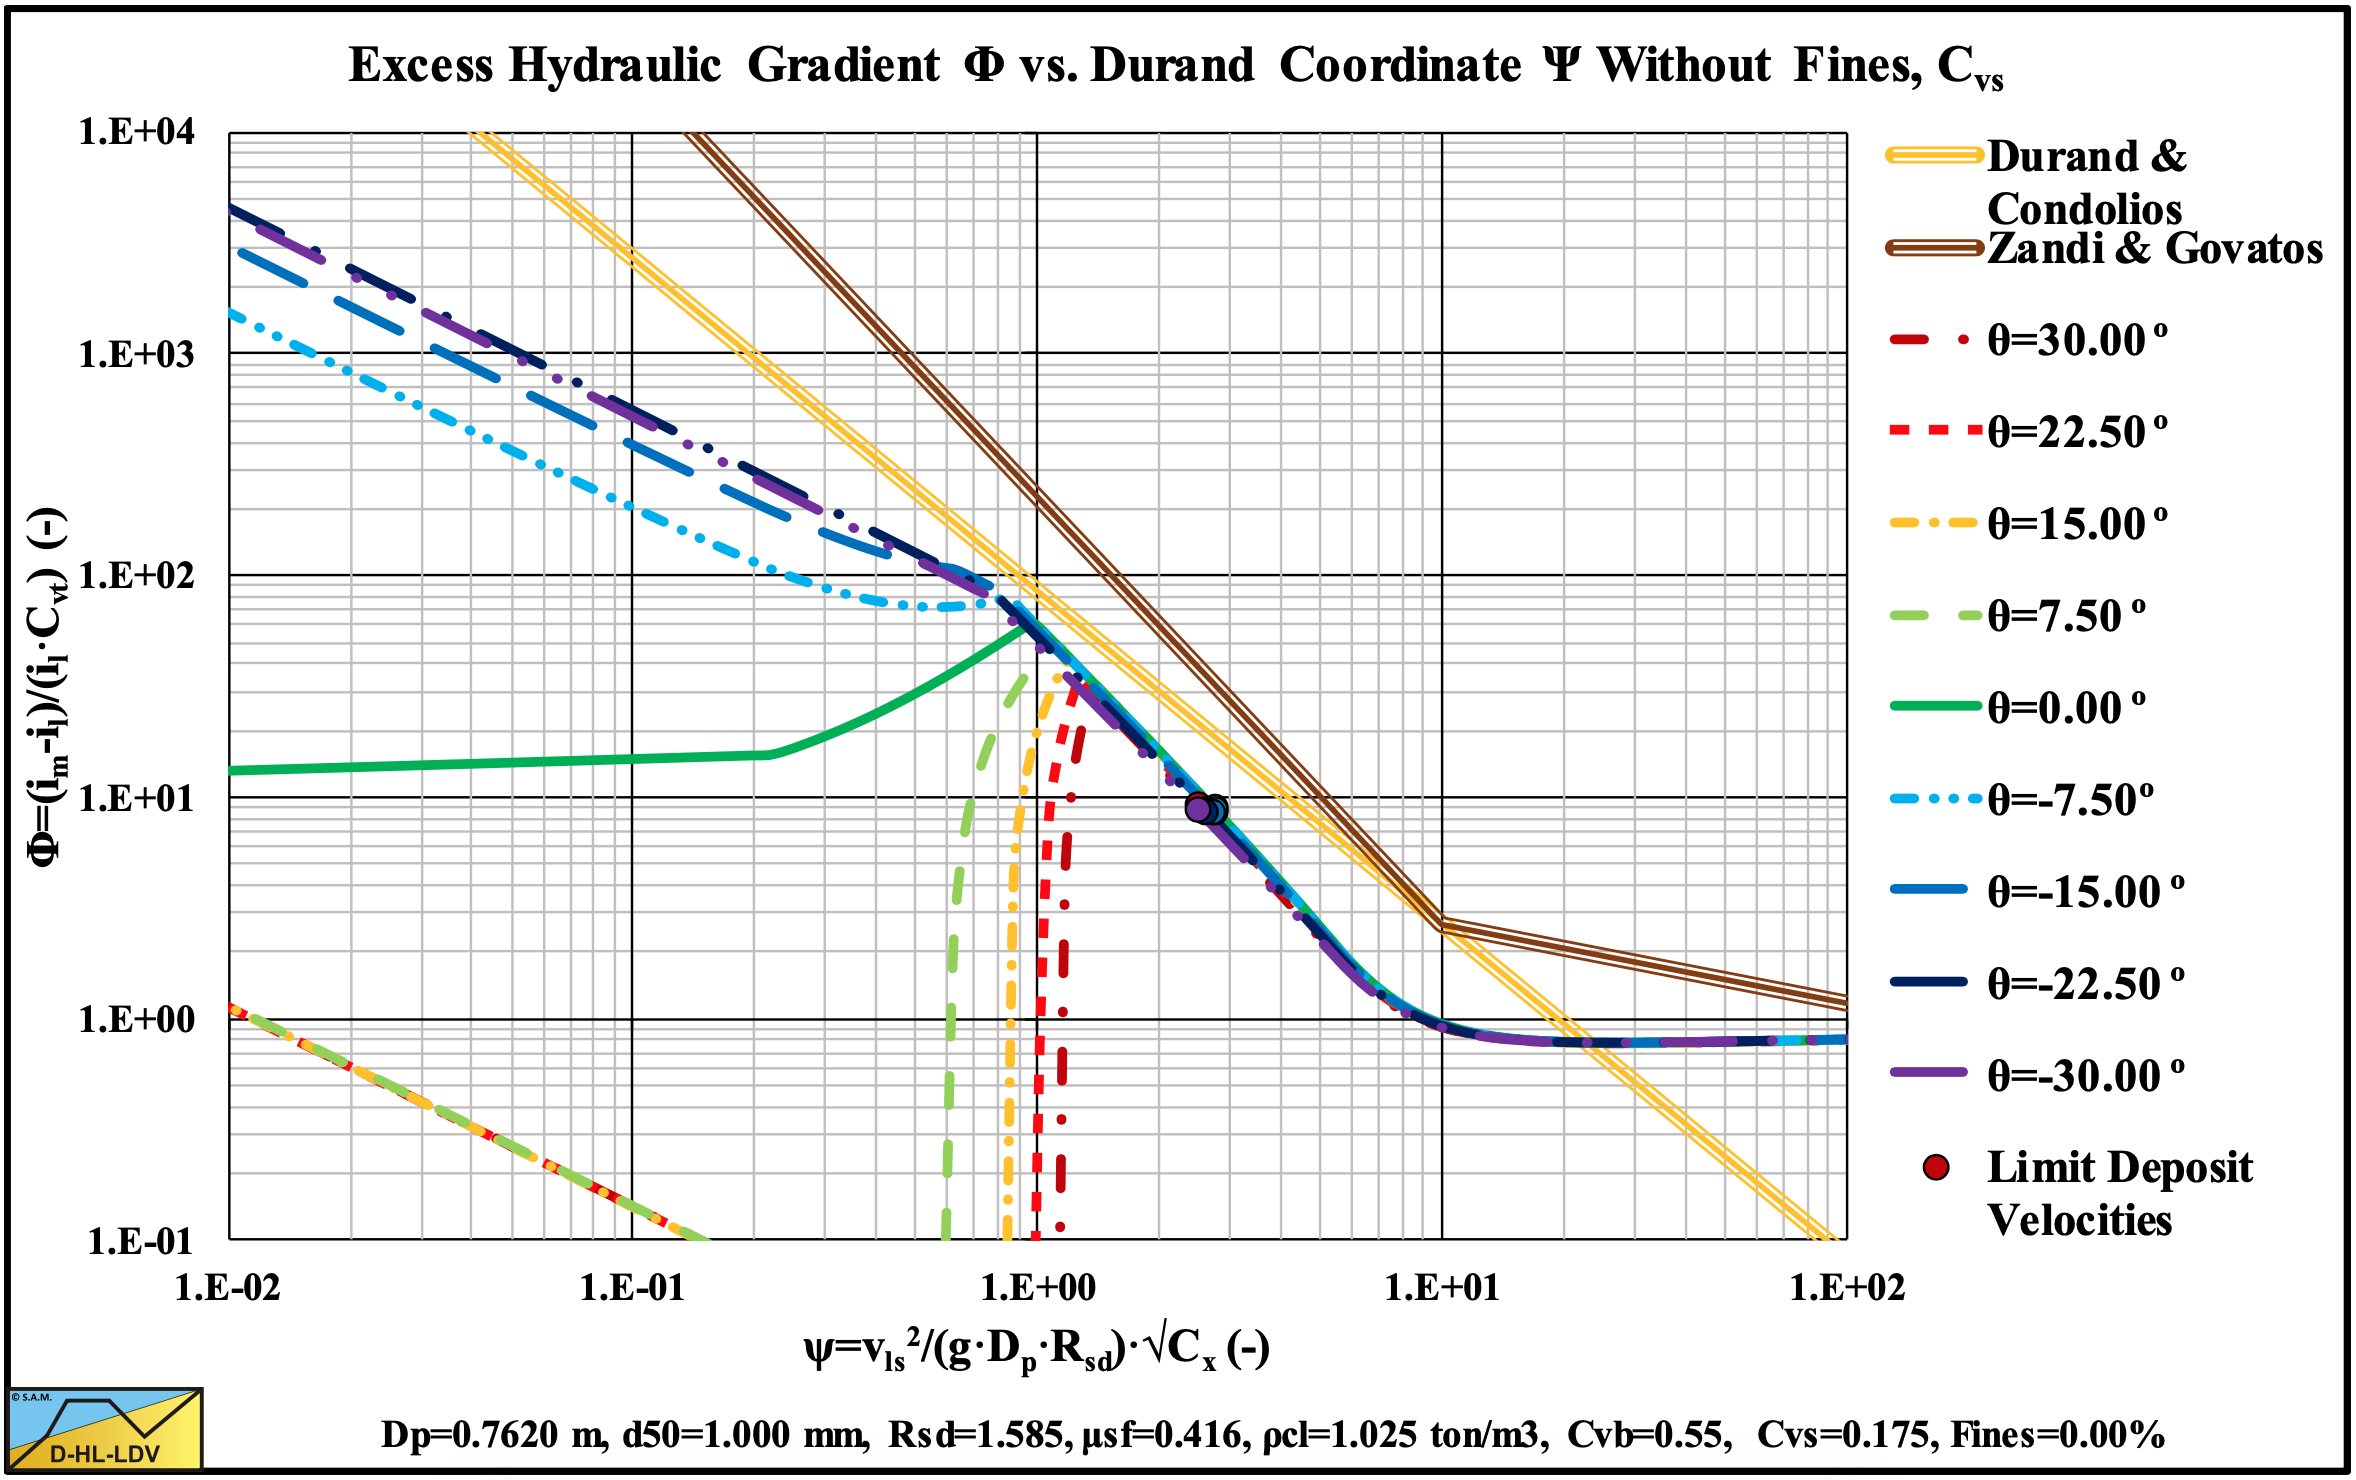
Figure 13.5-39: The hydraulic gradient on Durand coordinates for 9 inclination angles, Cvs.
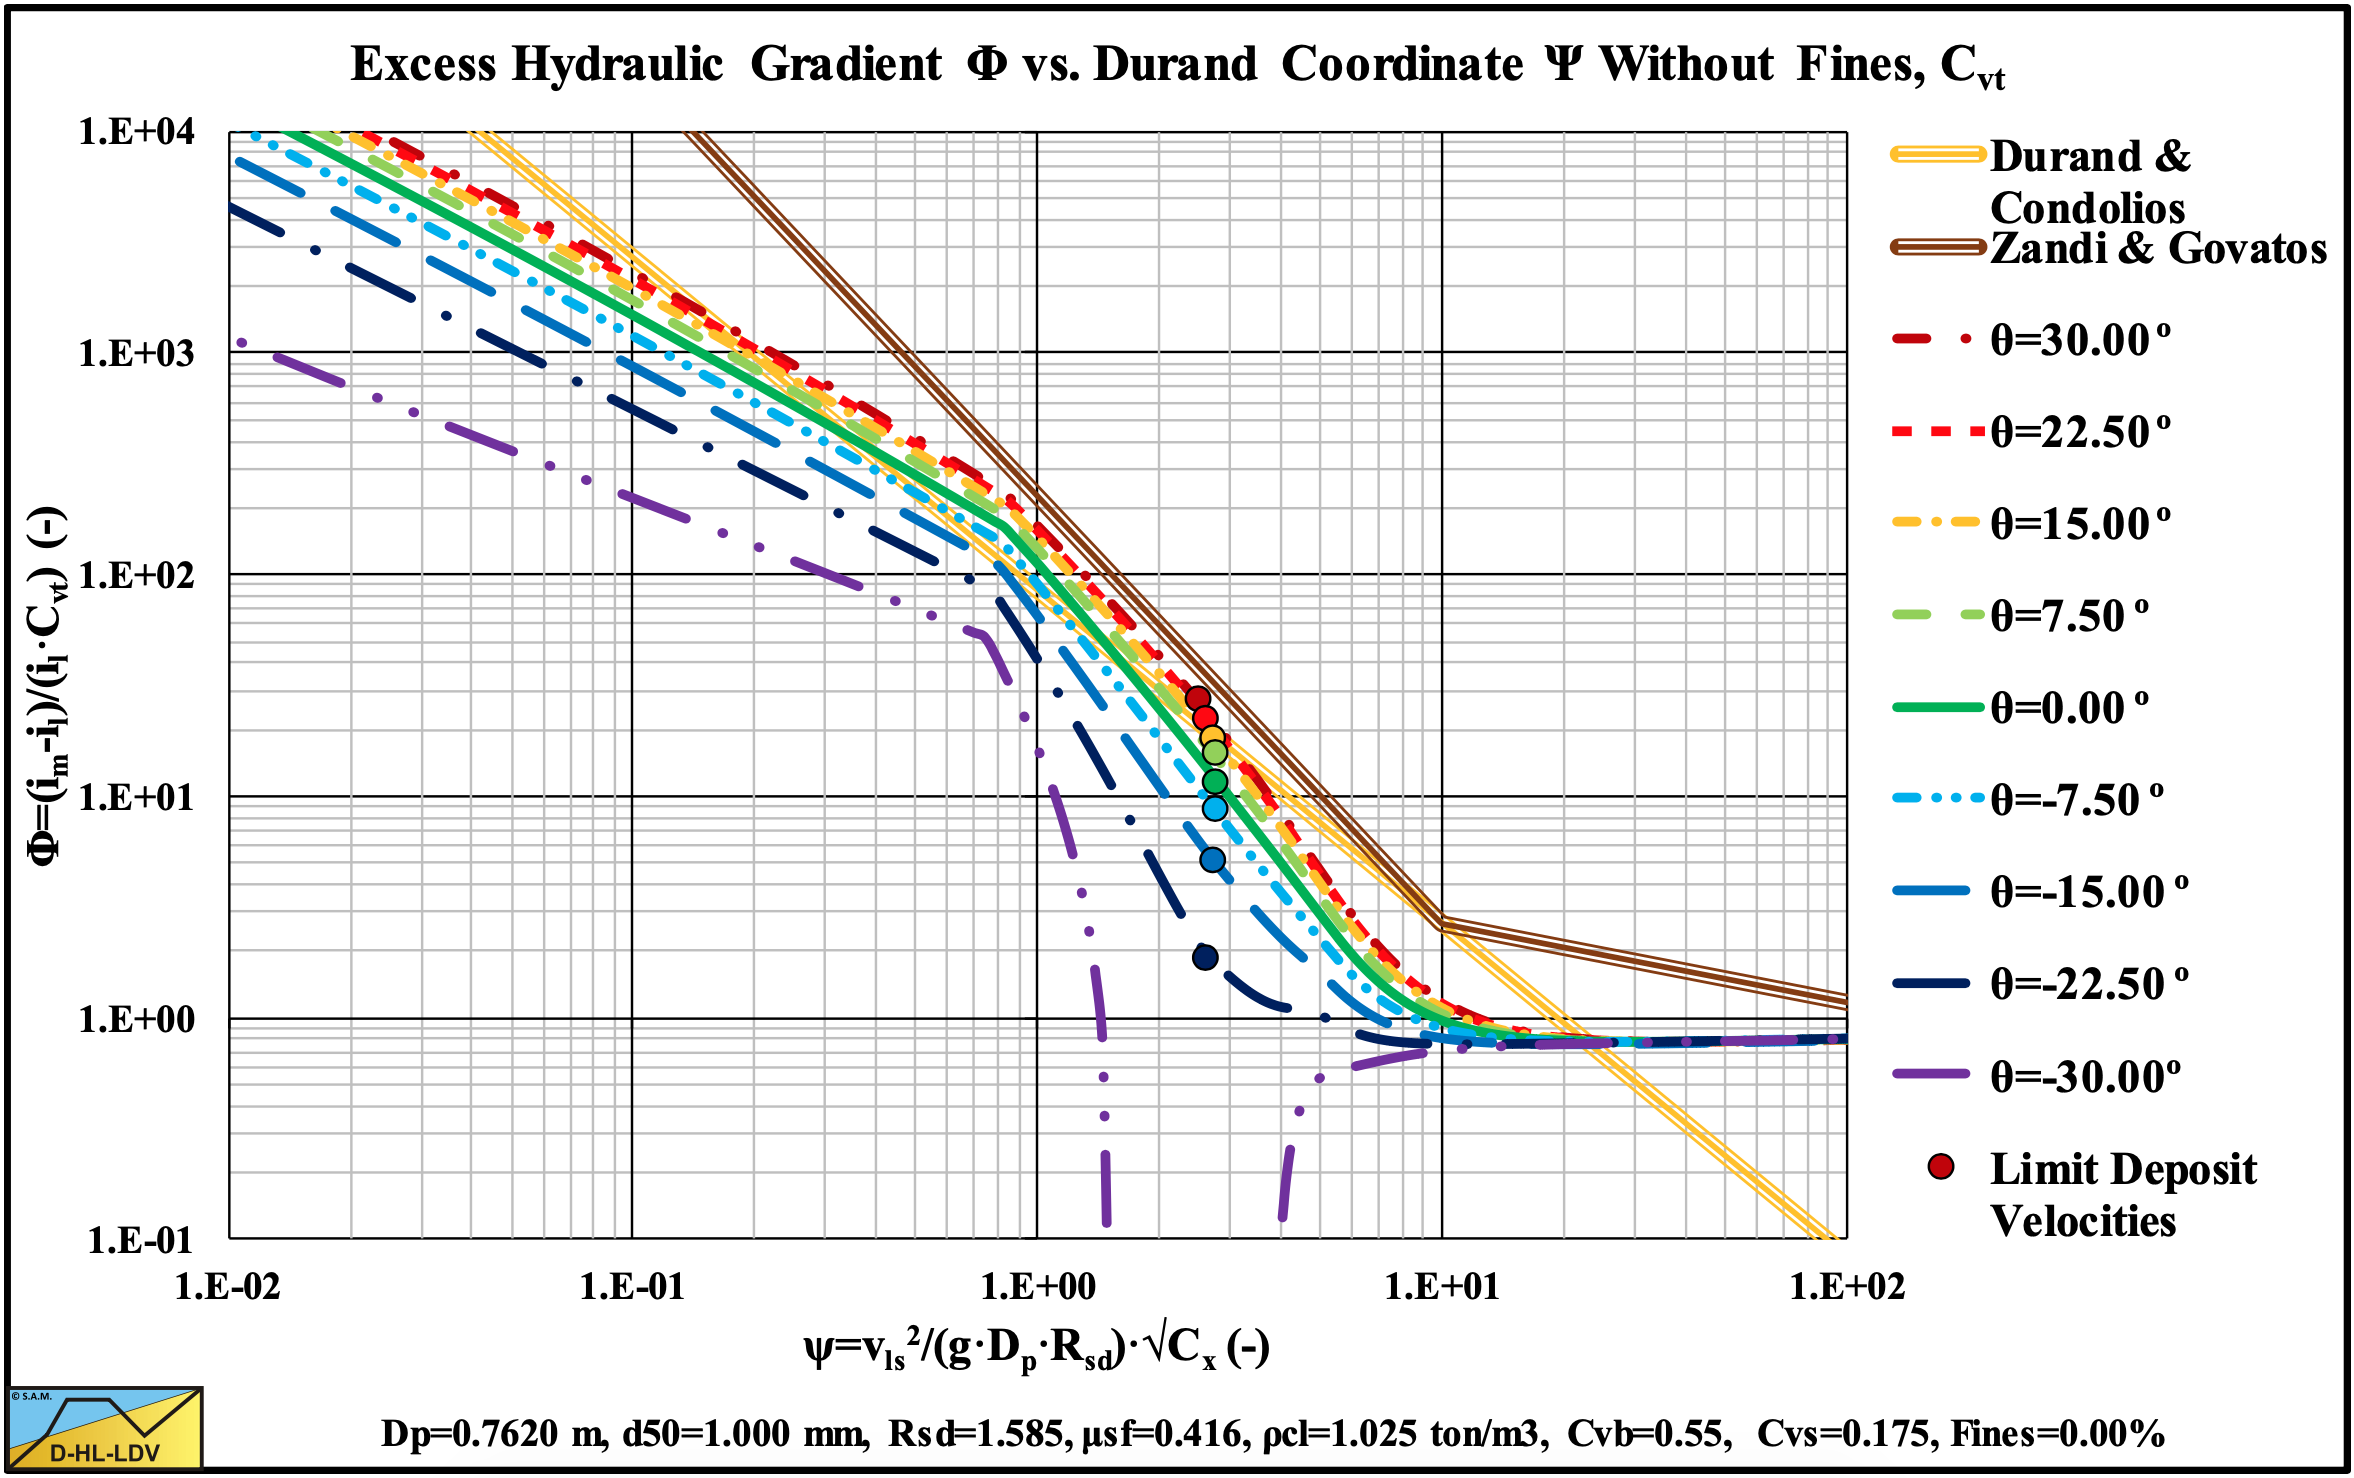
Figure 13.5-40: The hydraulic gradient on Durand coordinates for 9 inclination angles, Cvt.
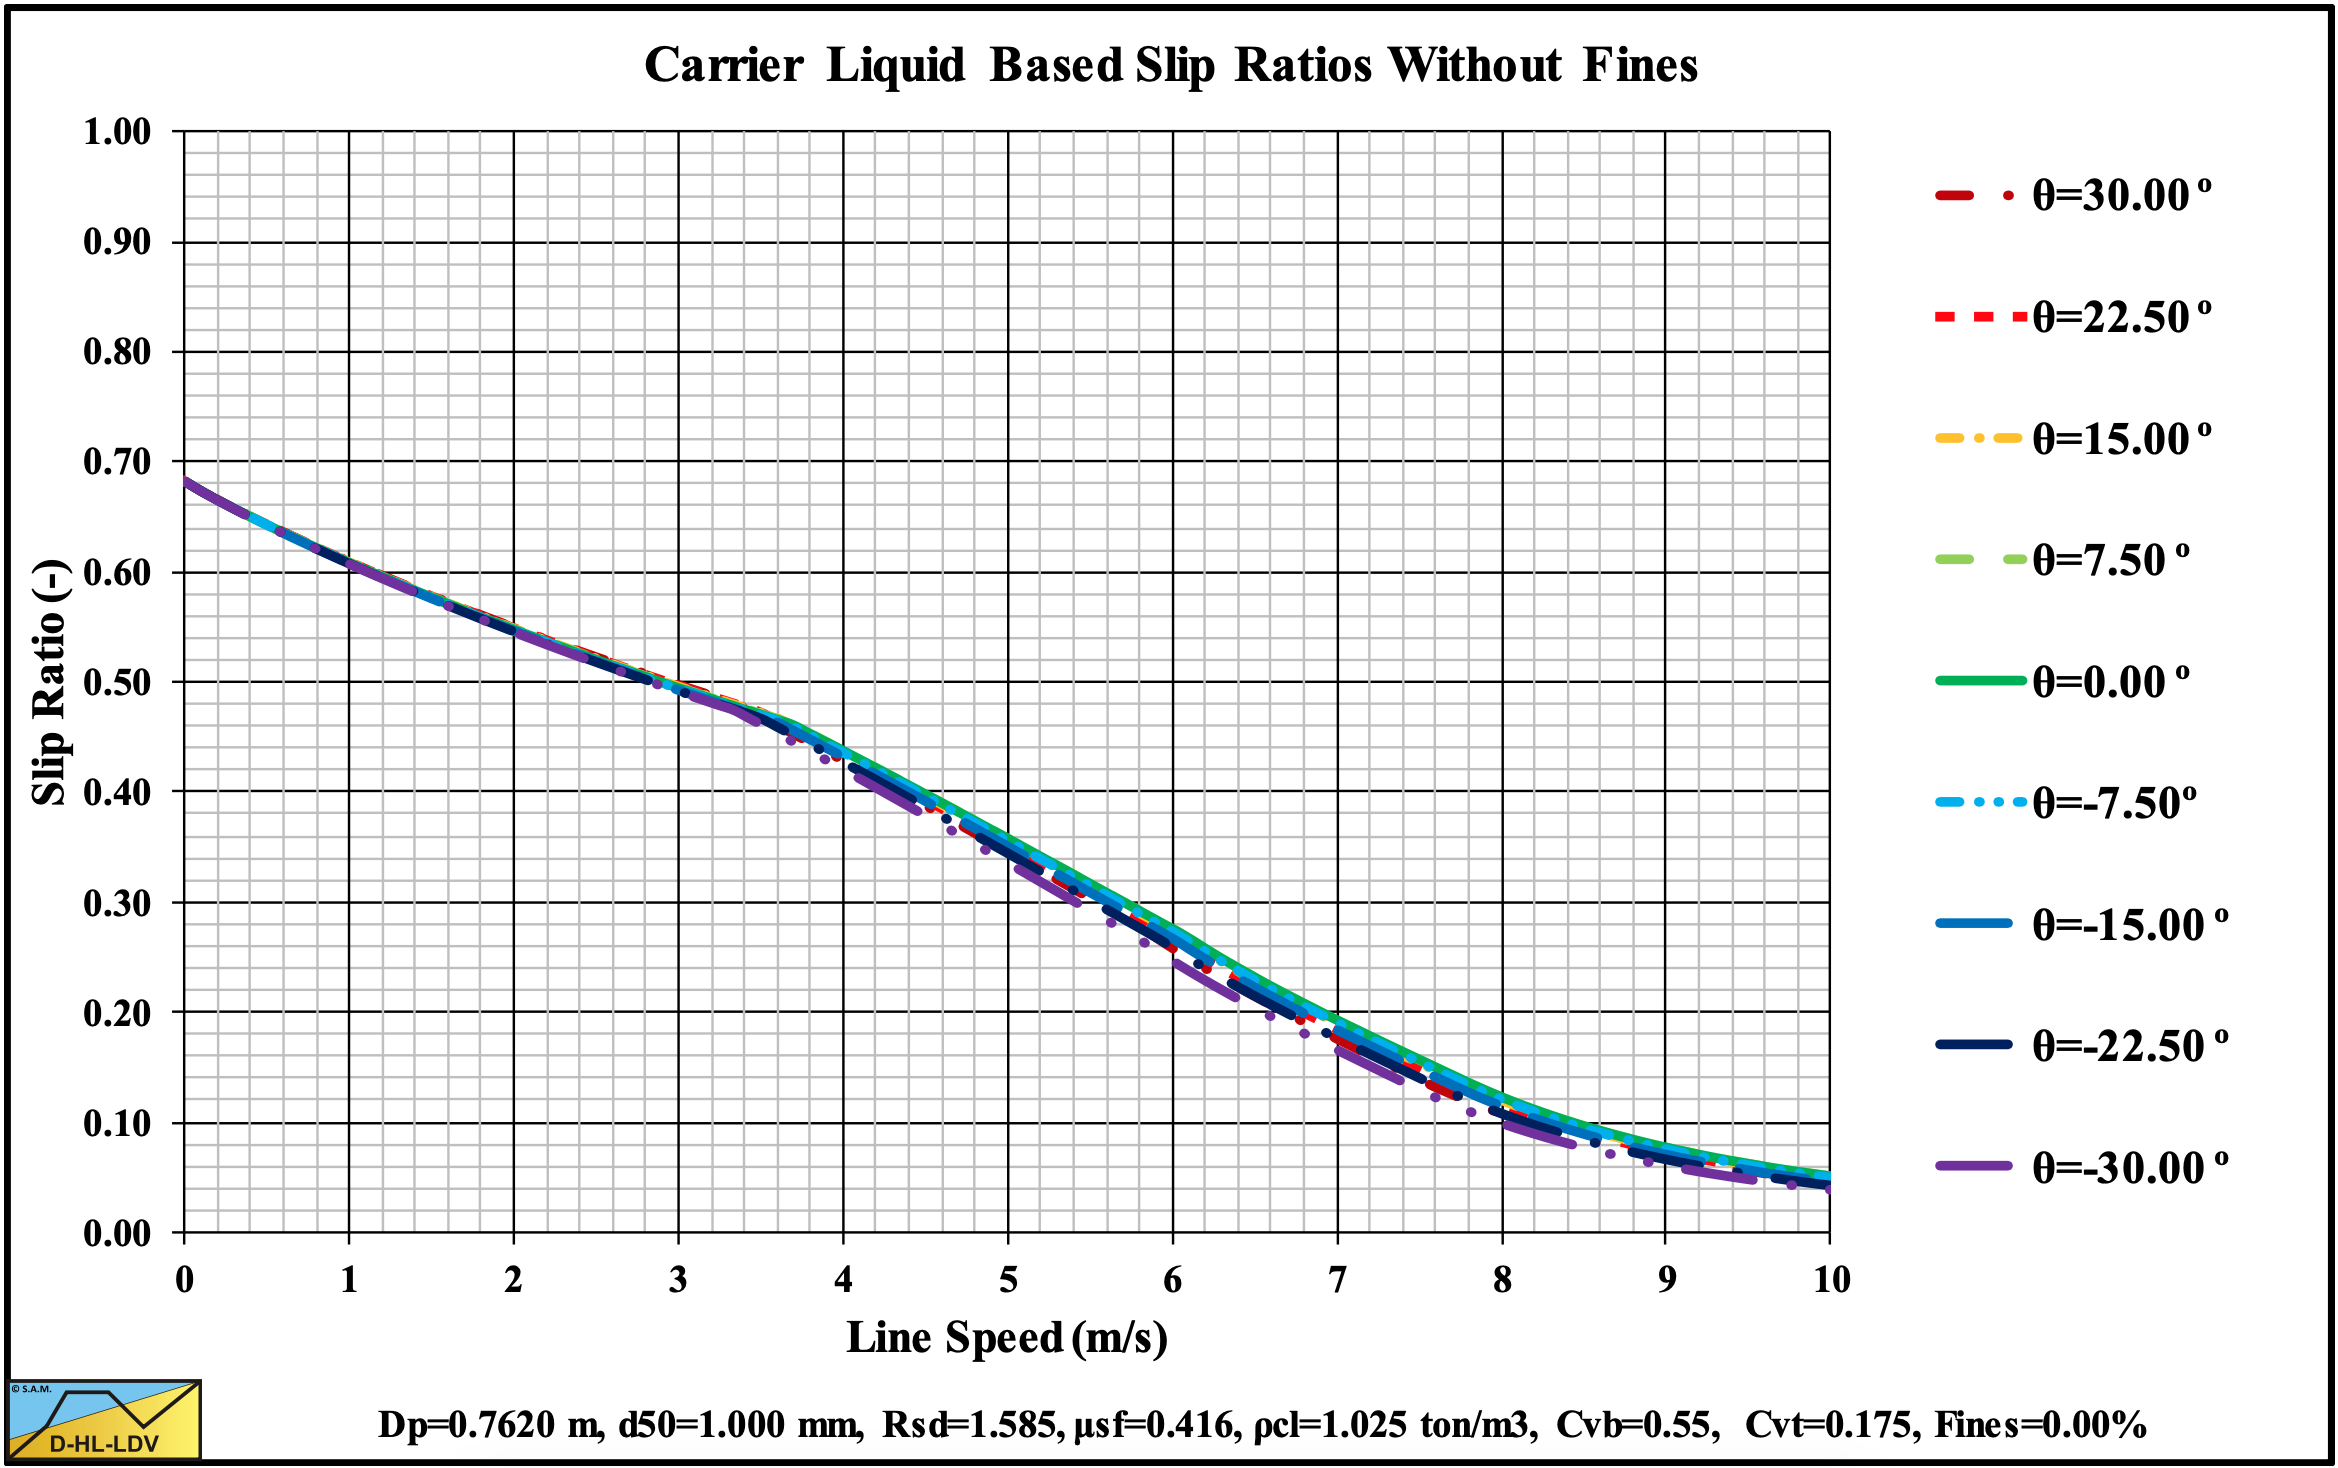
Figure 13.5-41: The slip ratio for 9 inclination angles.
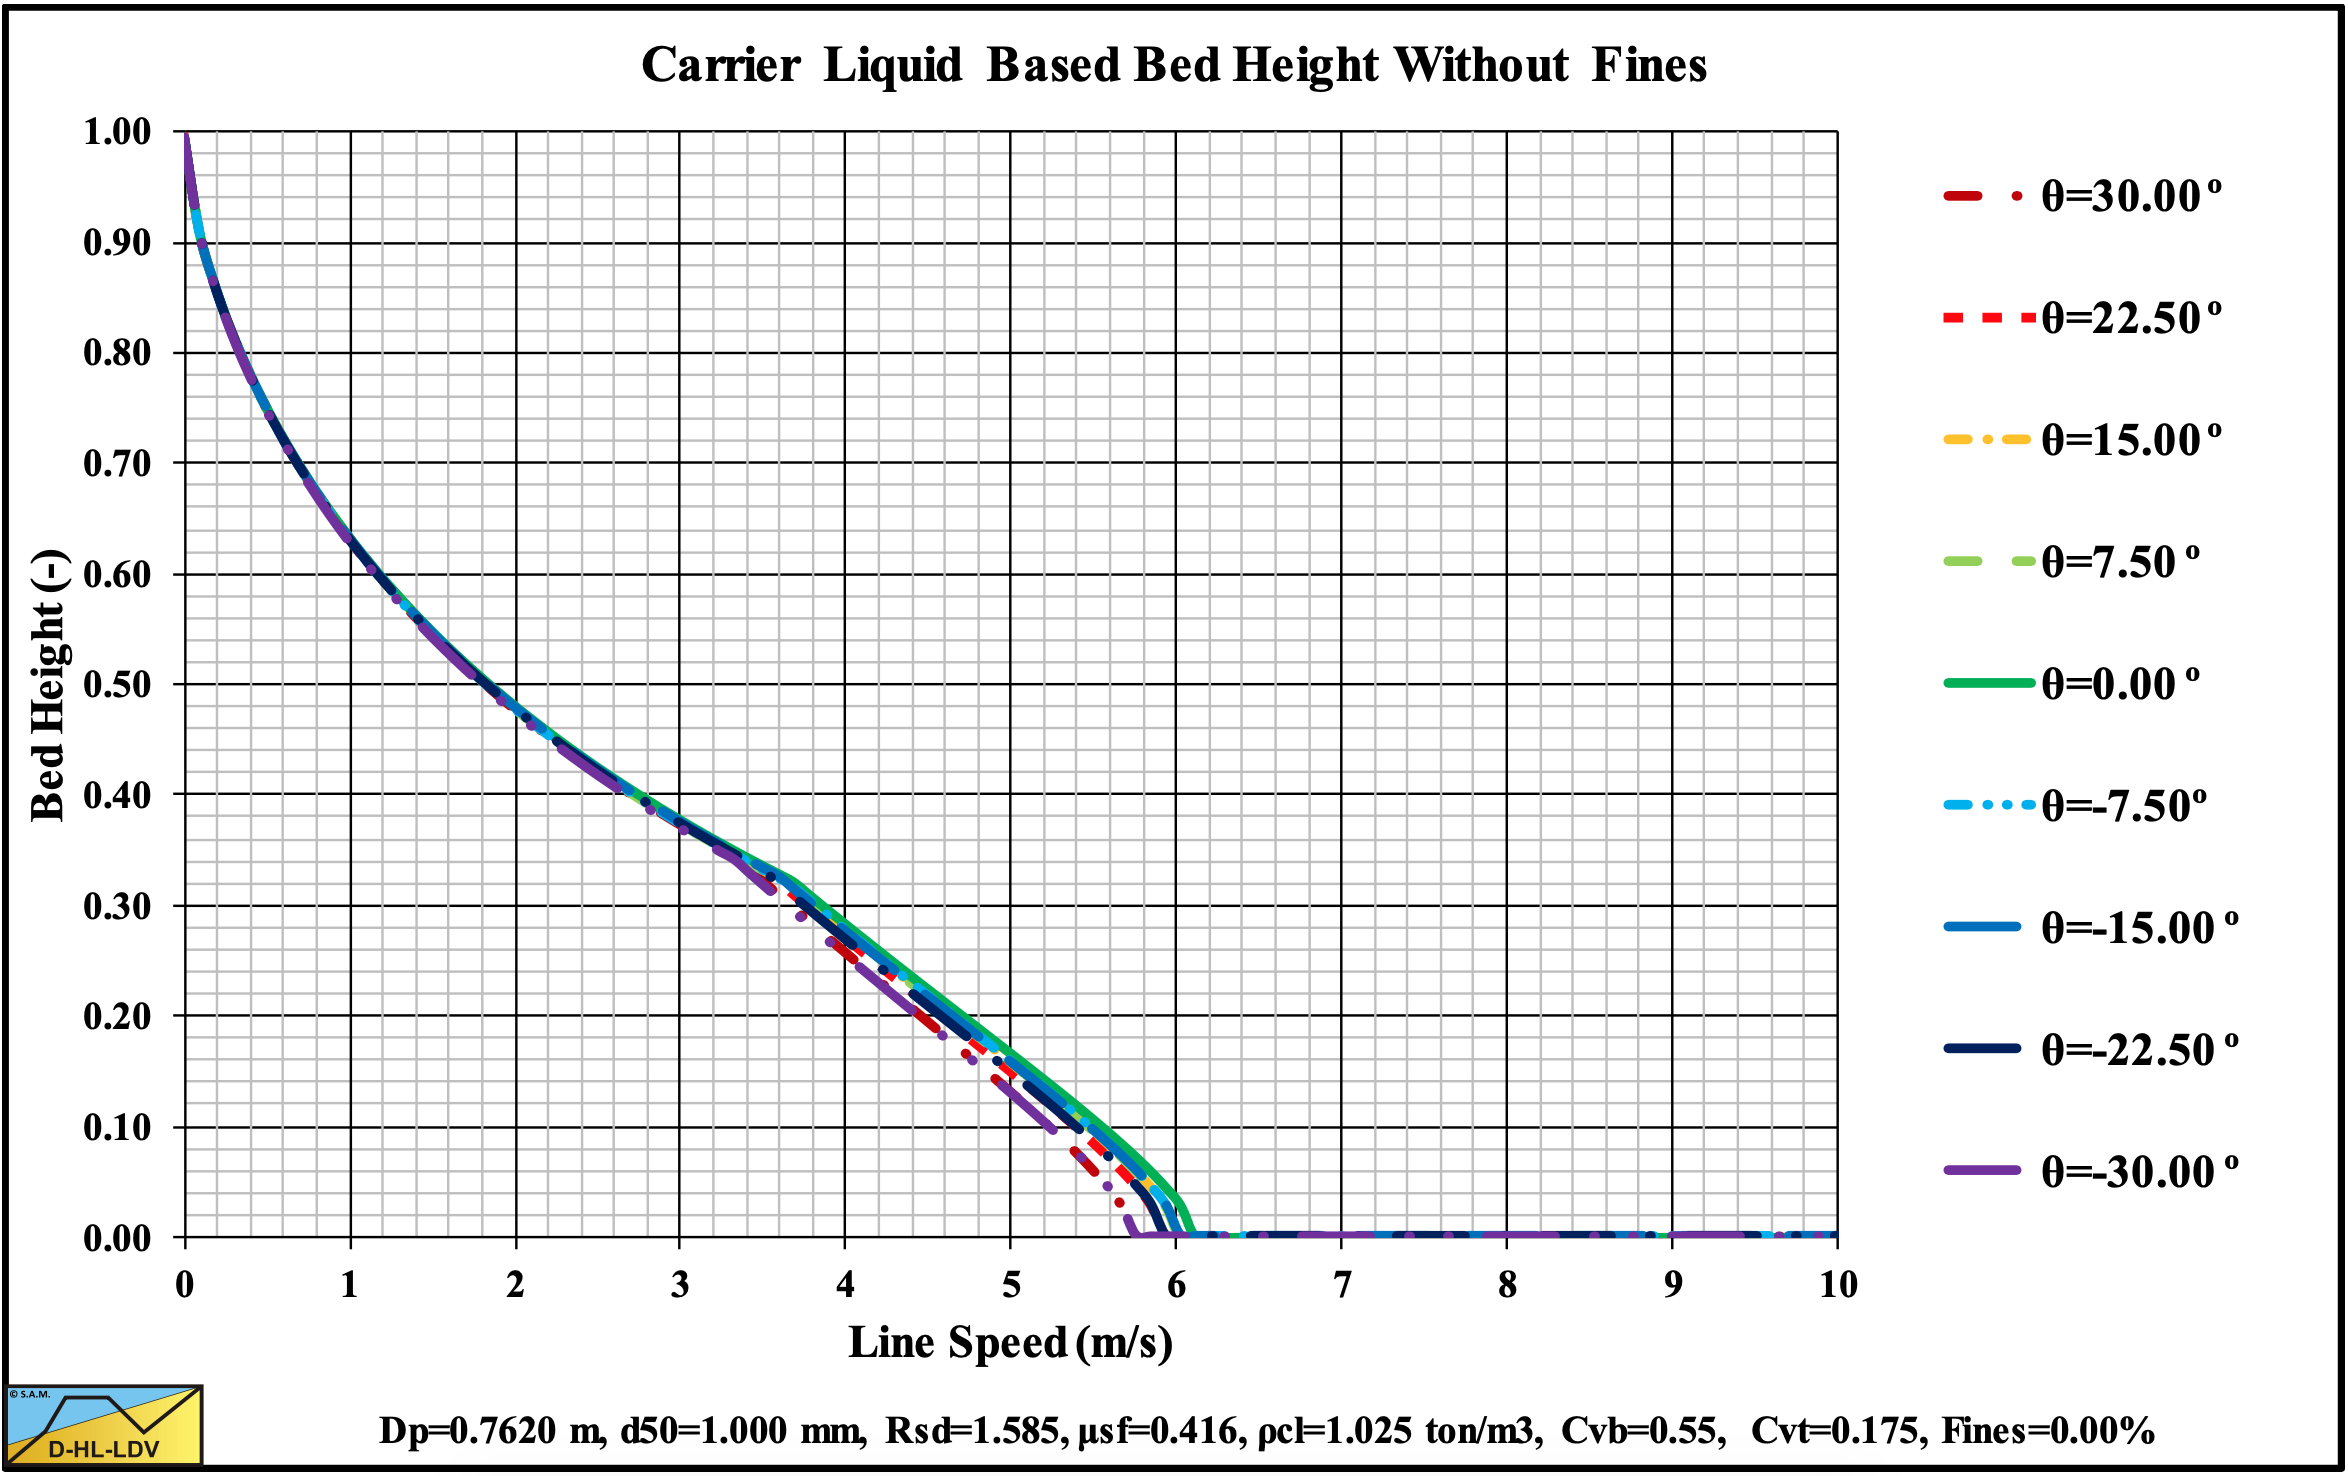
Figure 13.5-42: The bed height for 9 inclination angles.
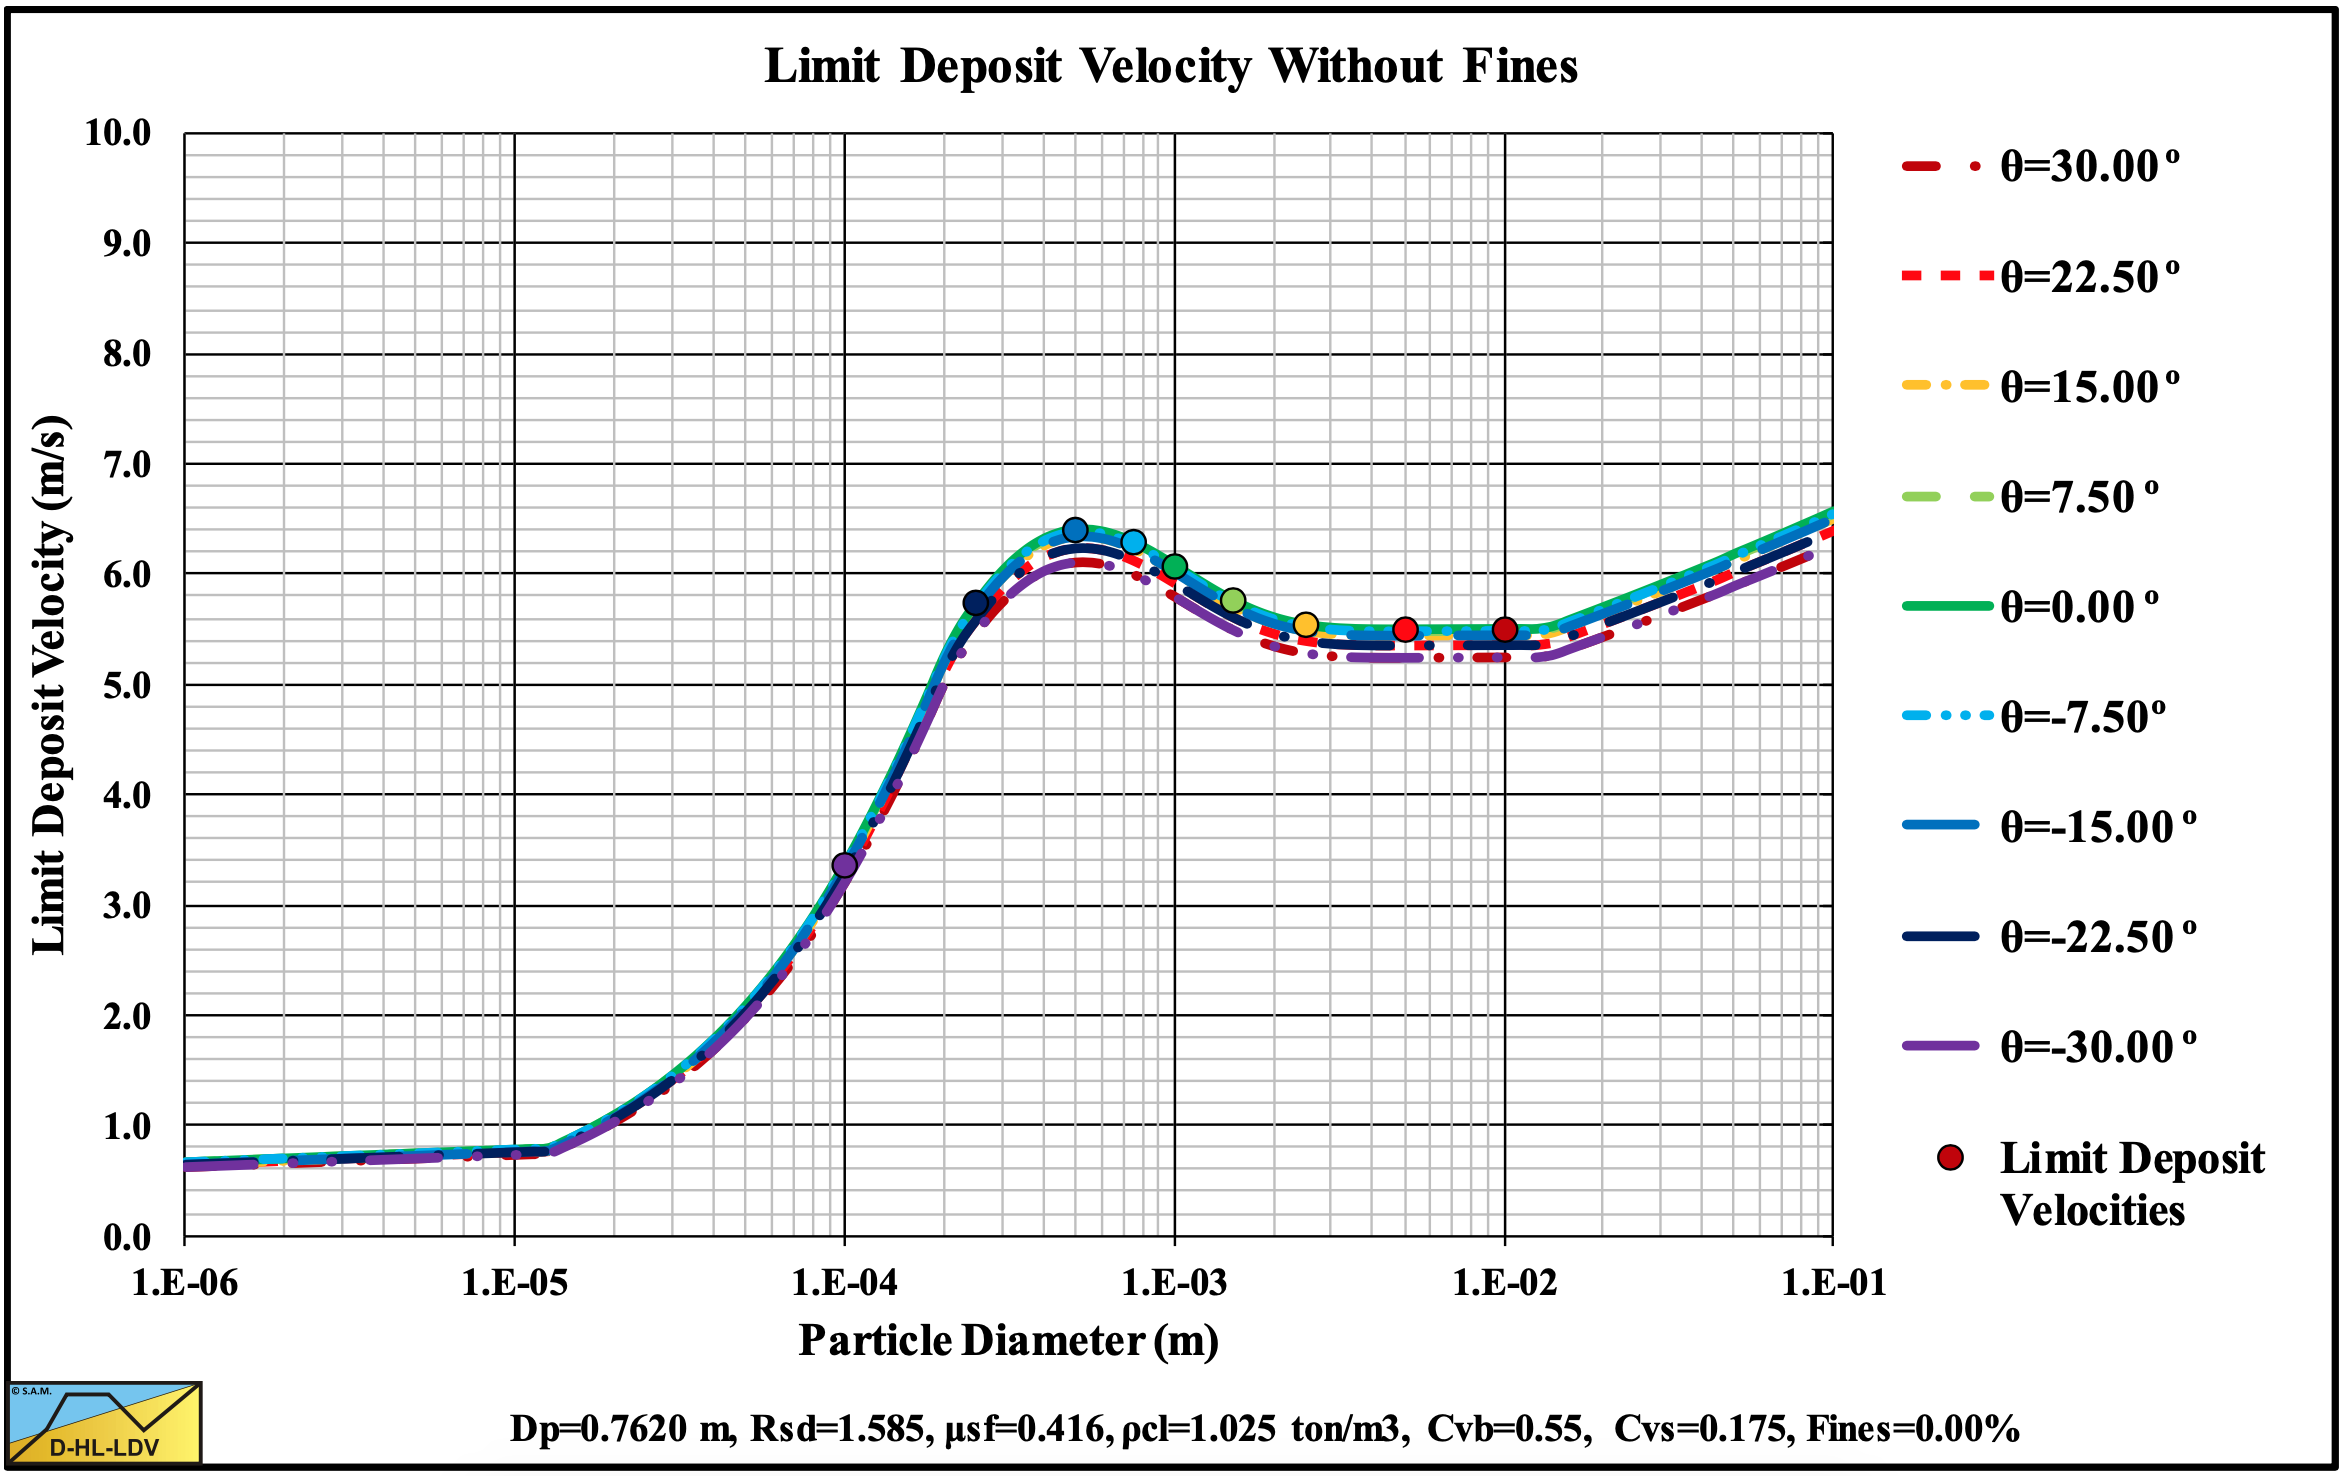
Figure 13.5-43: The Limit Deposit Velocity versus the particle diameter for 9 inclination angles.
13.5.6 9 Solids Densities
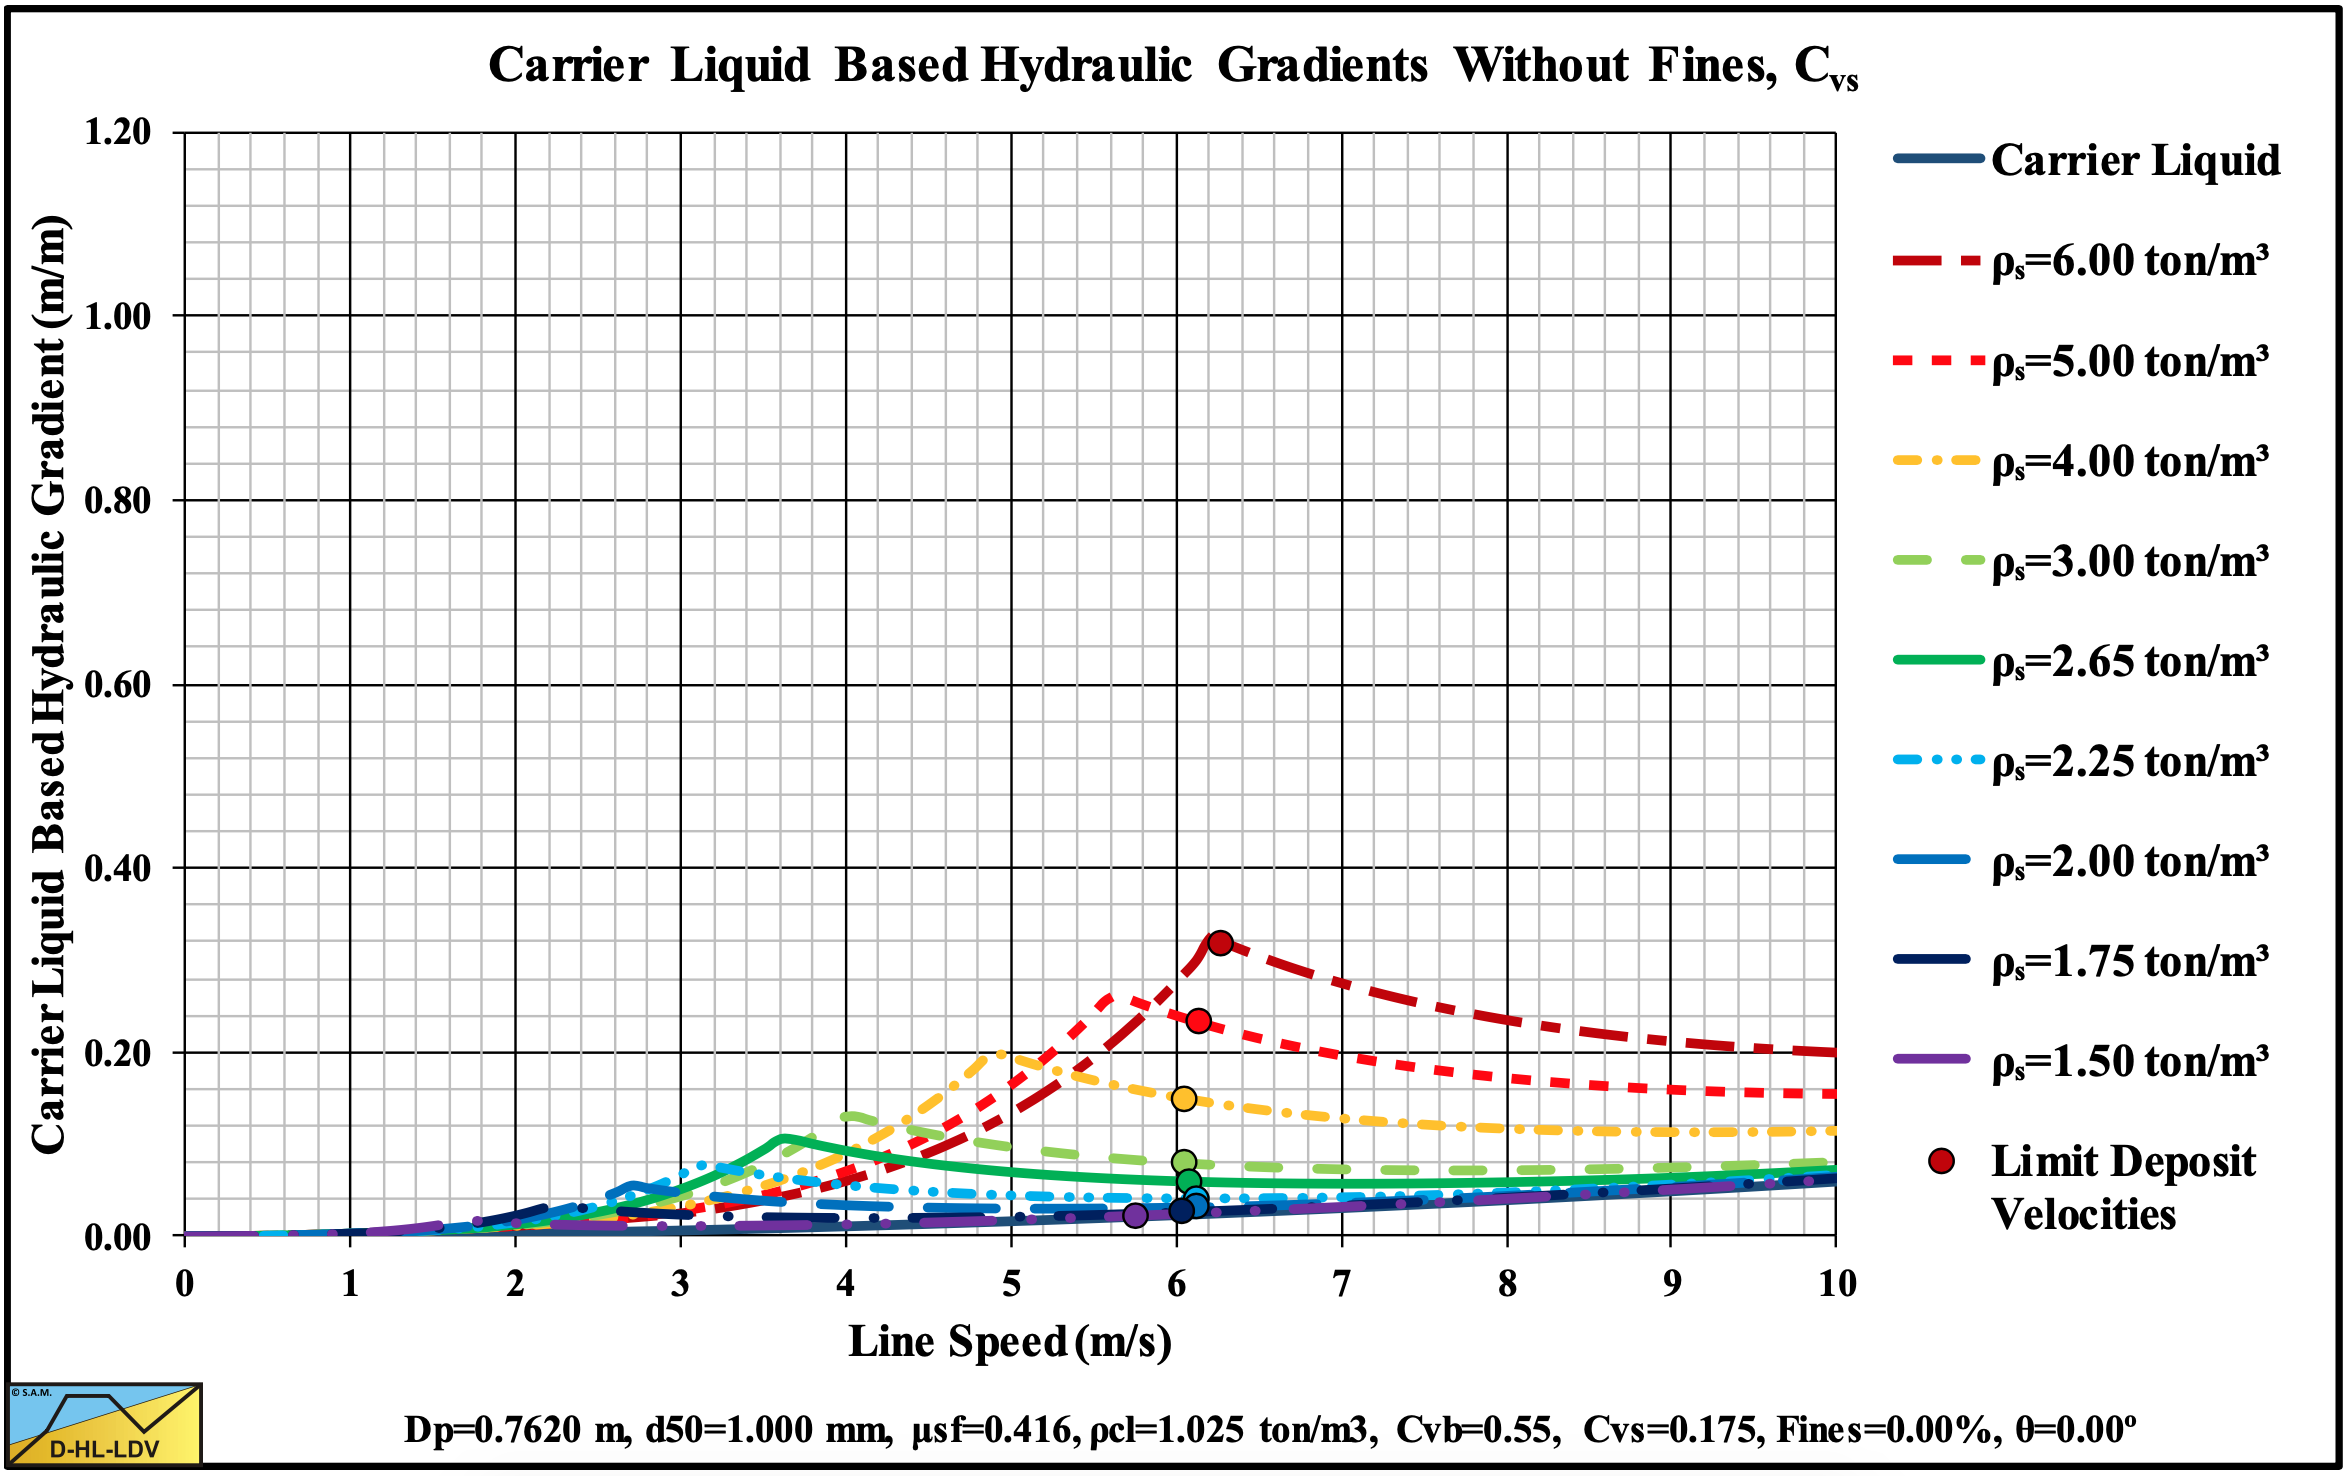
Figure 13.5-44: The hydraulic gradient versus the line speed for 9 solids densities, Cvs.
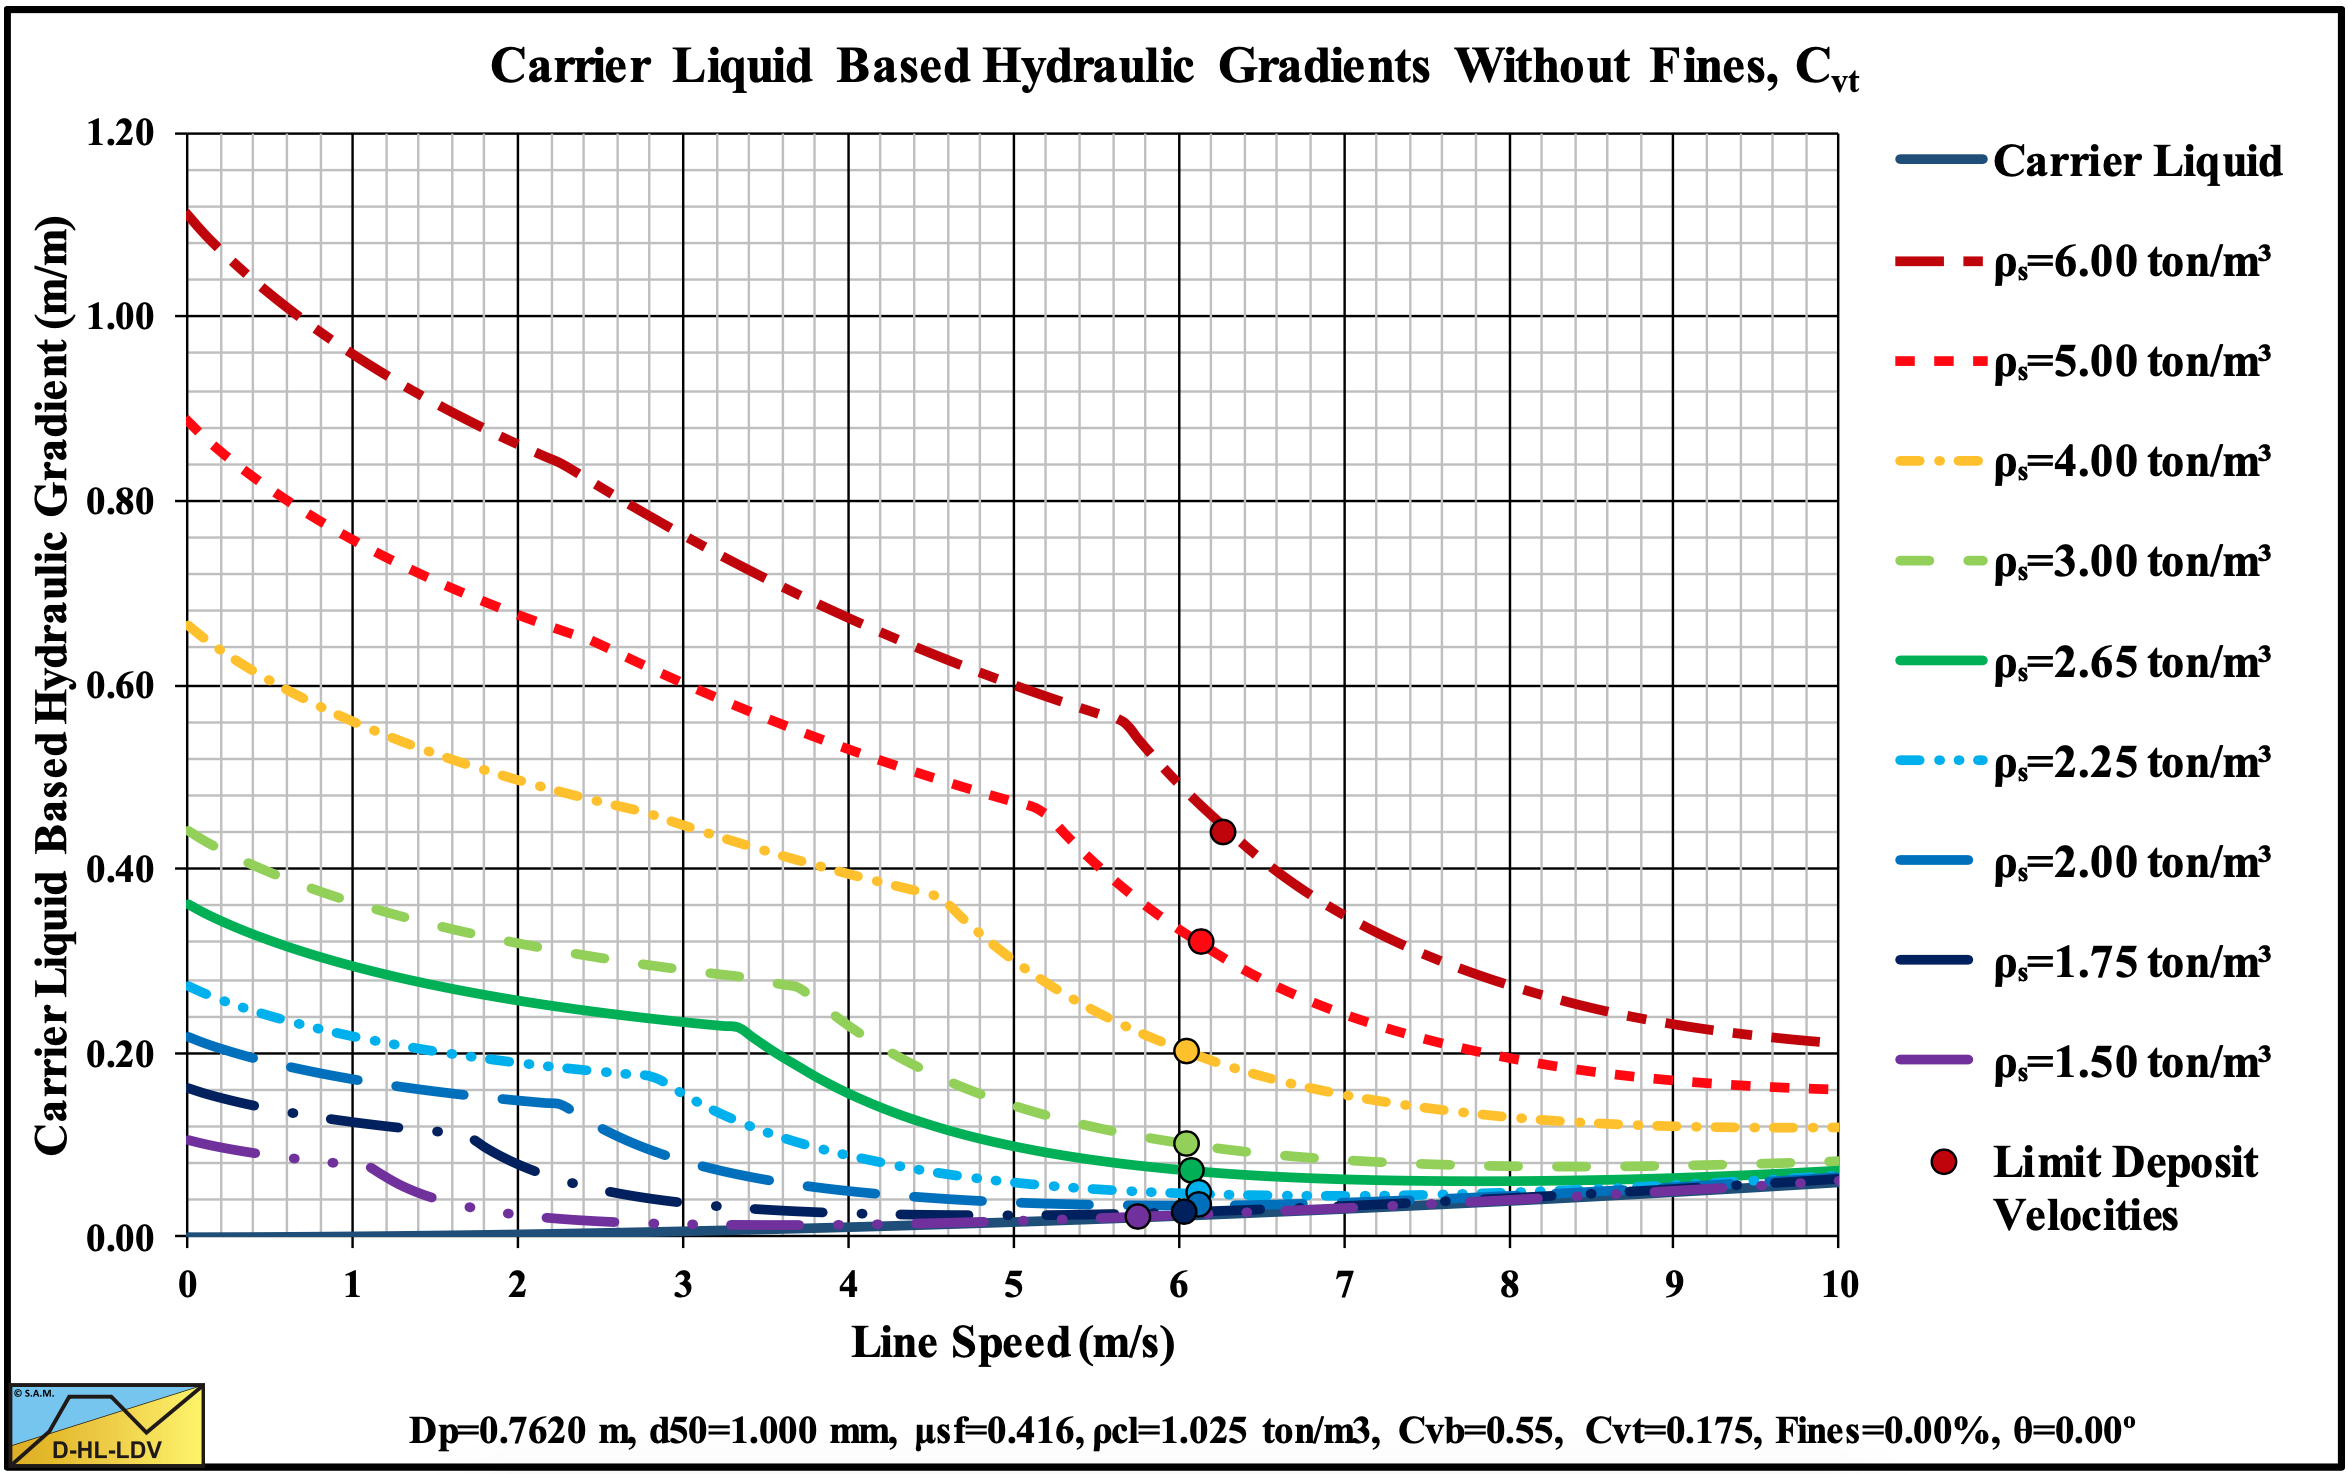
Figure 13.5-45: The hydraulic gradient versus the line speed for 9 solids densities, Cvt.
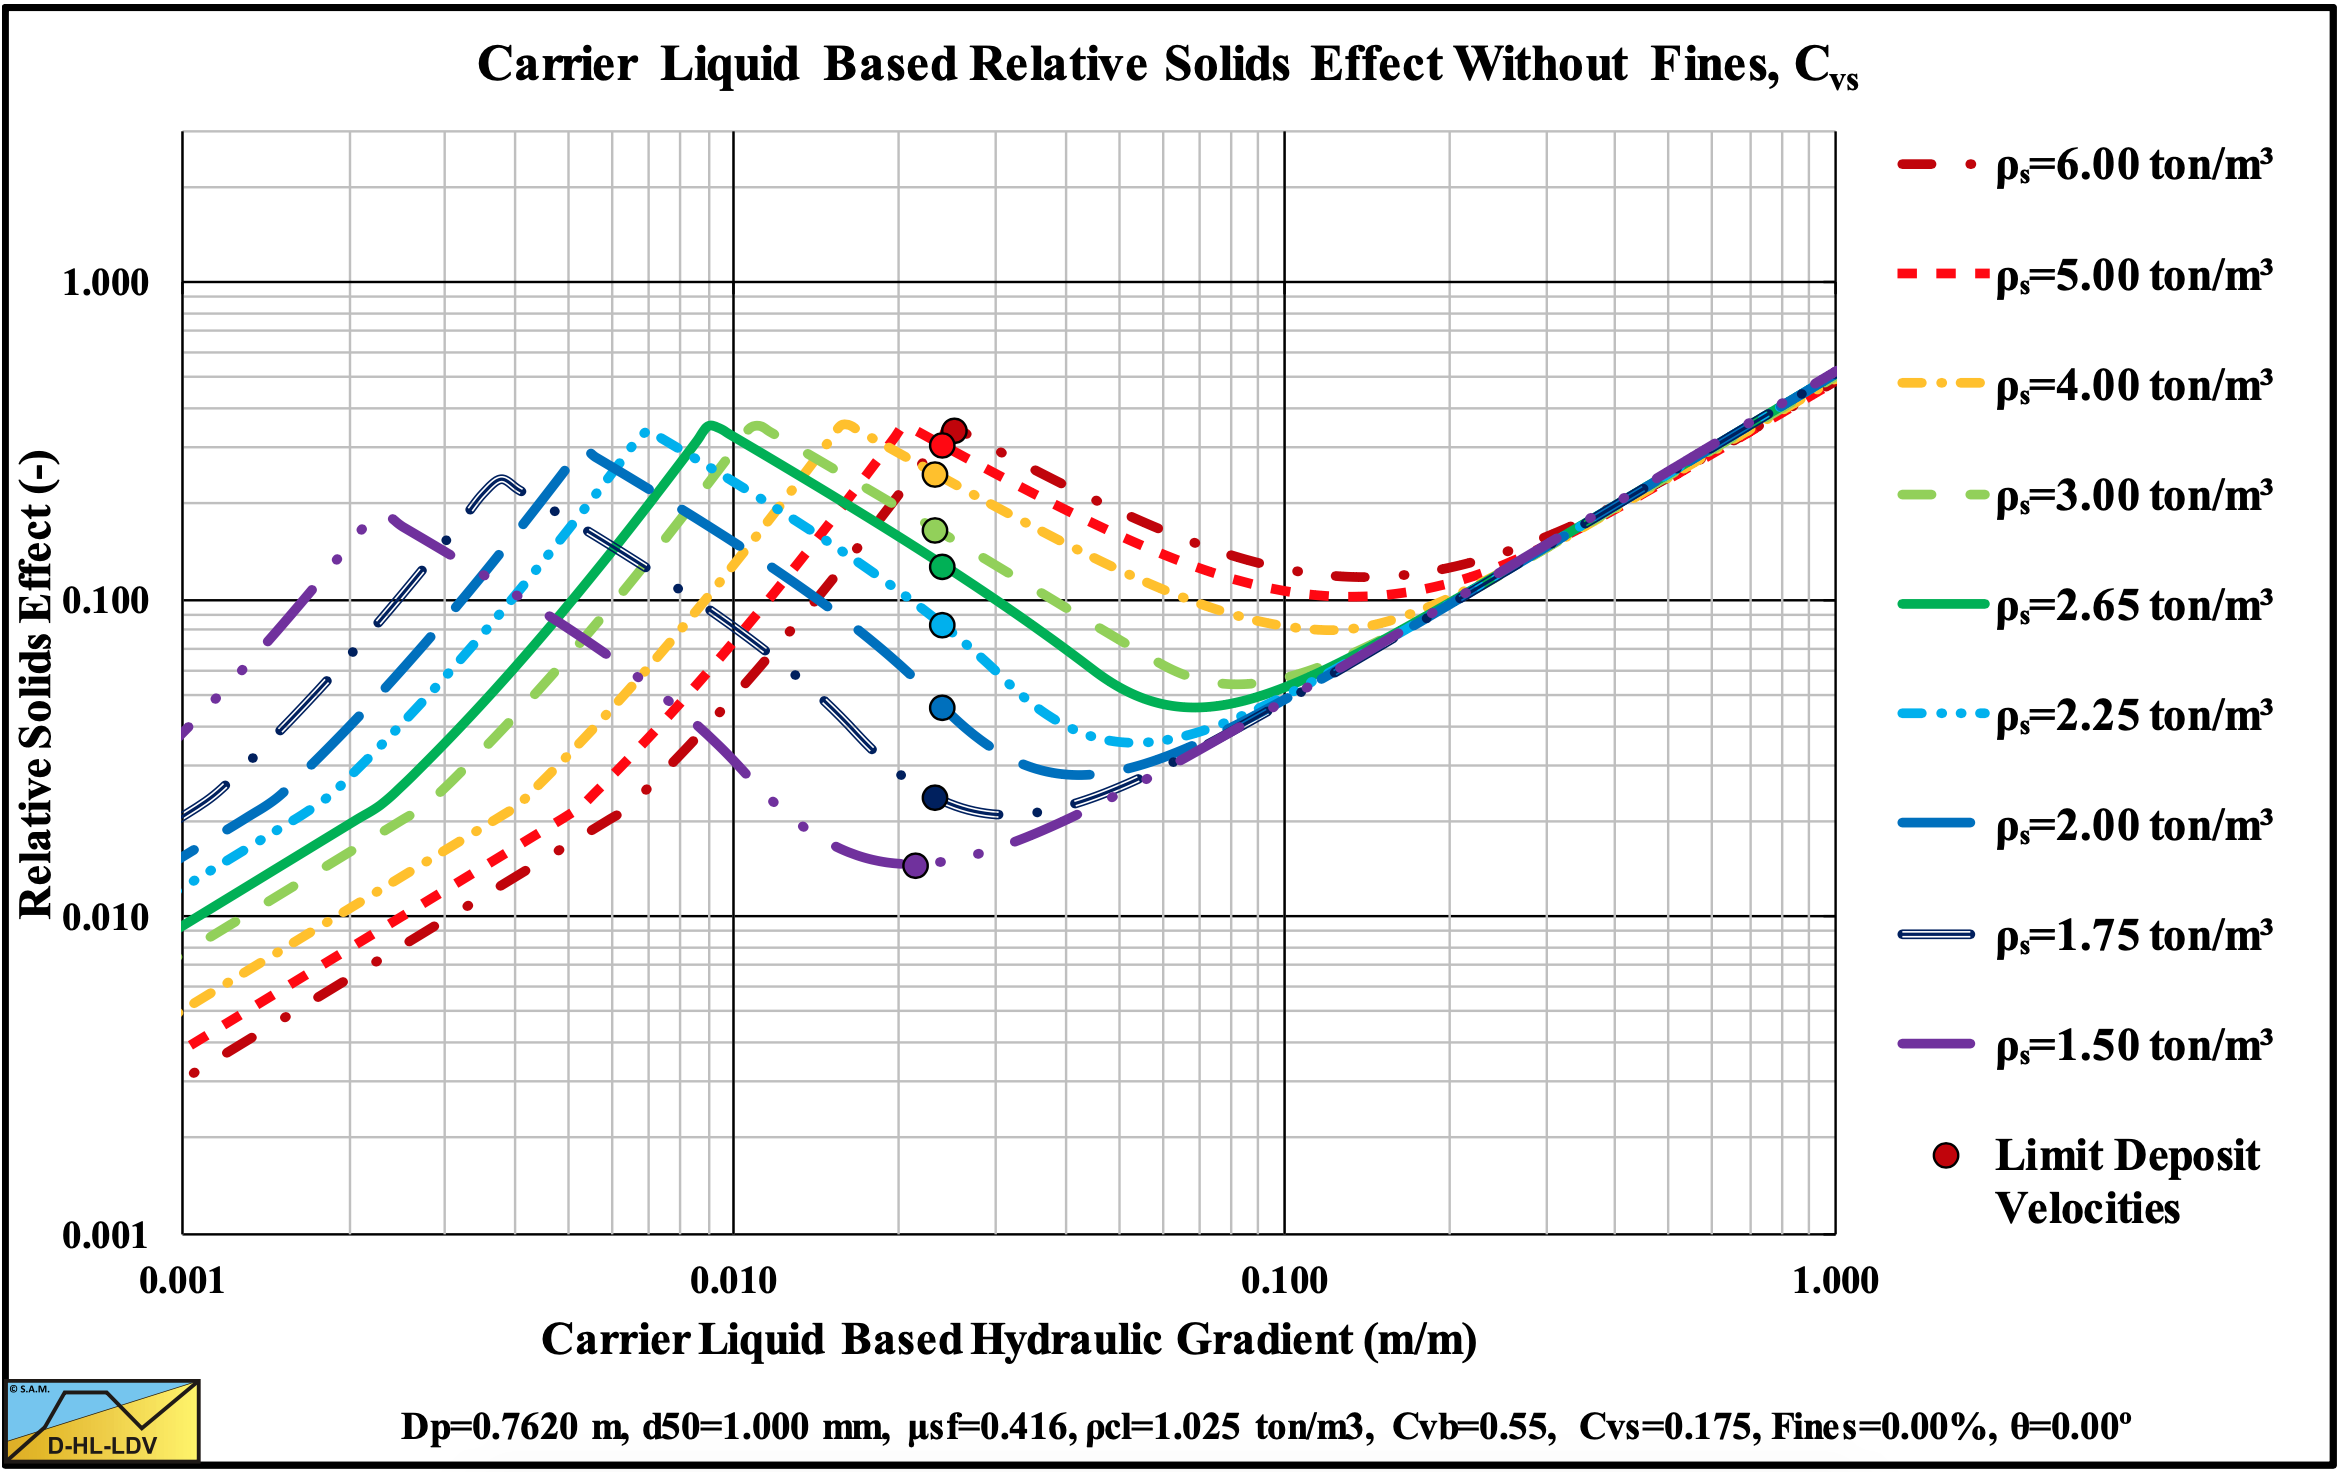
Figure 13.5-46: The relative excess hydraulic gradient versus the liquid hydraulic gradient for 9 solids densities, Cvs.
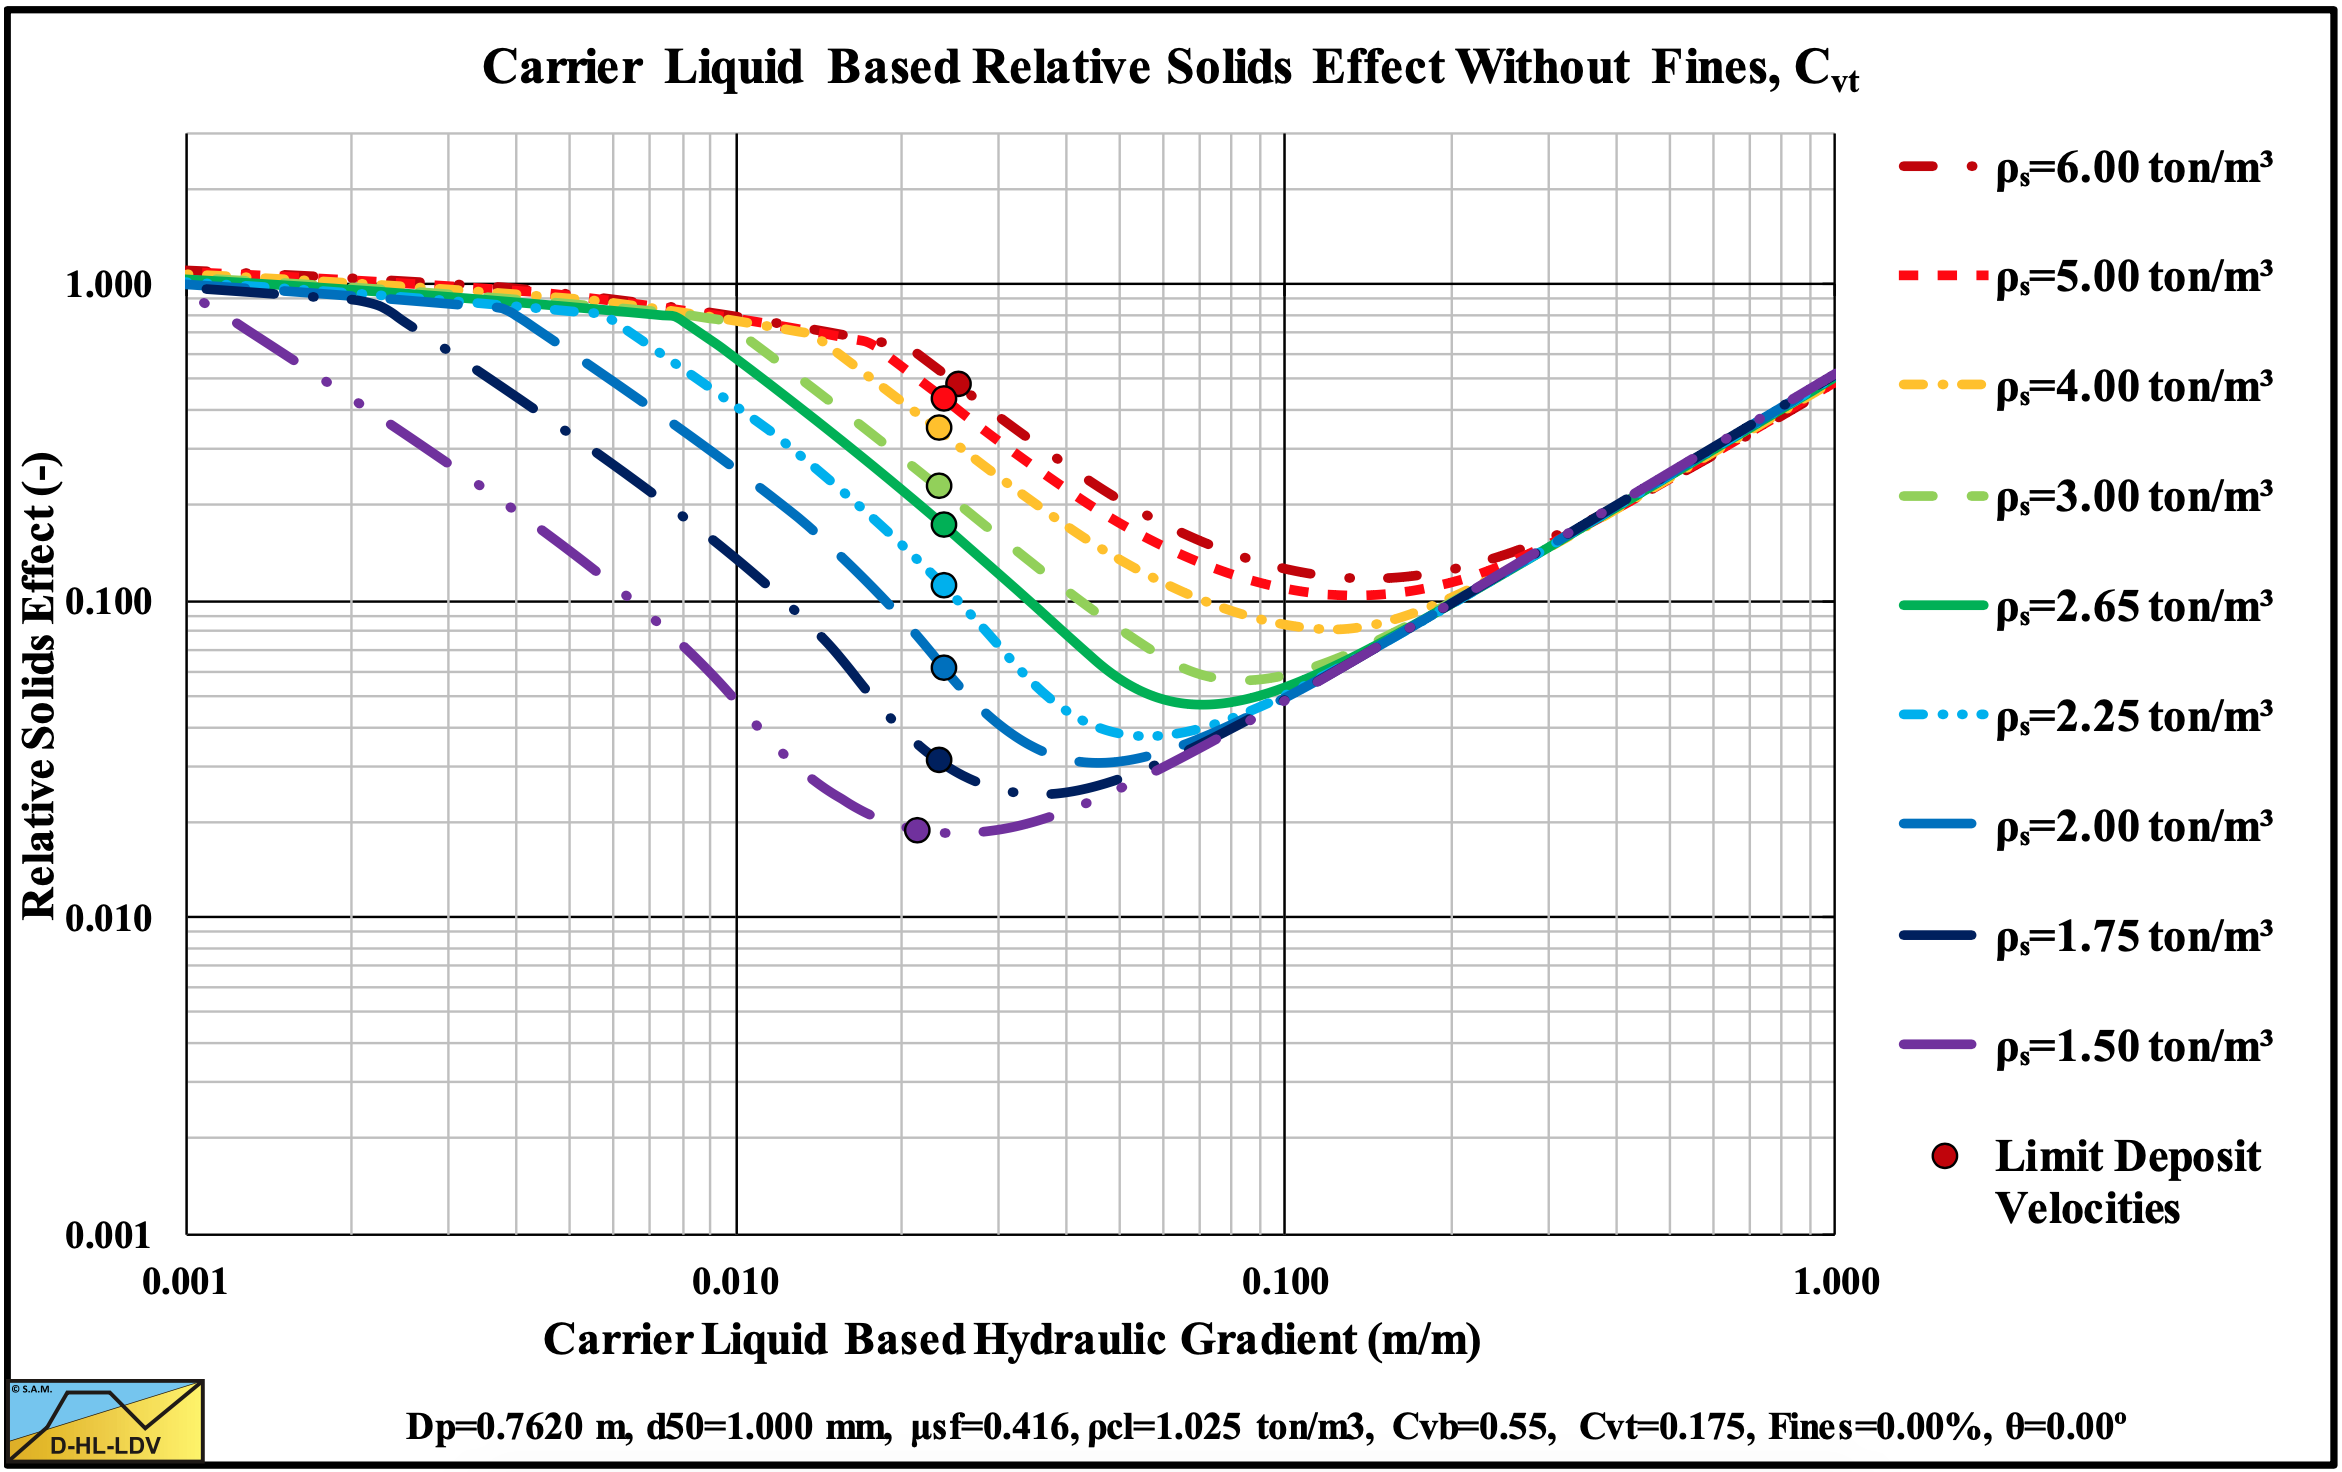
Figure 13.5-47: The relative excess hydraulic gradient versus the liquid hydraulic gradient for 9 solids densities, Cvt.
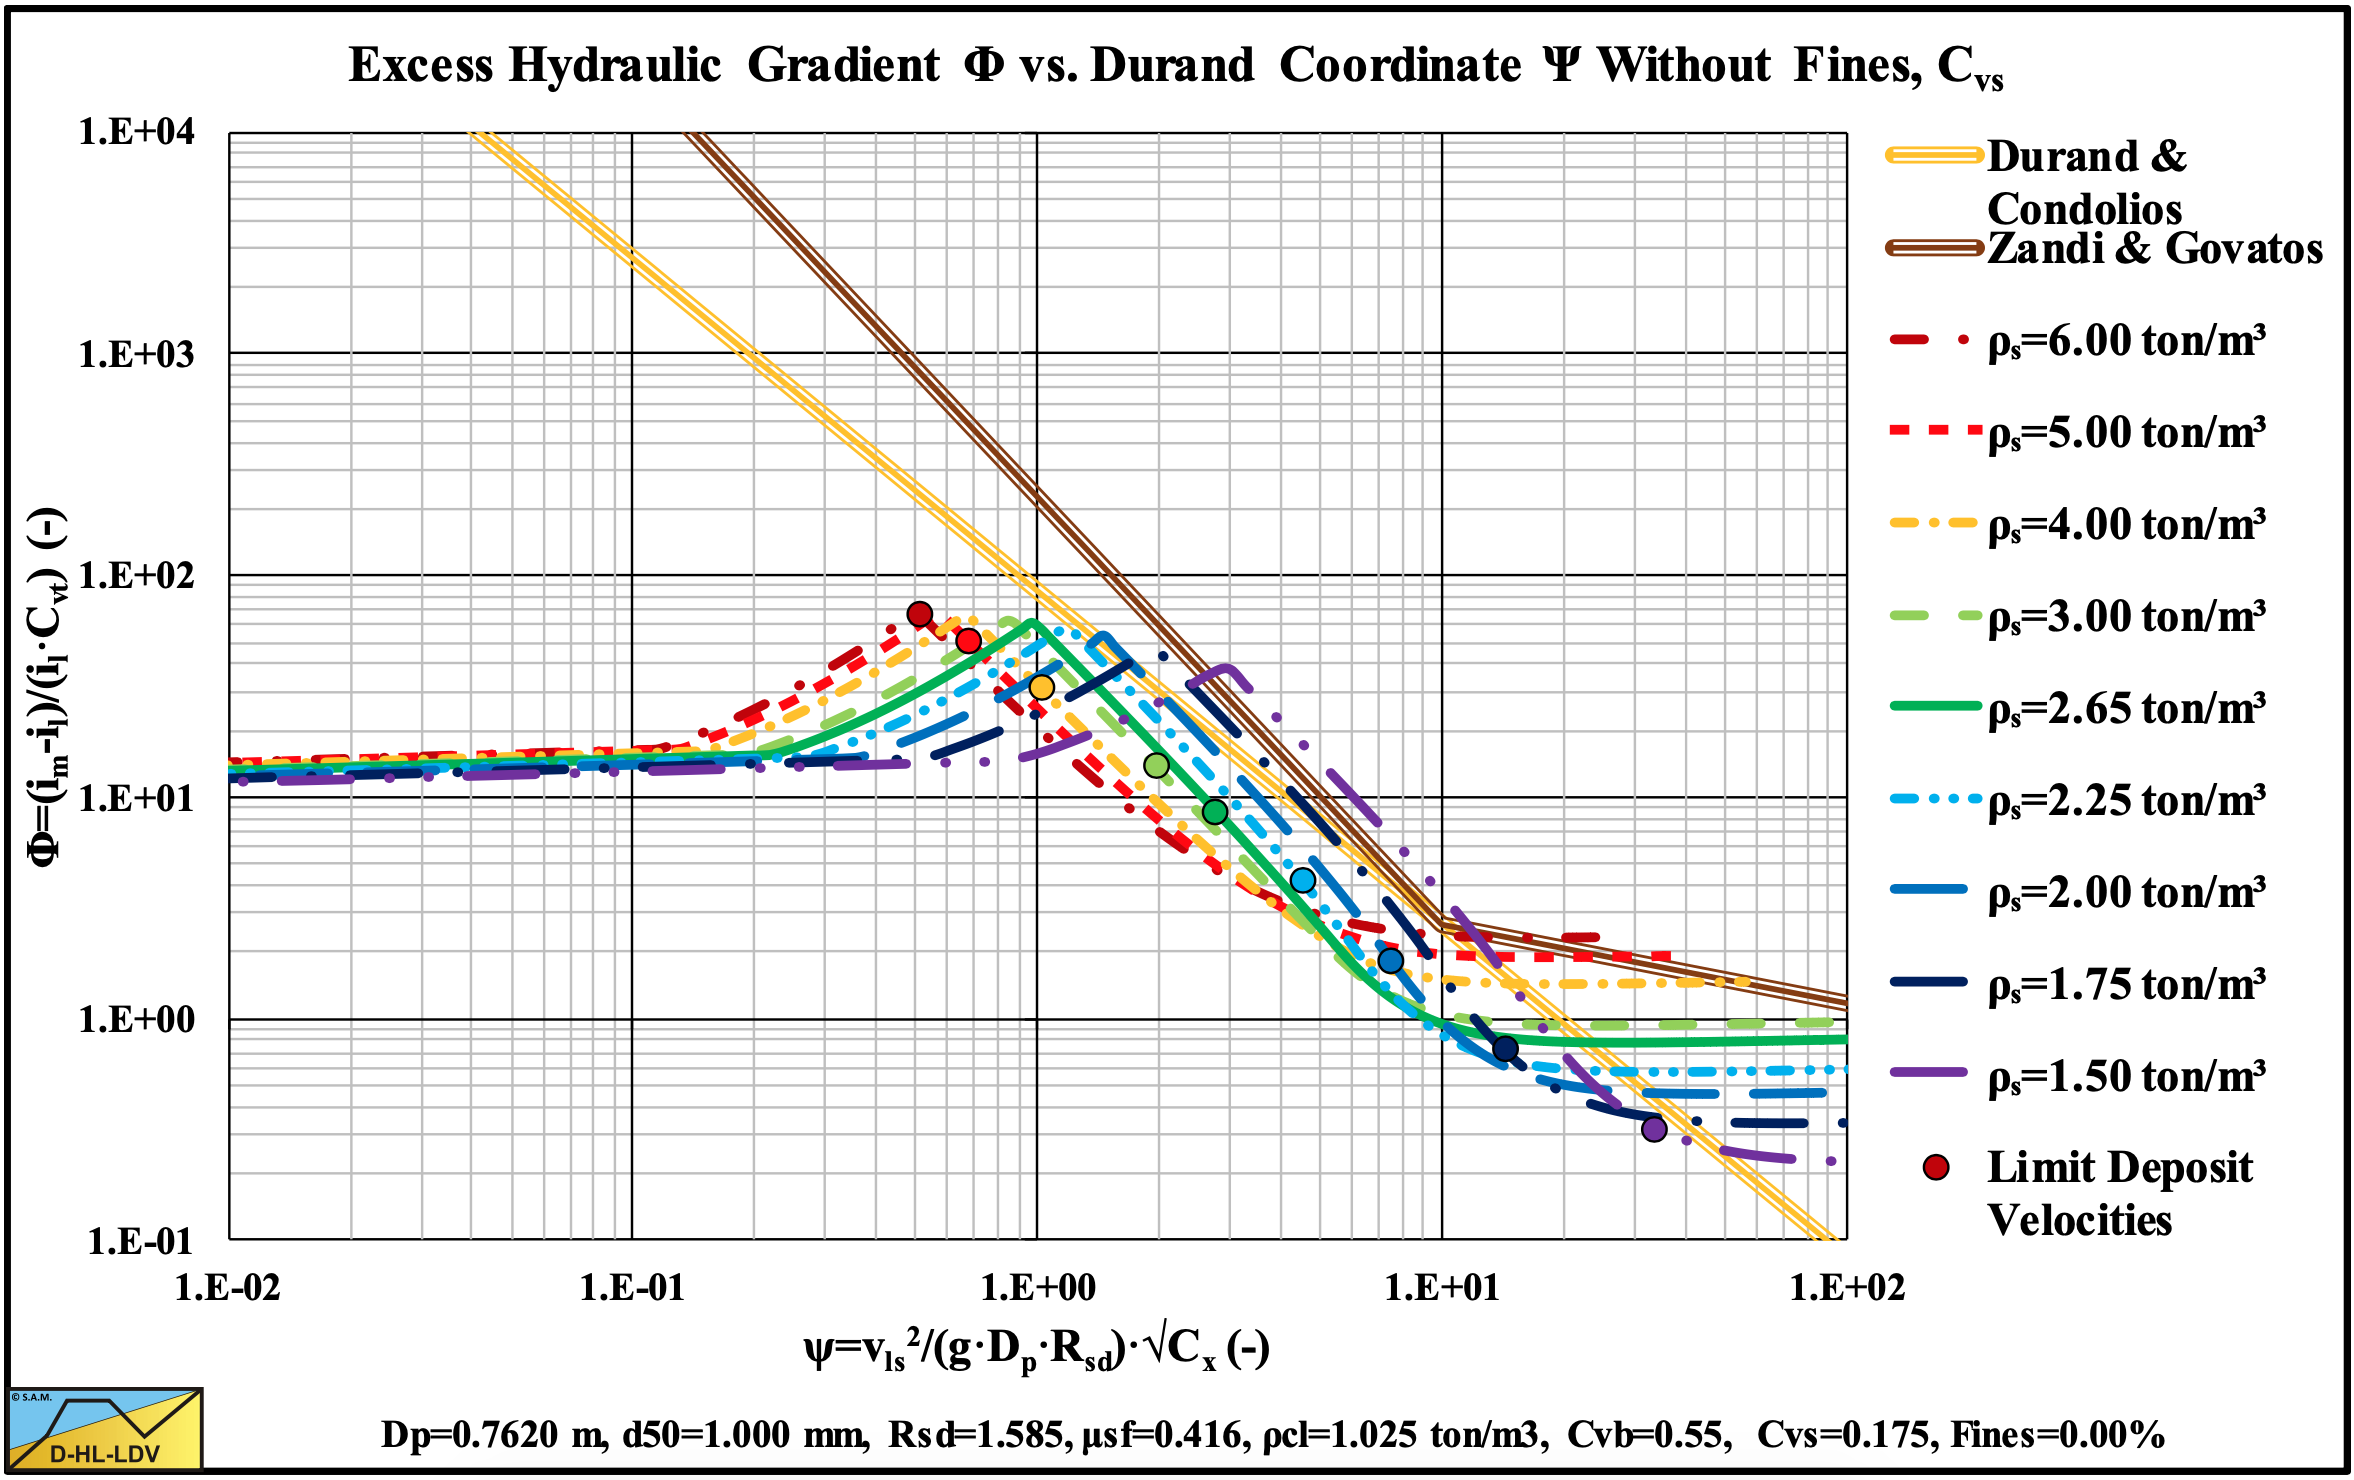
Figure 13.5-48: The hydraulic gradient on Durand coordinates for 9 solids densities, Cvs.
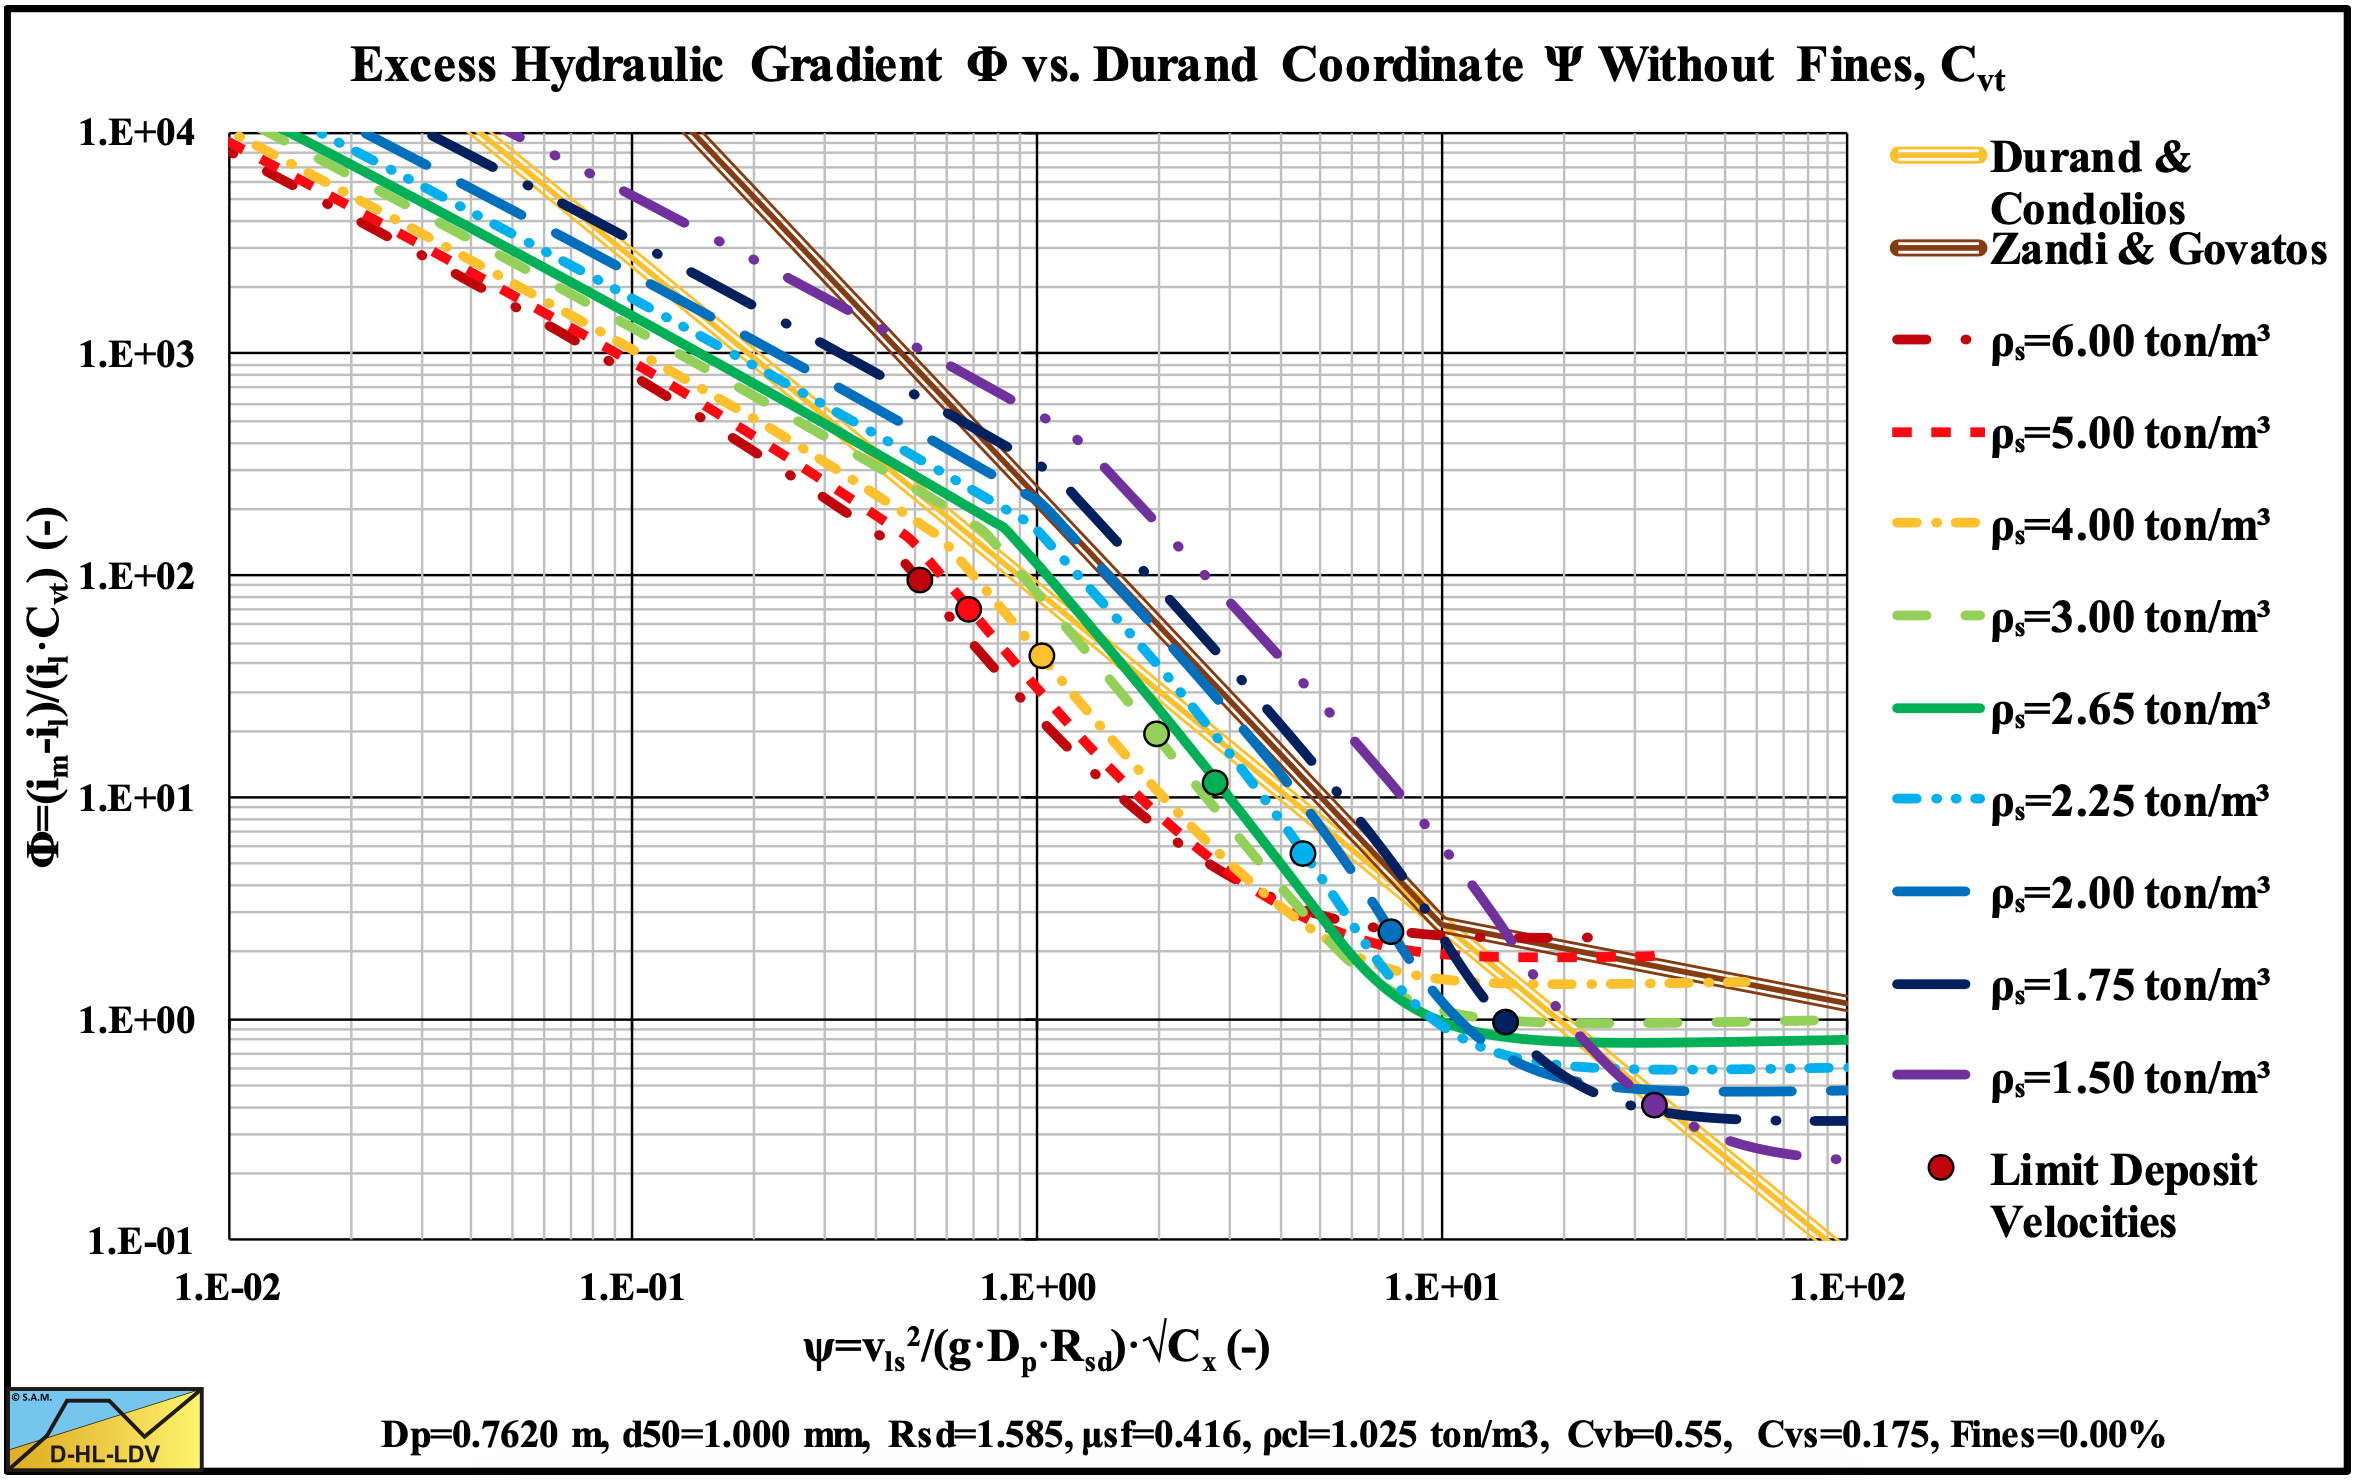
Figure 13.5-49: The hydraulic gradient on Durand coordinates for 9 solids densities, Cvt.
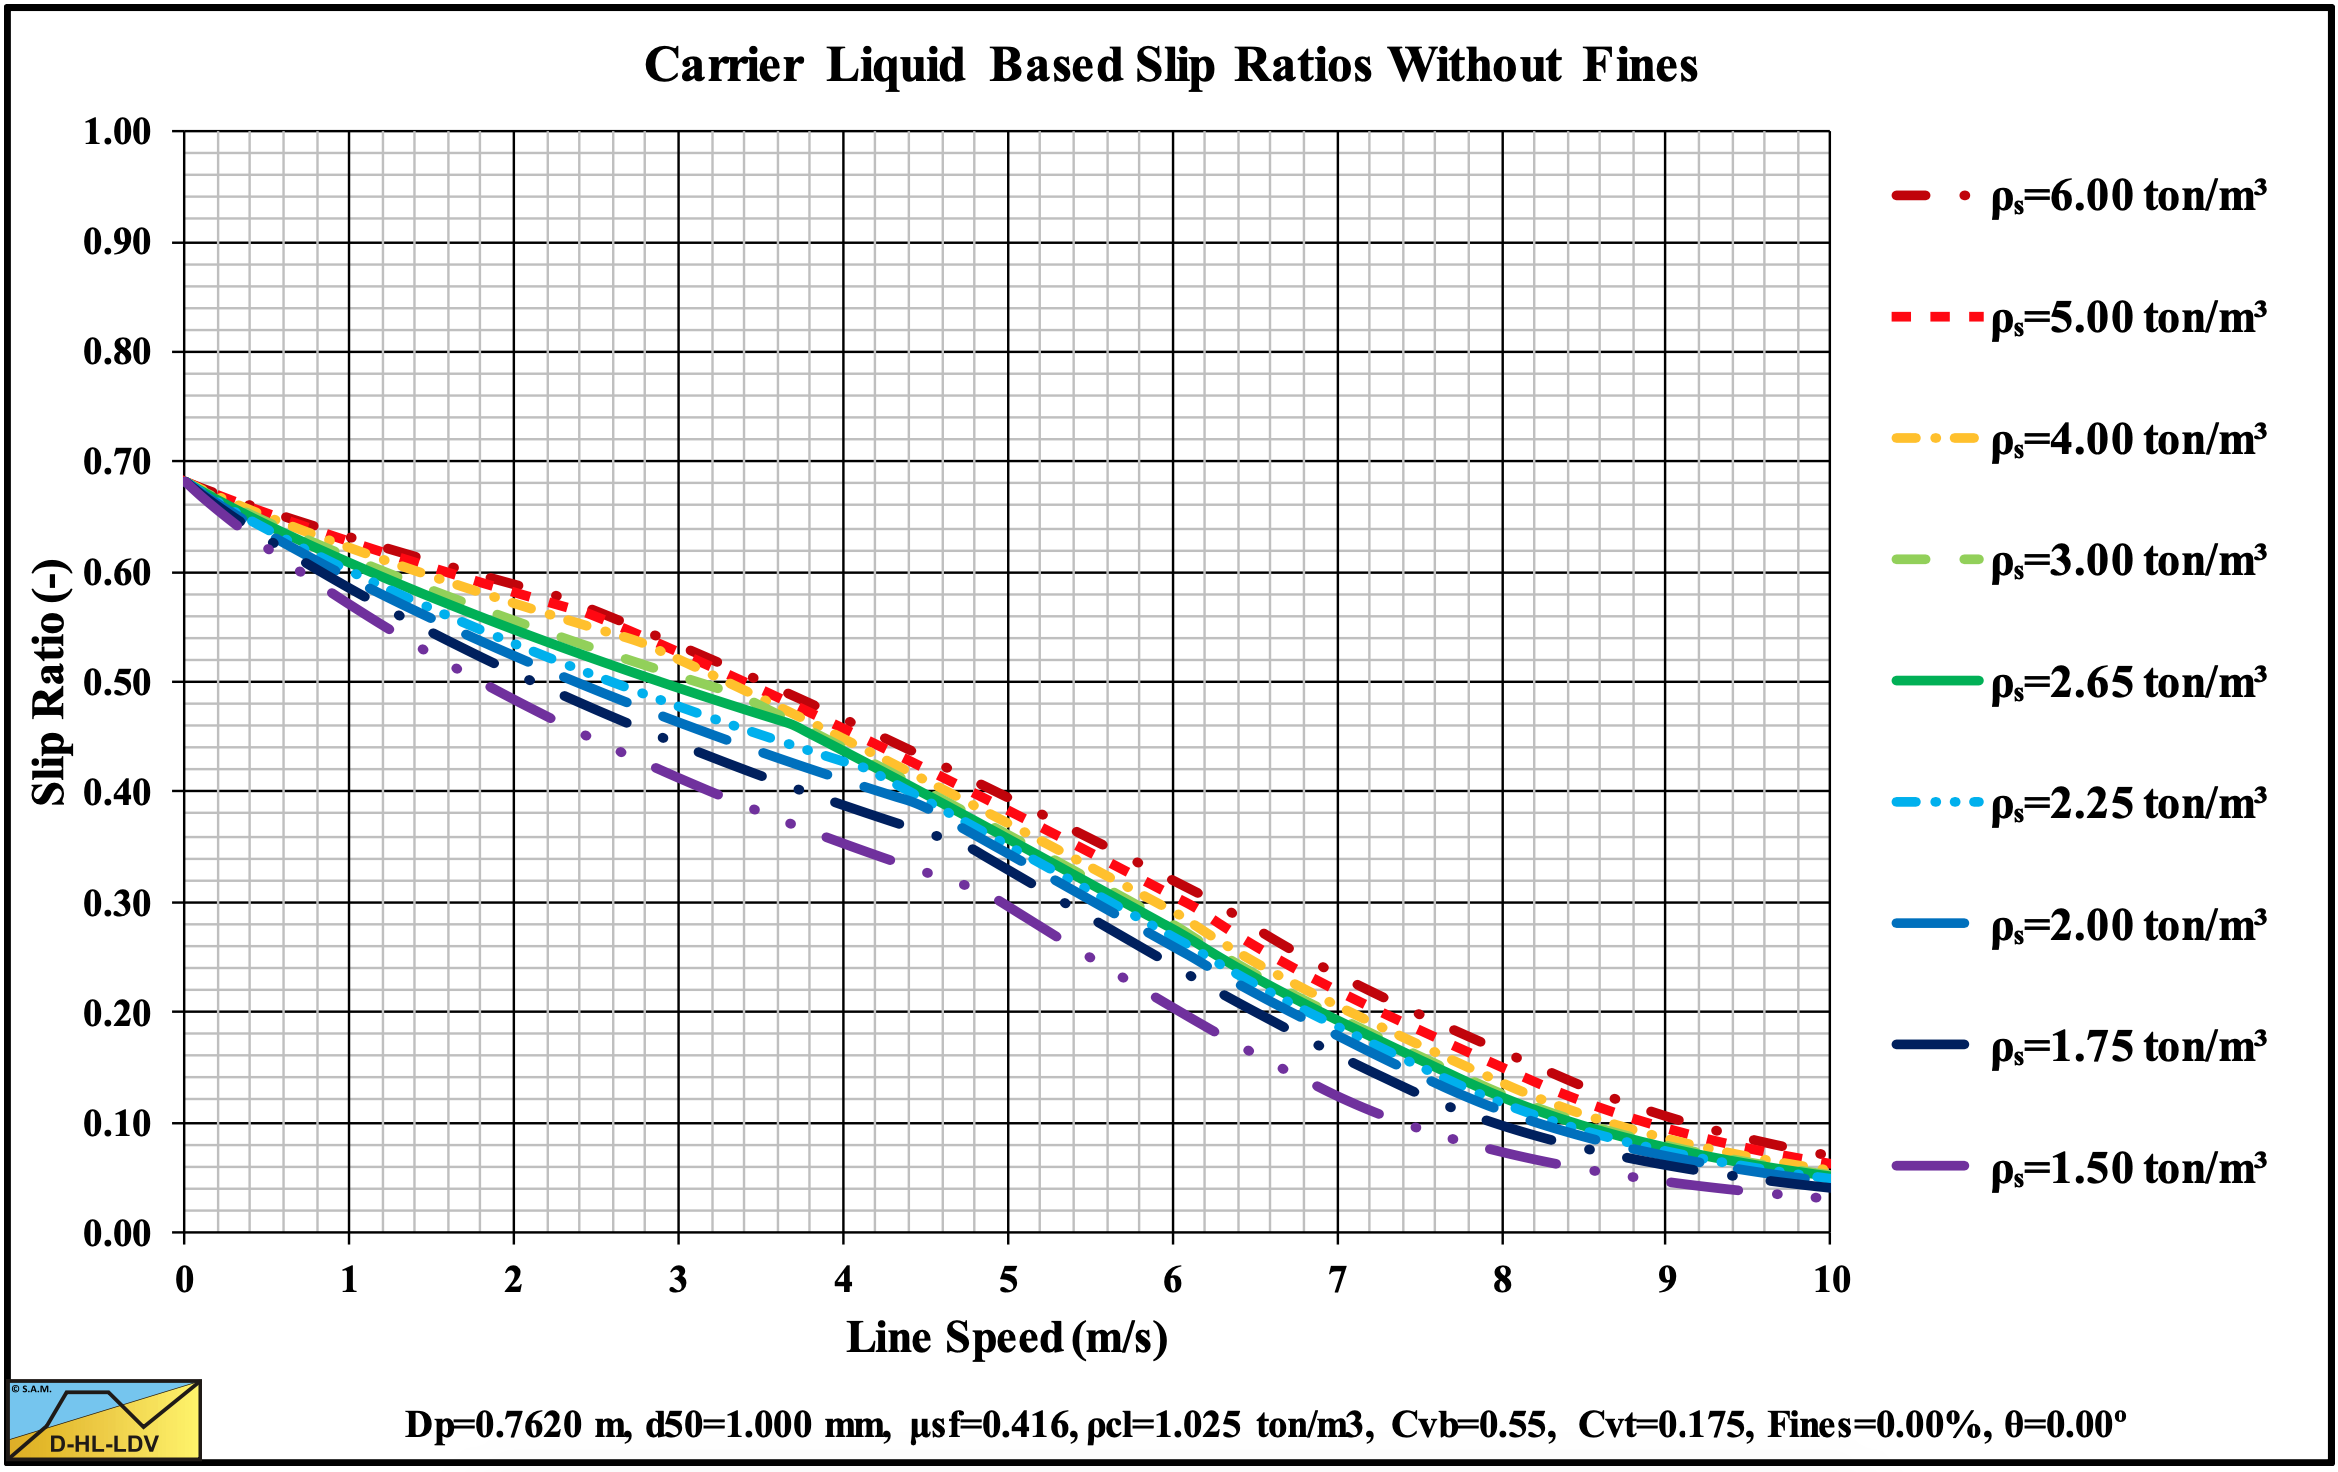
Figure 13.5-50: The slip ratio for 9 solids densities.
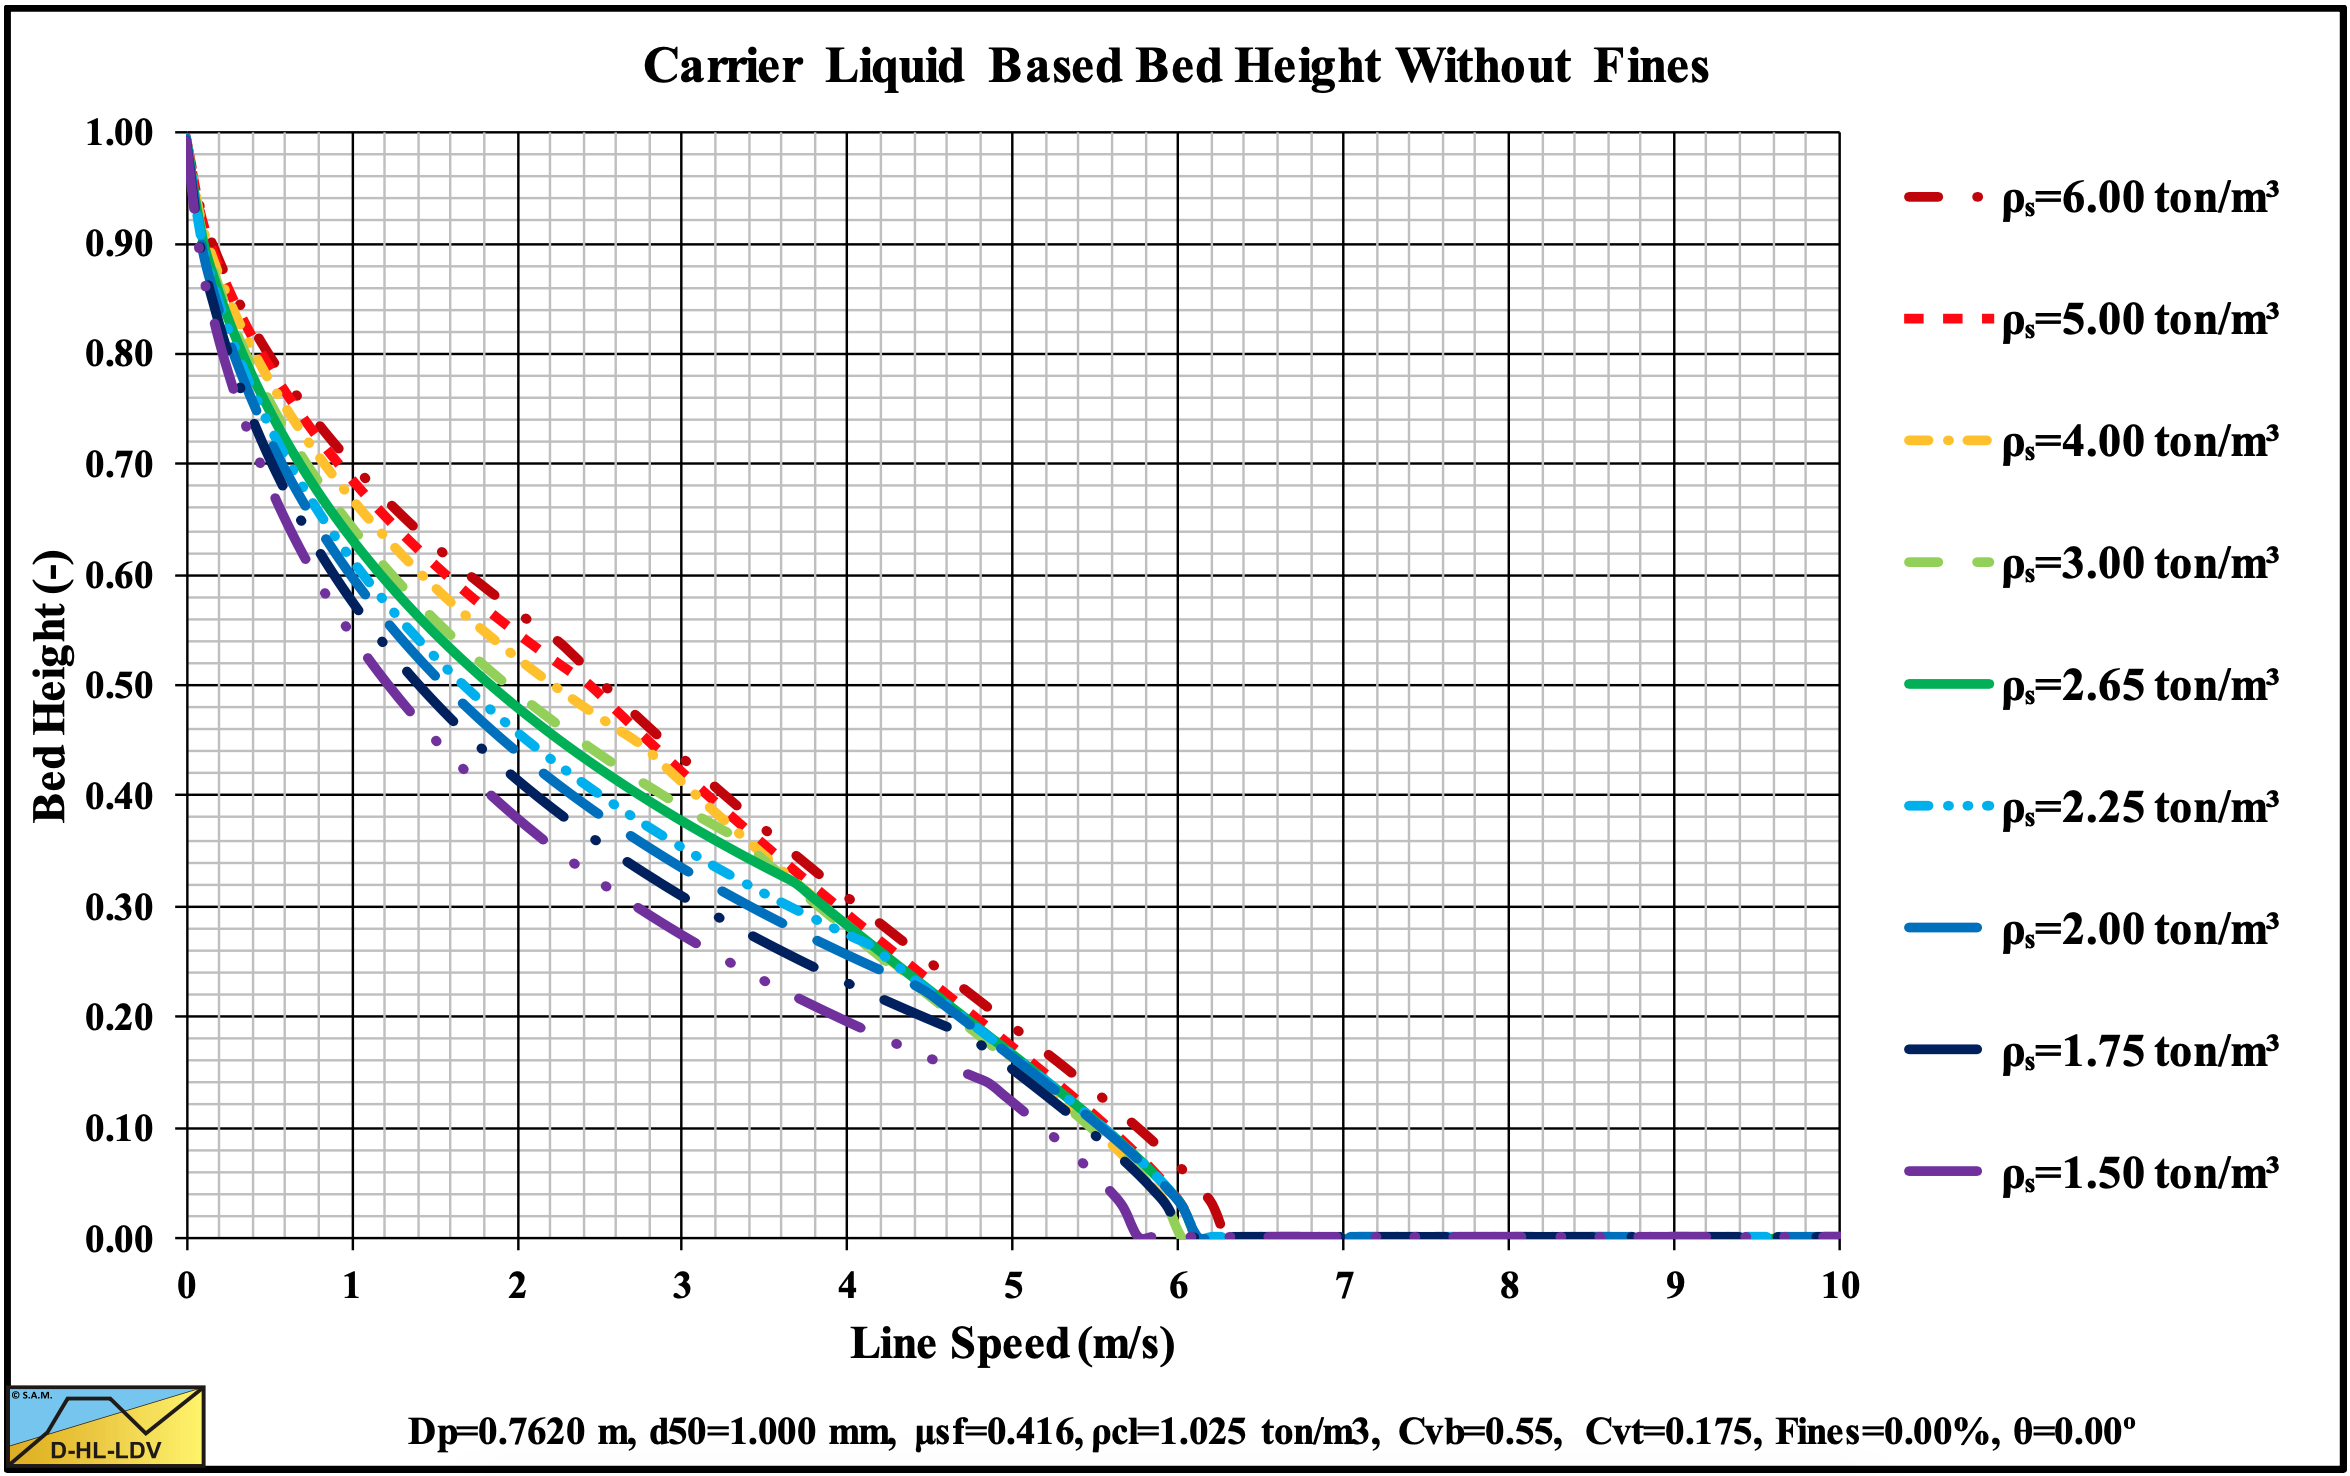
Figure 13.5-51: The bed height for 9 solids densities.
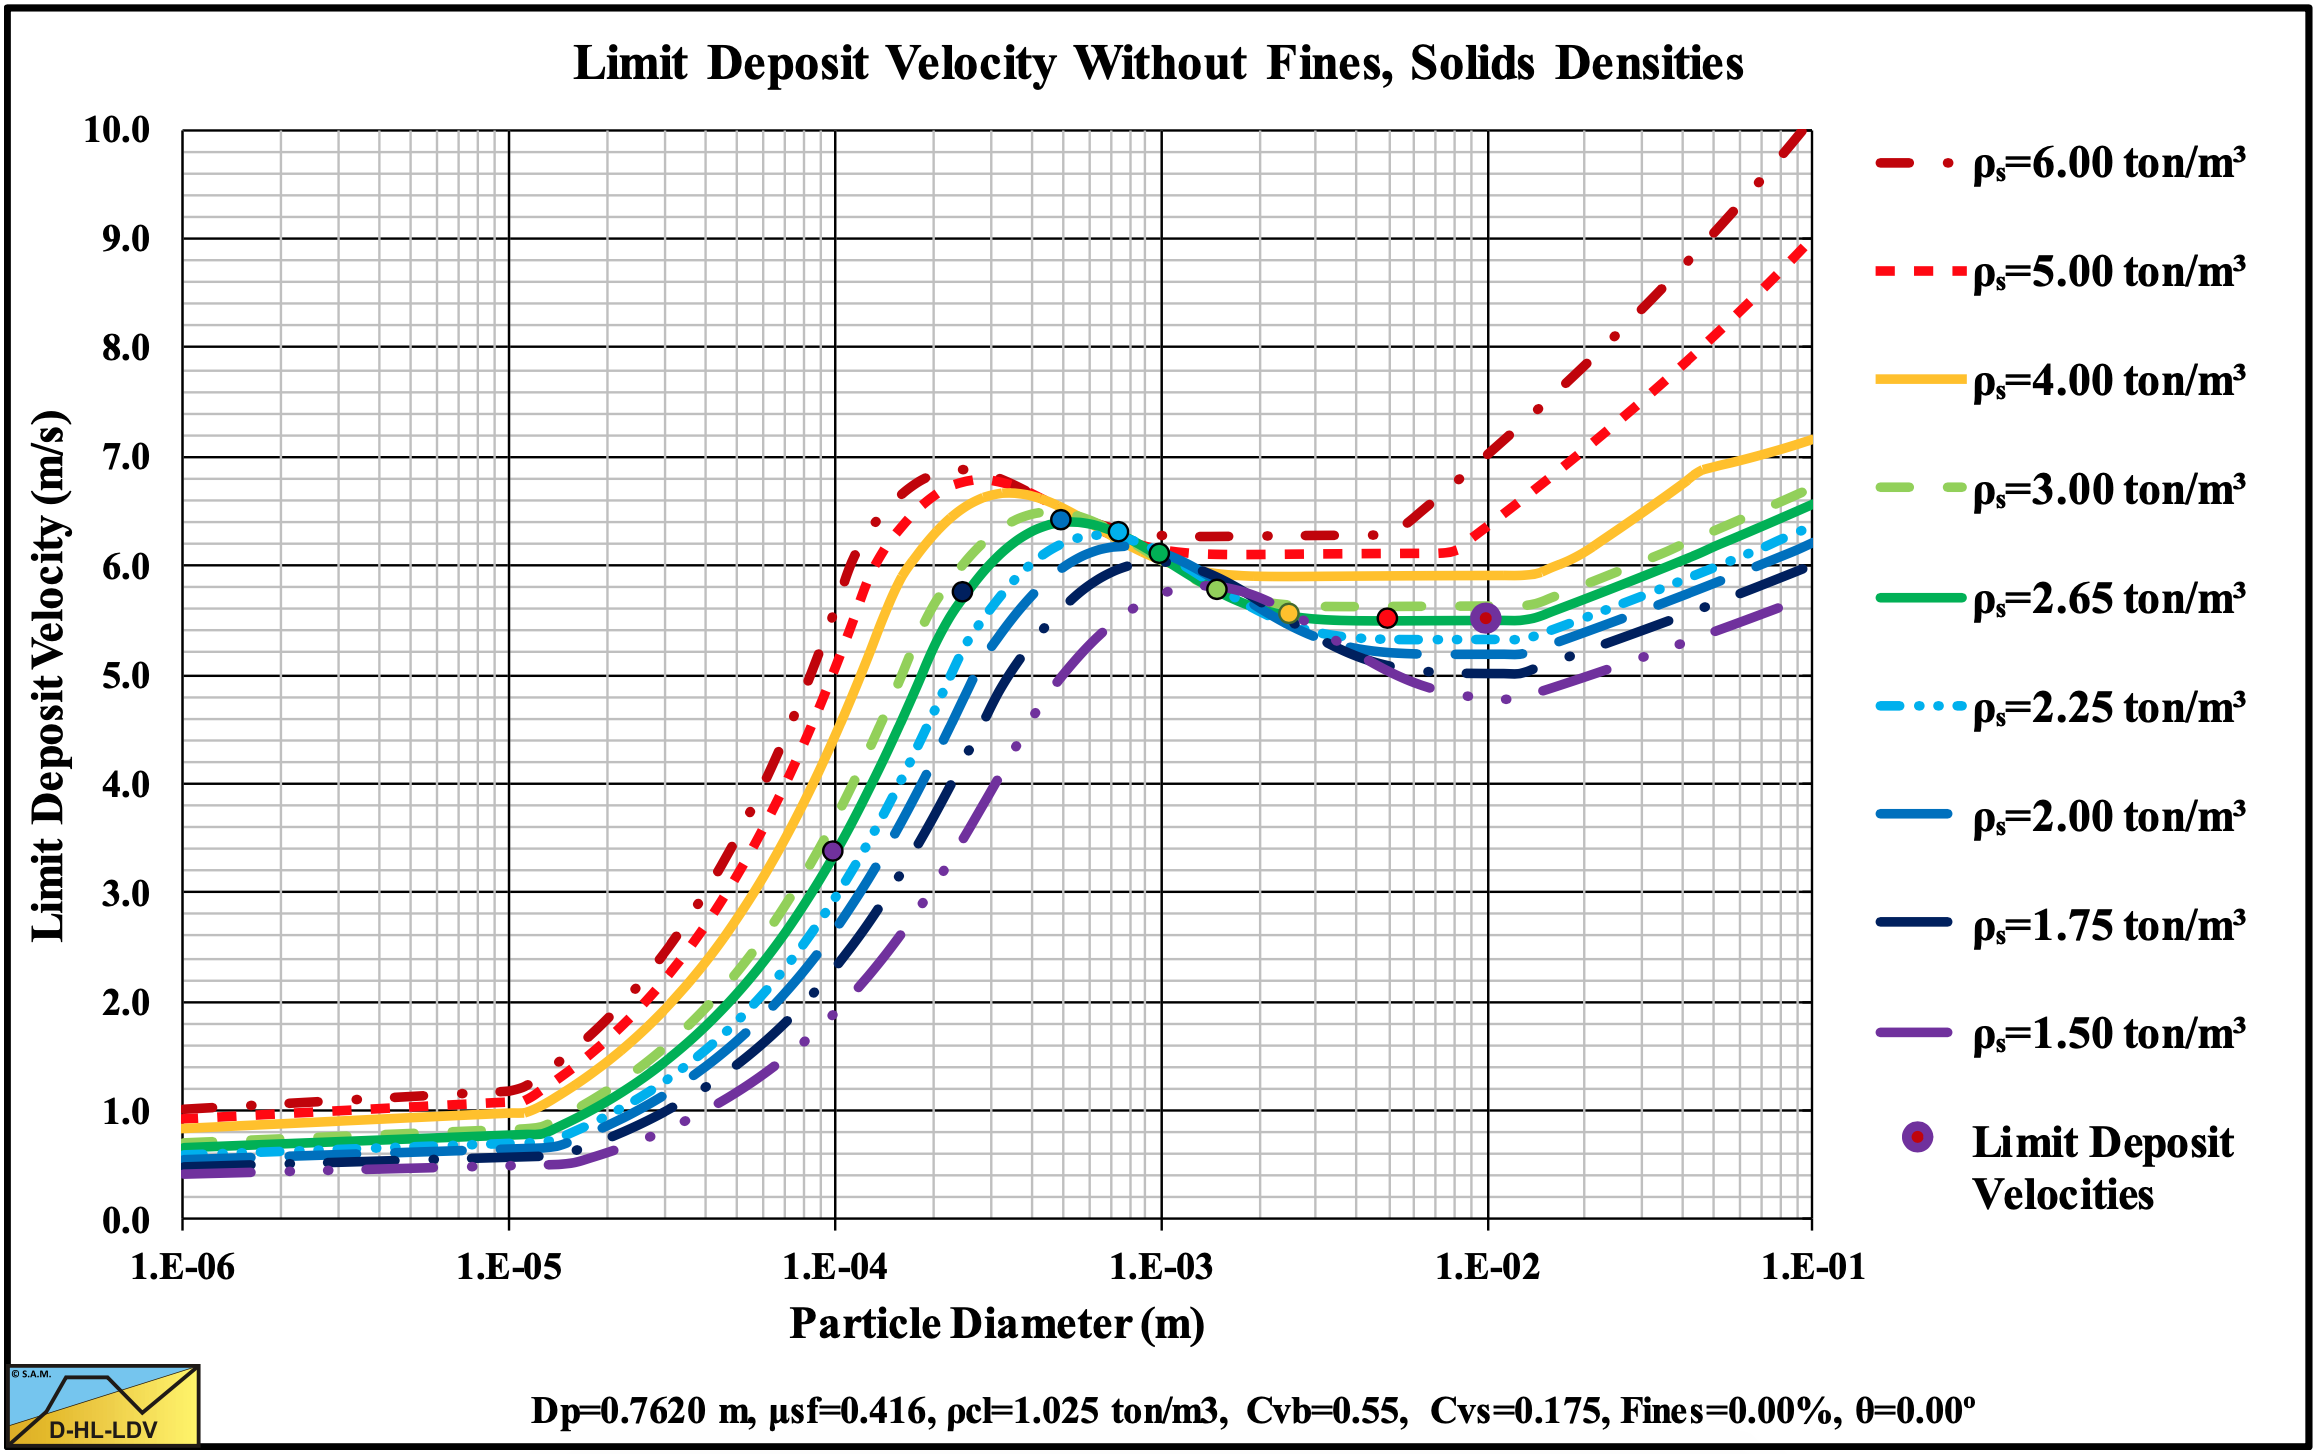
Figure 13.5-52: The Limit Deposit Velocity versus the particle diameter for 9 solids densities.
15.5.7 Graded Solids
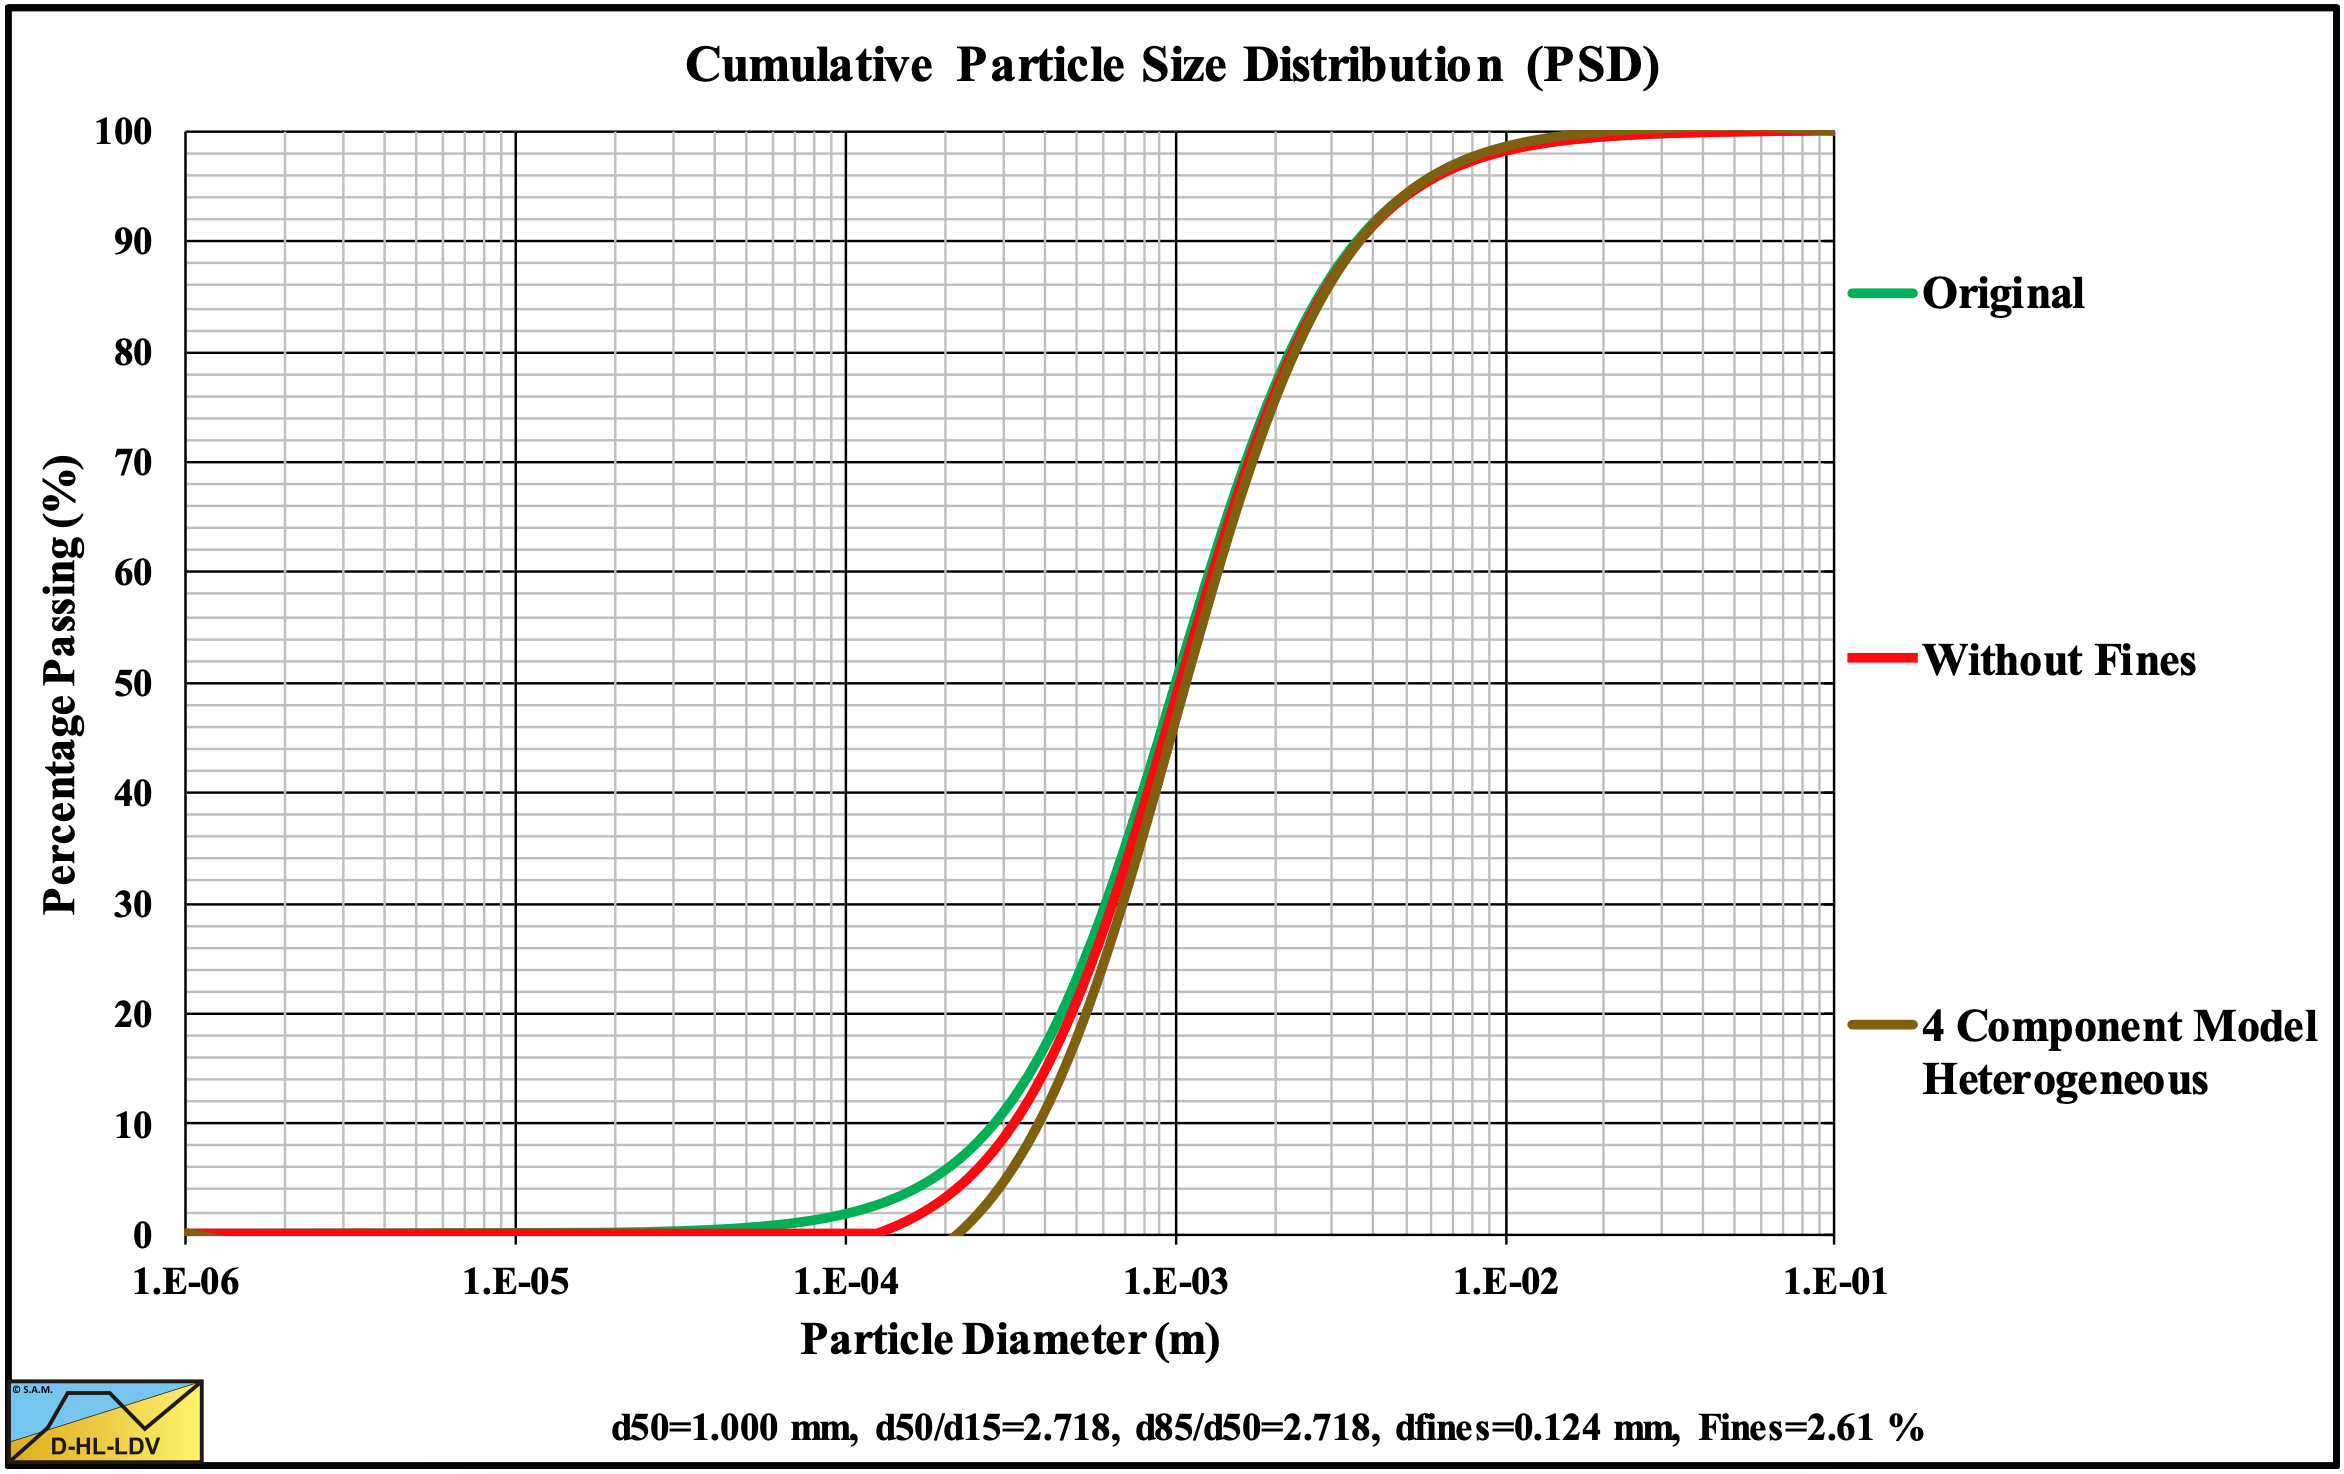
Figure 13.5-53: The Particle Size Distribution of a graded sand.
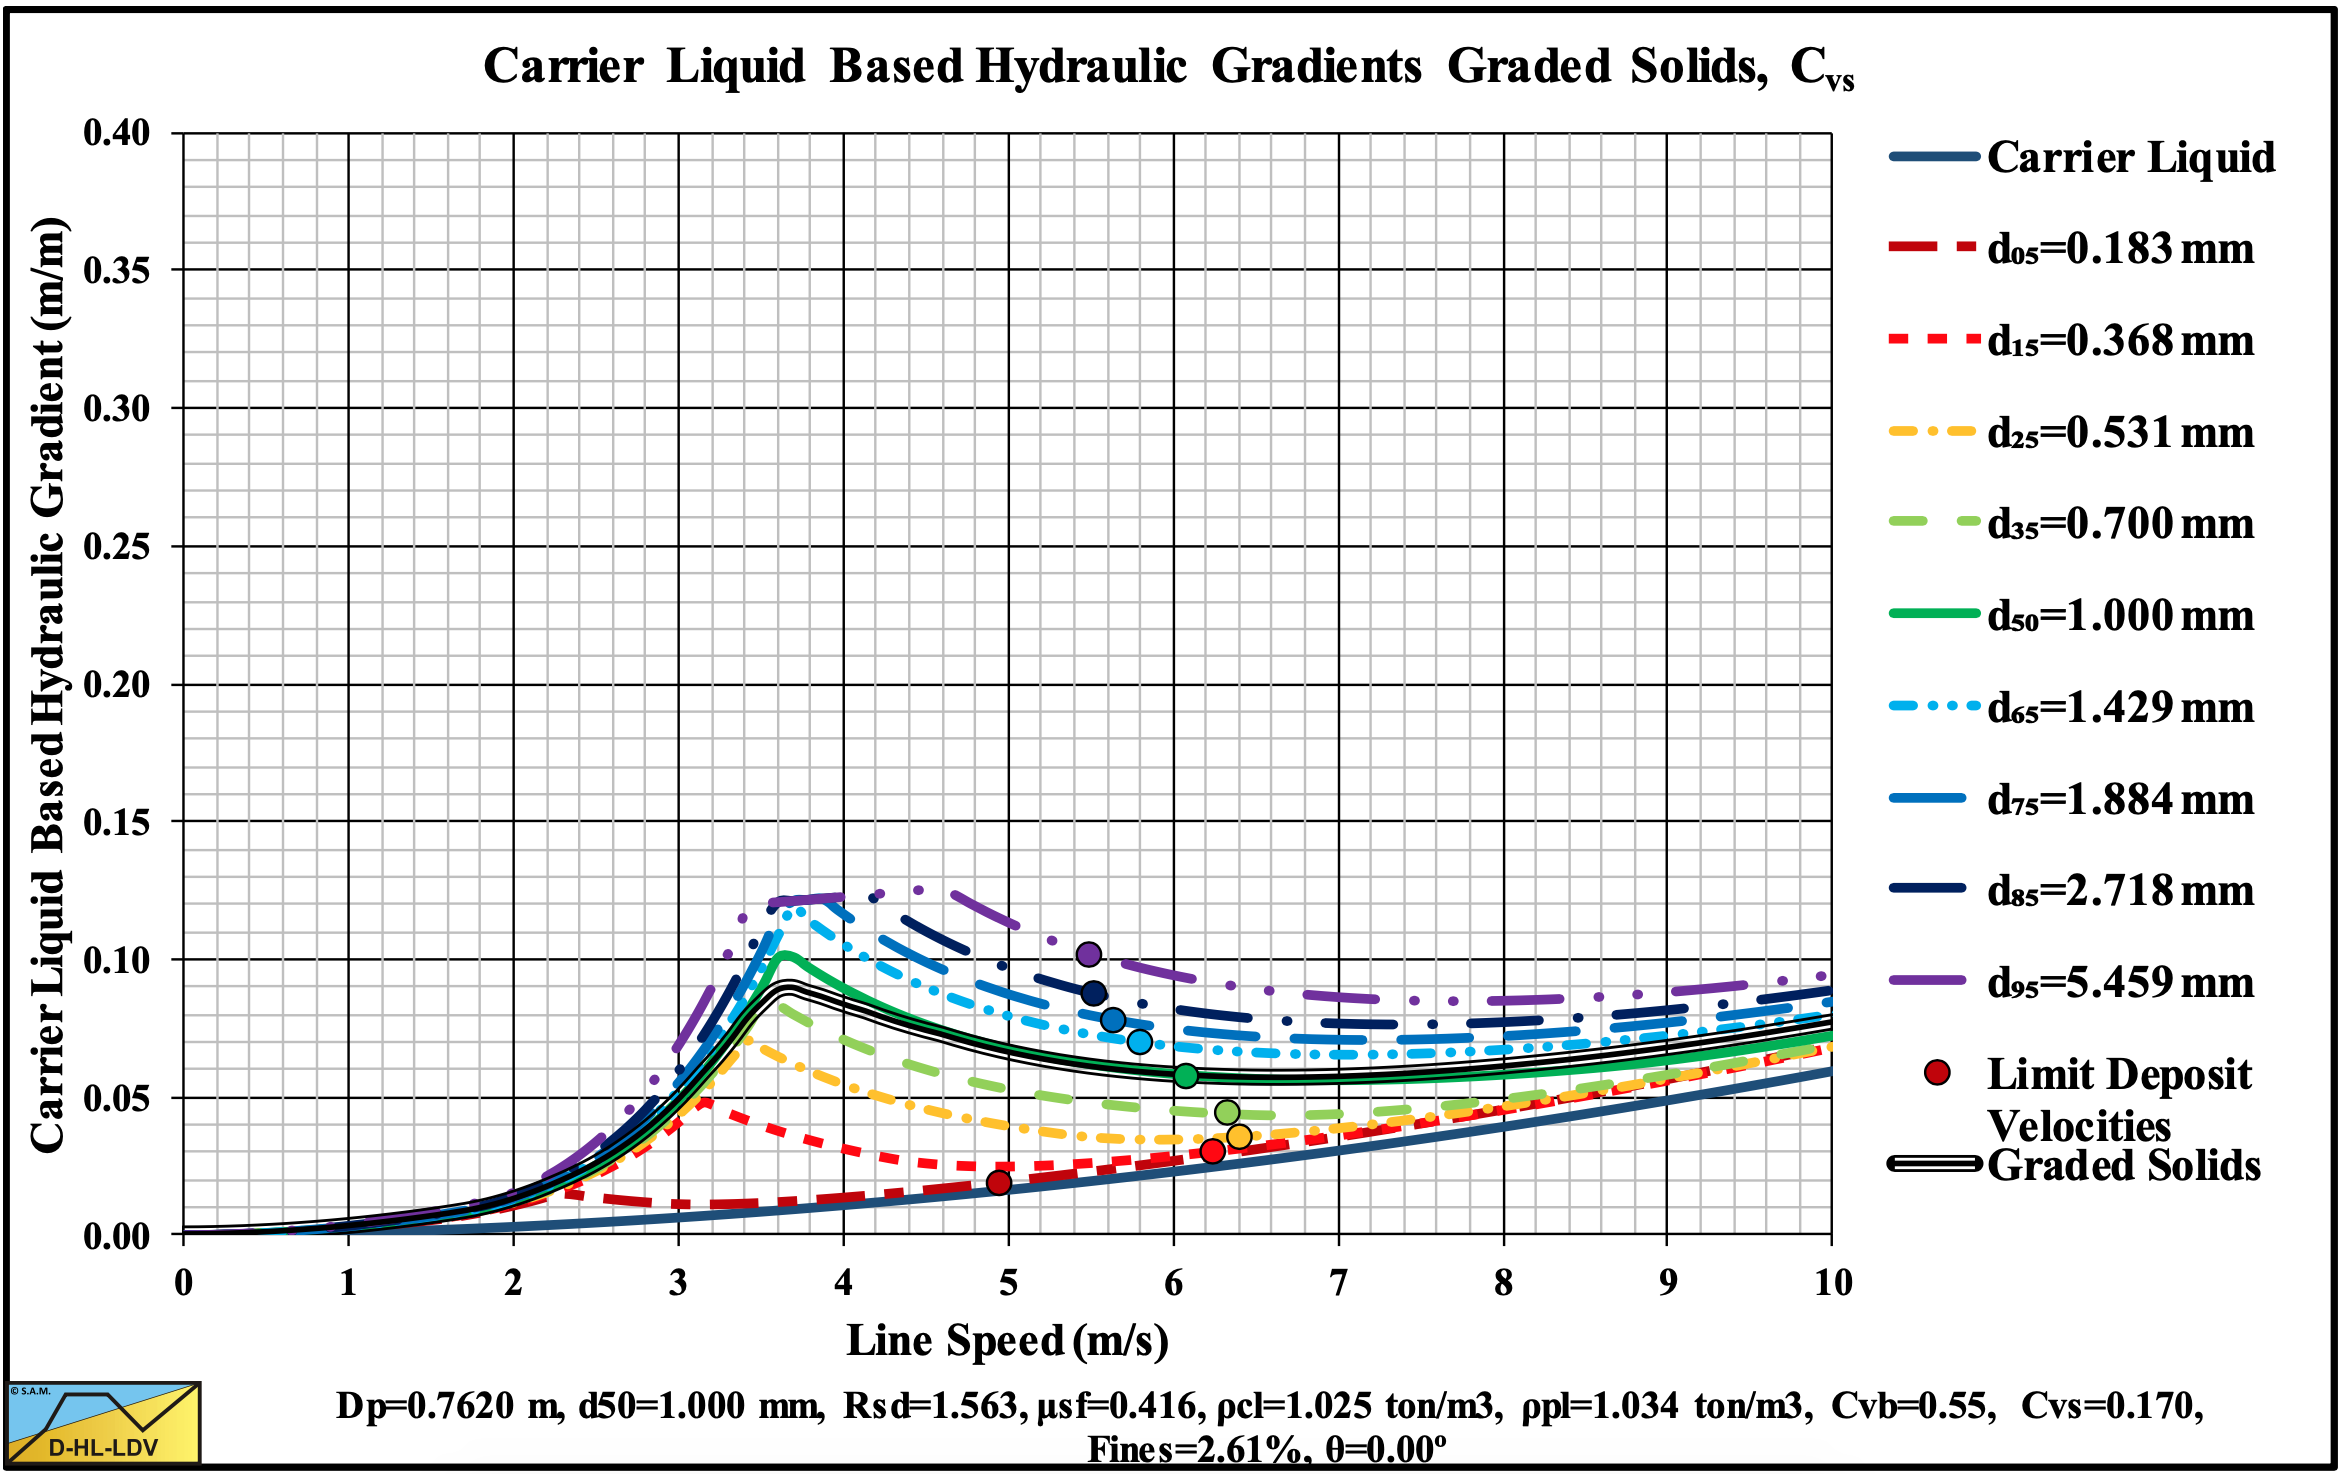
Figure 13.5-54: The hydraulic gradient versus the line speed for a graded sand, Cvs.
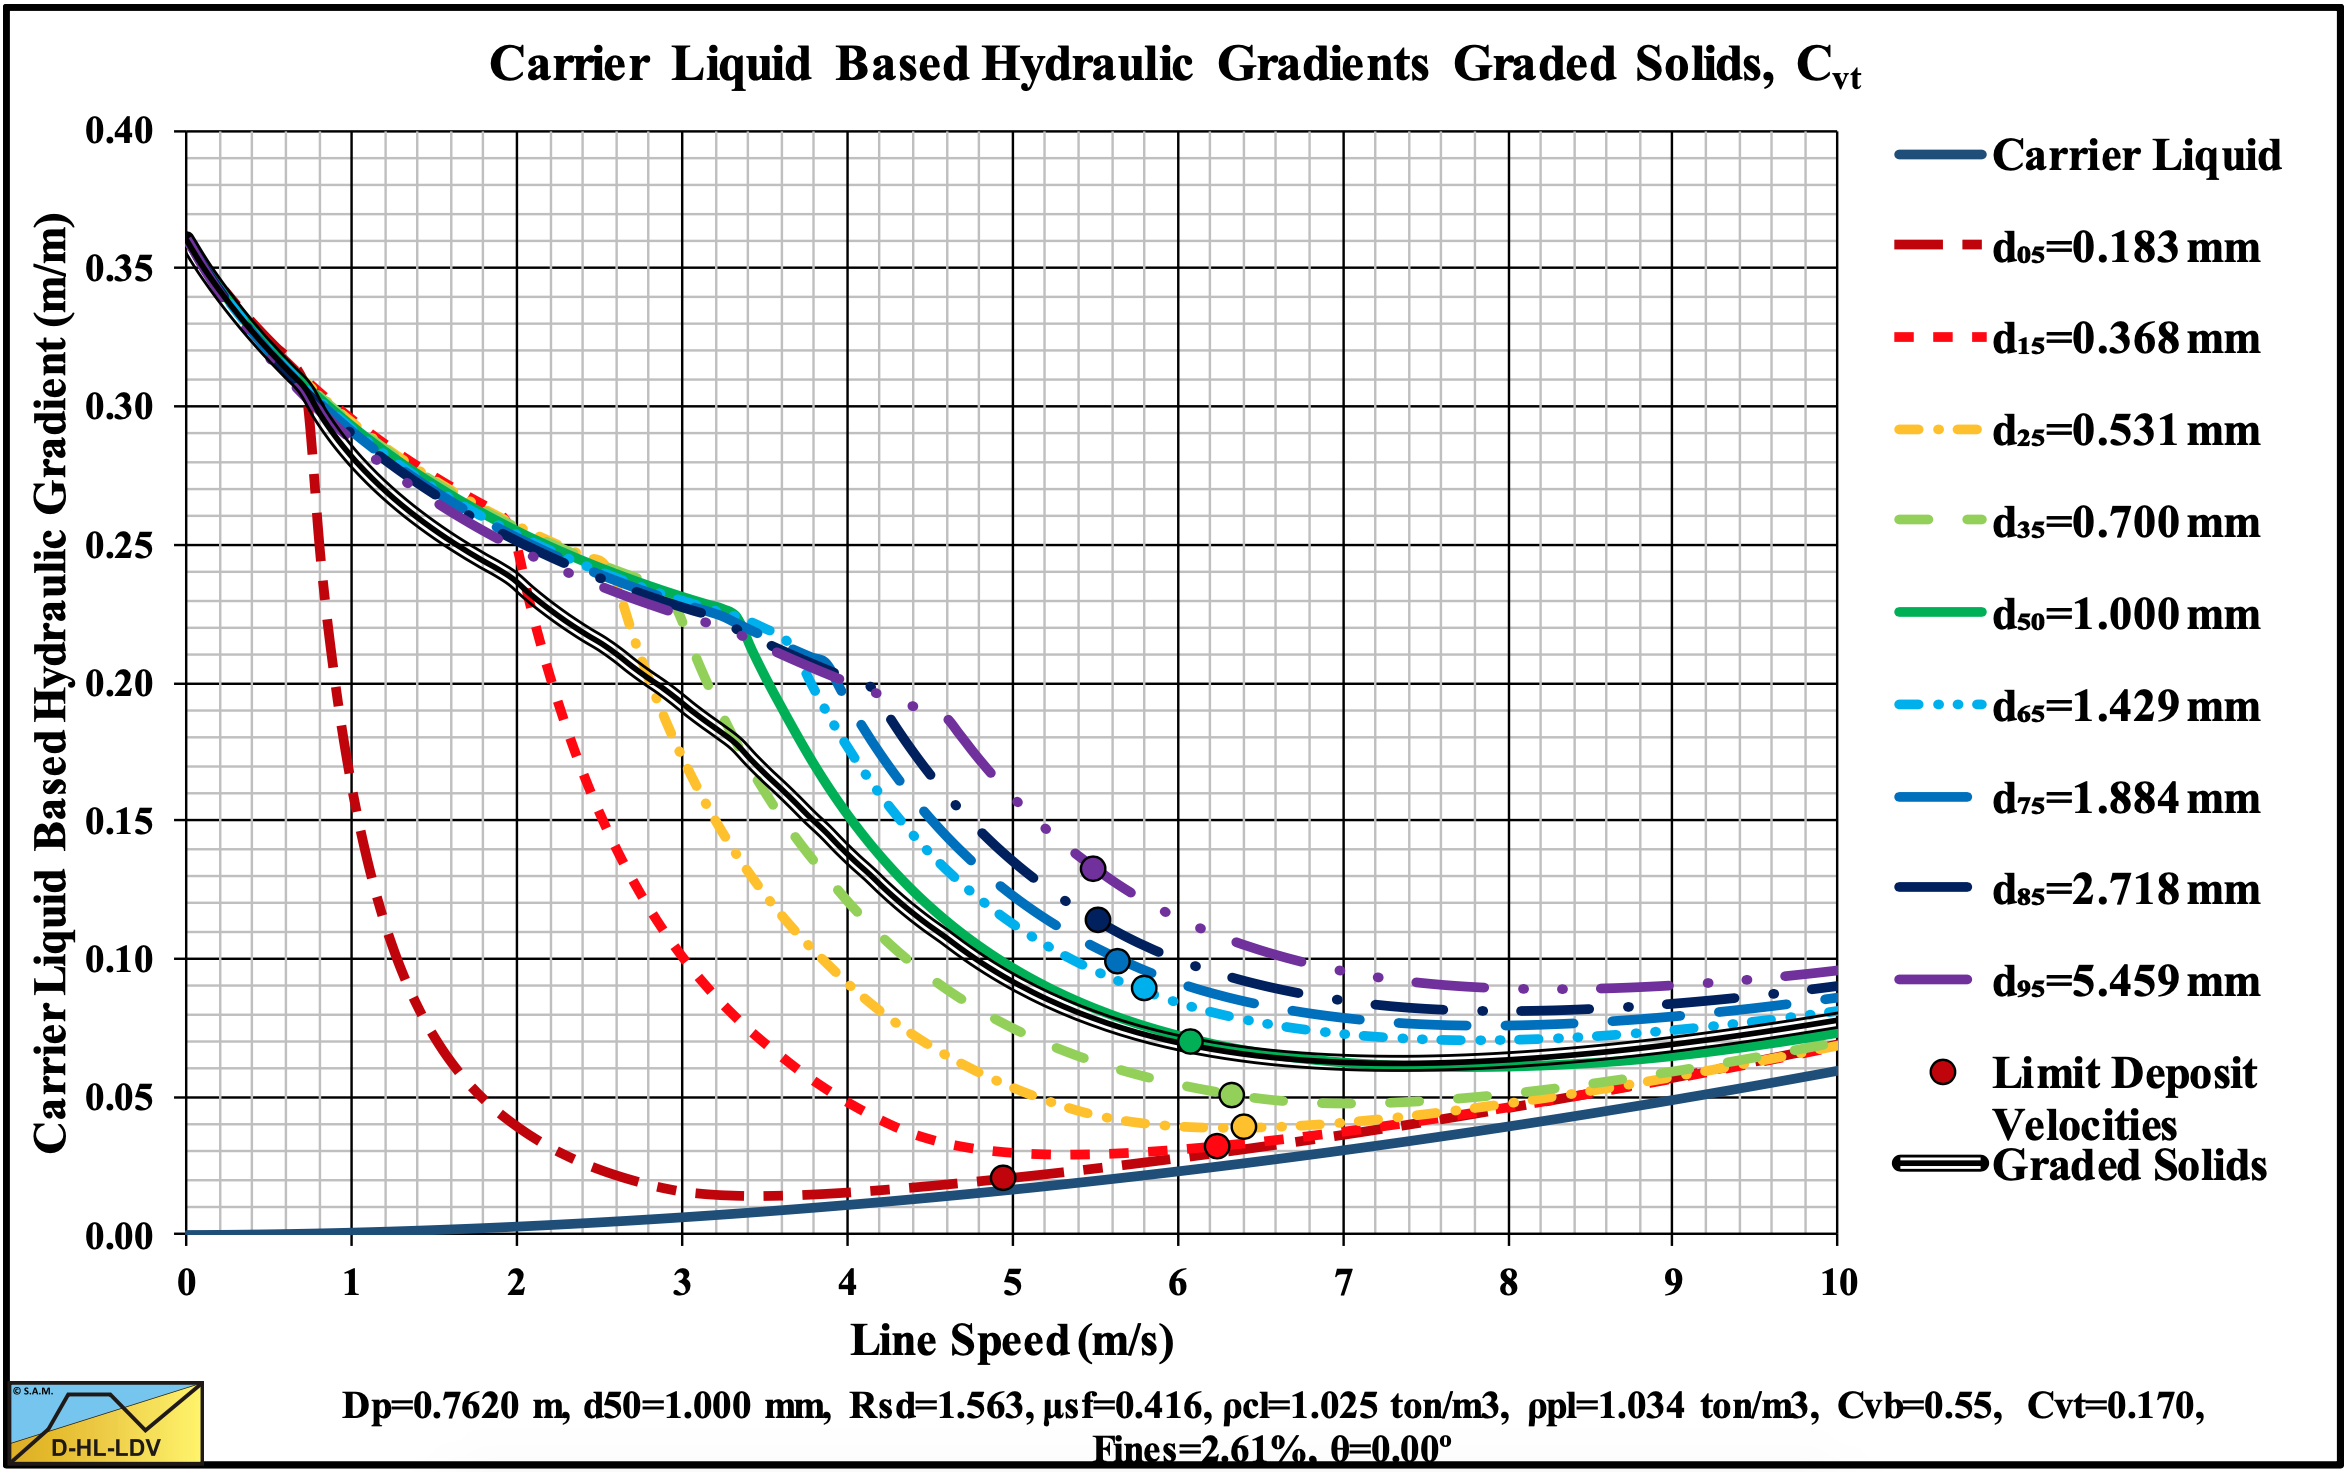
Figure 13.5-55: The hydraulic gradient versus the line speed for a graded sand, Cvt.
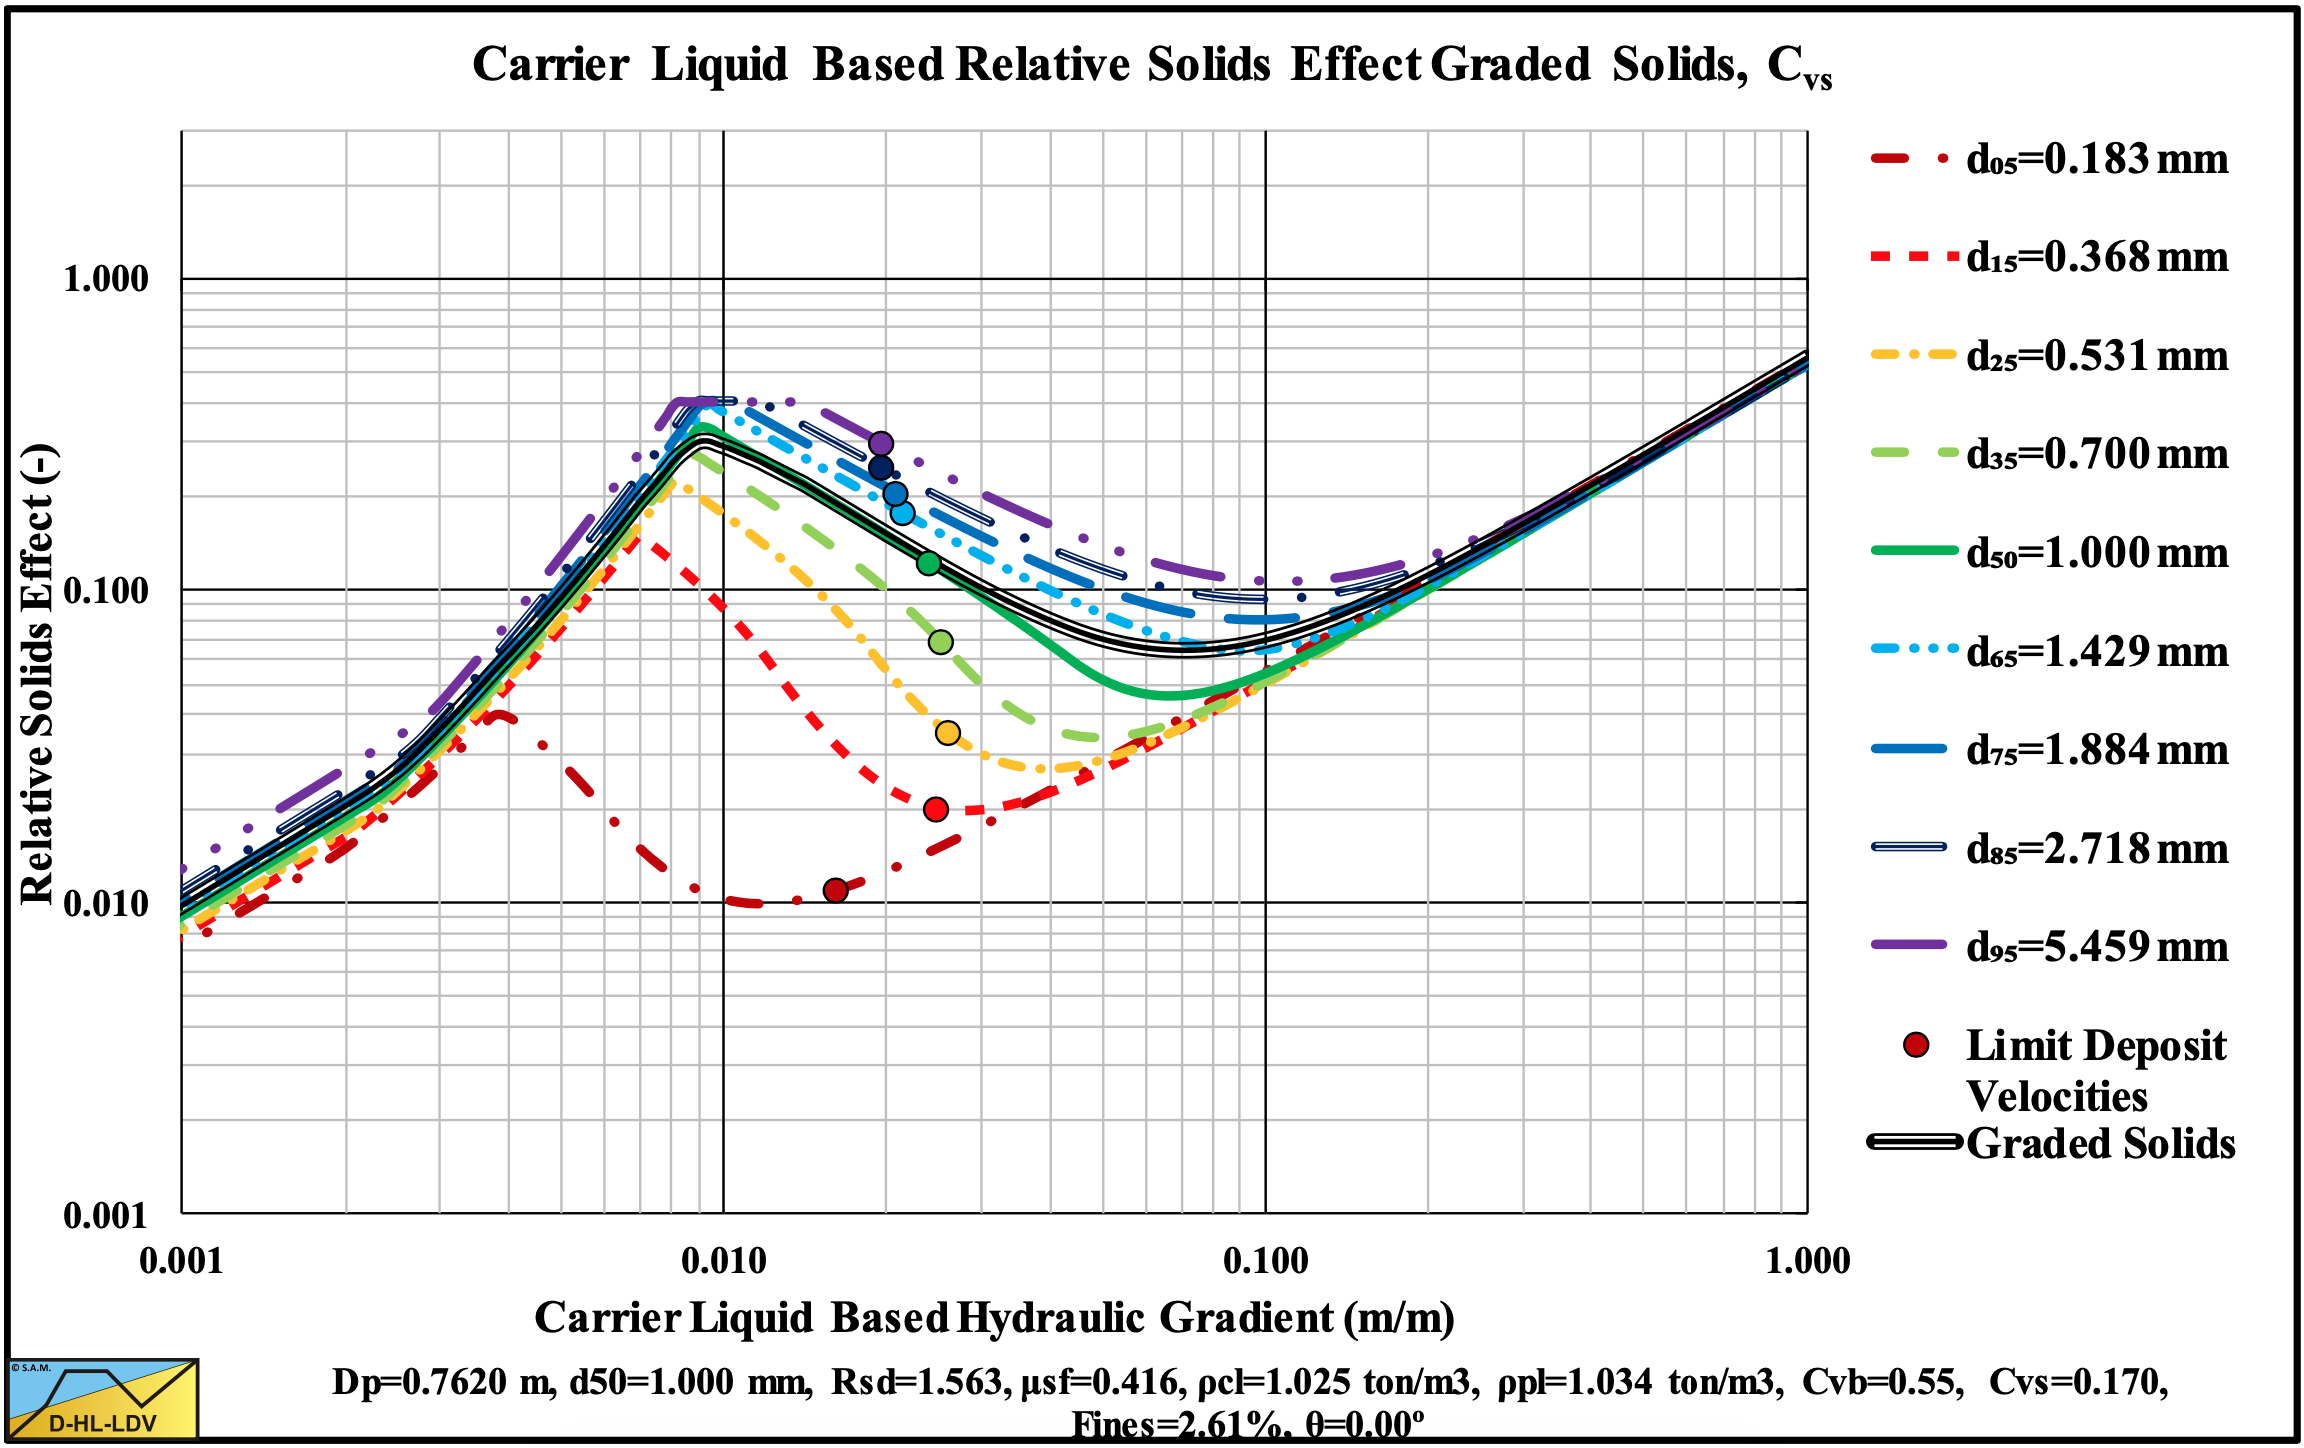
Figure 13.5-56: The relative excess hydraulic gradient versus the liquid hydraulic gradient for a graded sand, Cvs.
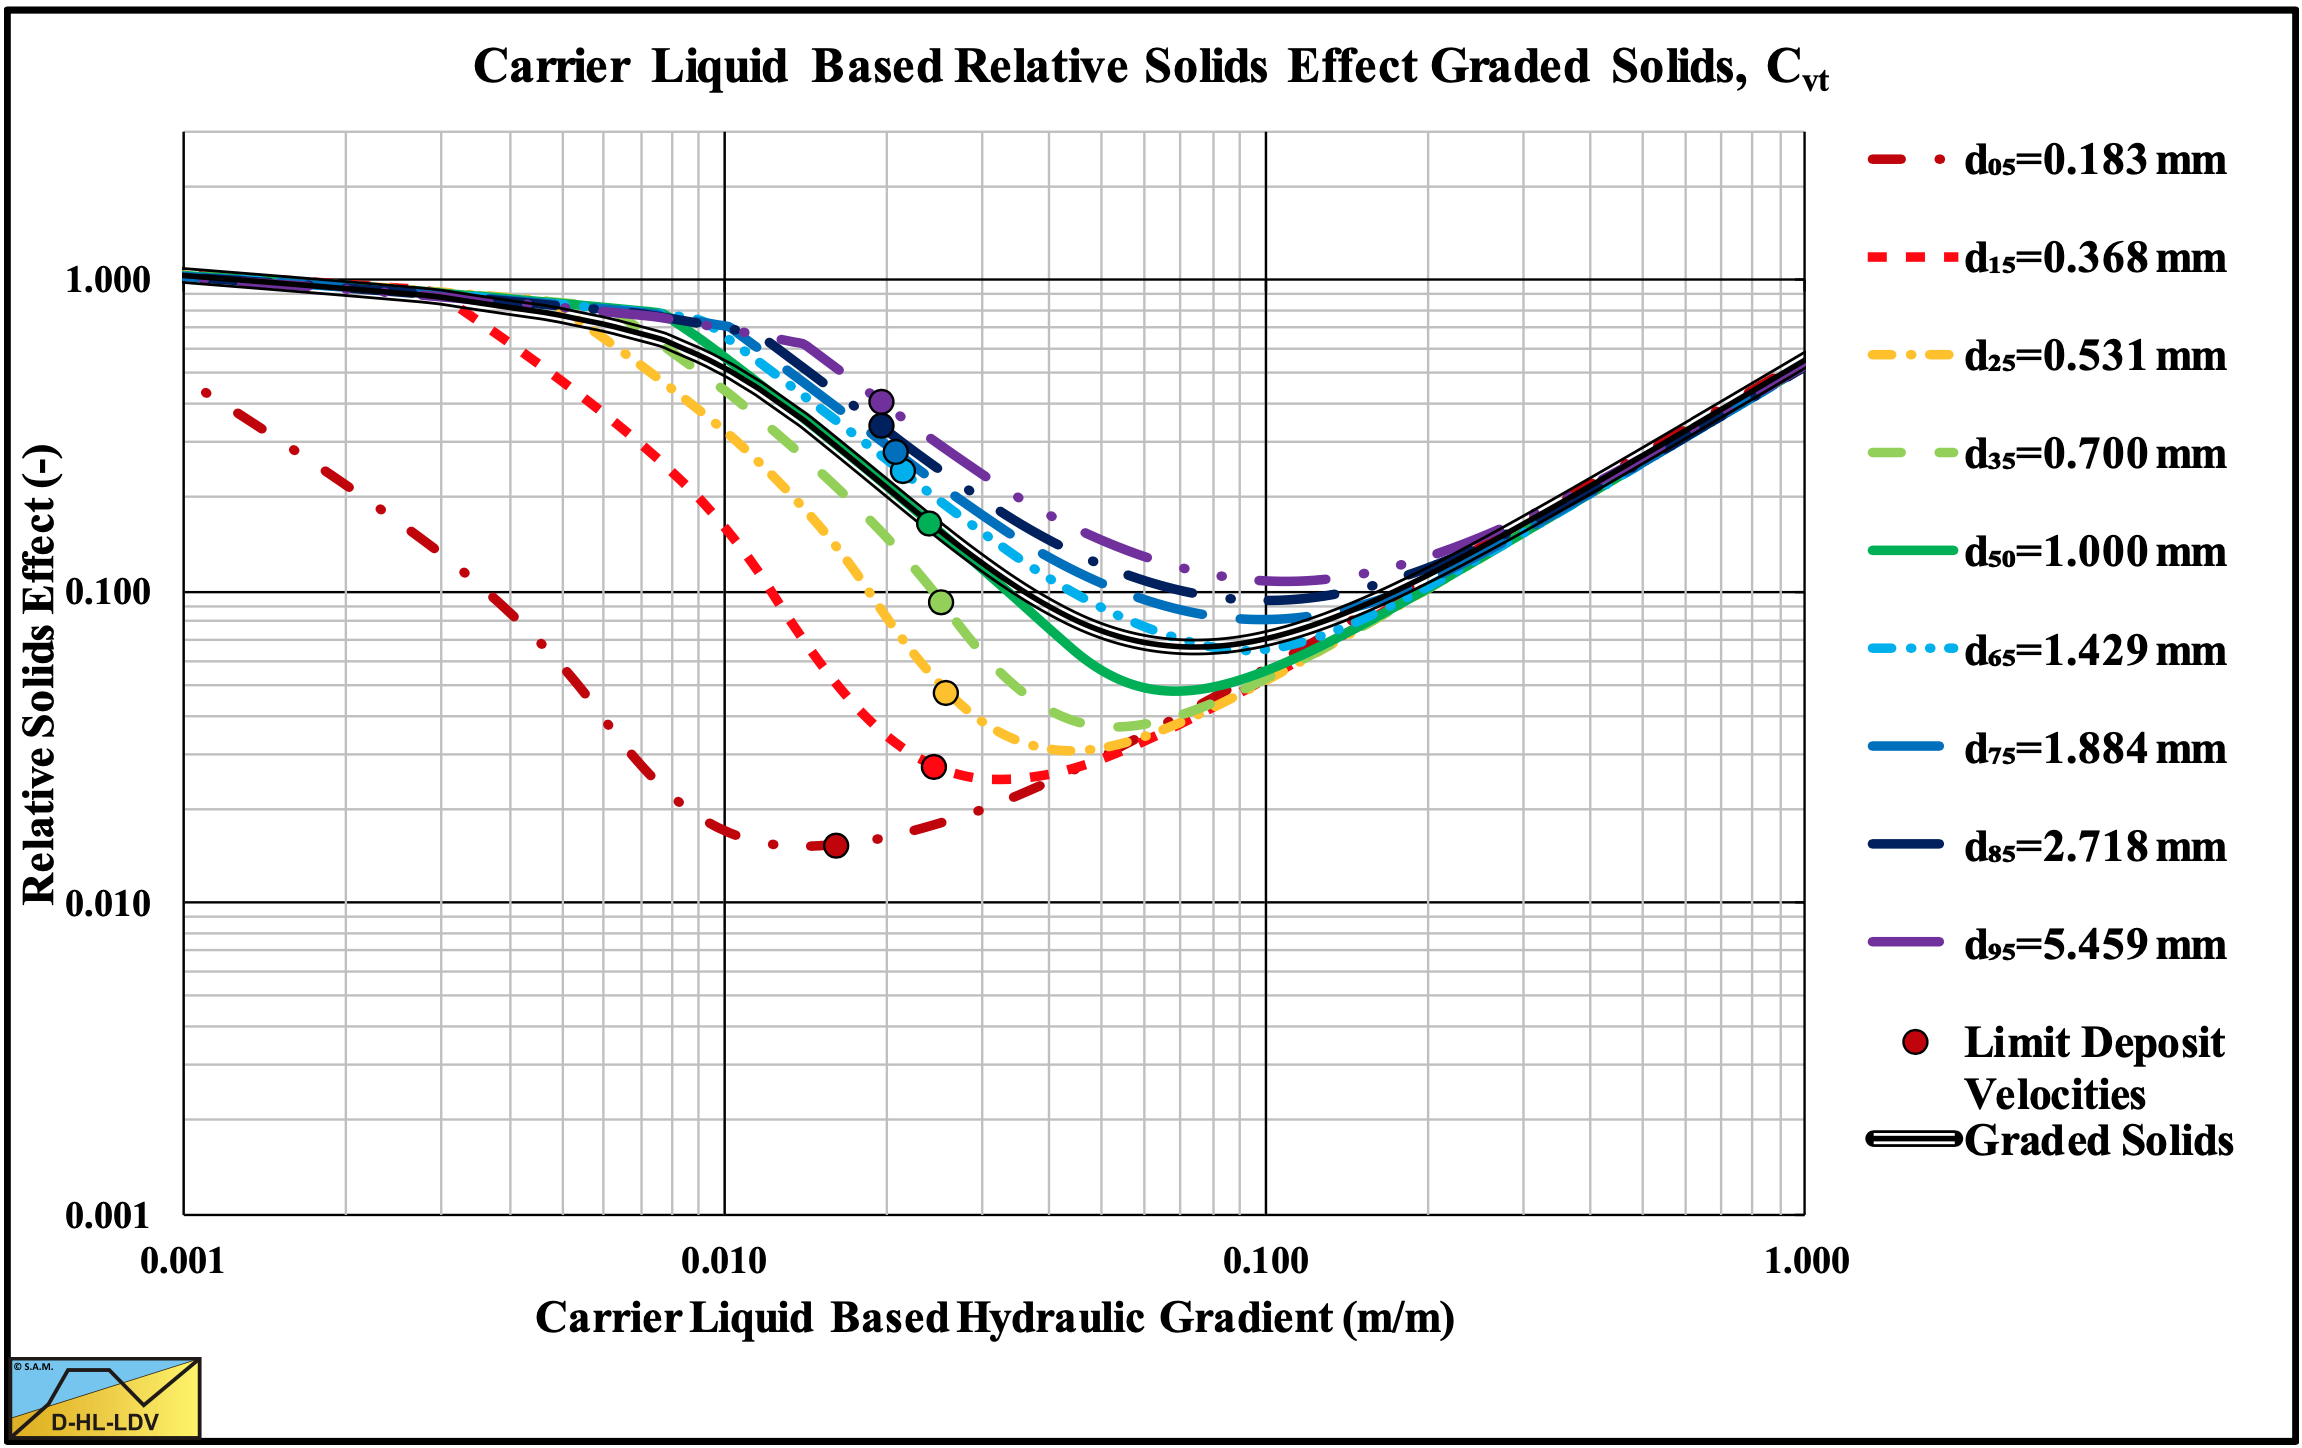
Figure 13.5-57: The relative excess hydraulic gradient versus the liquid hydraulic gradient for a graded sand, Cvt.
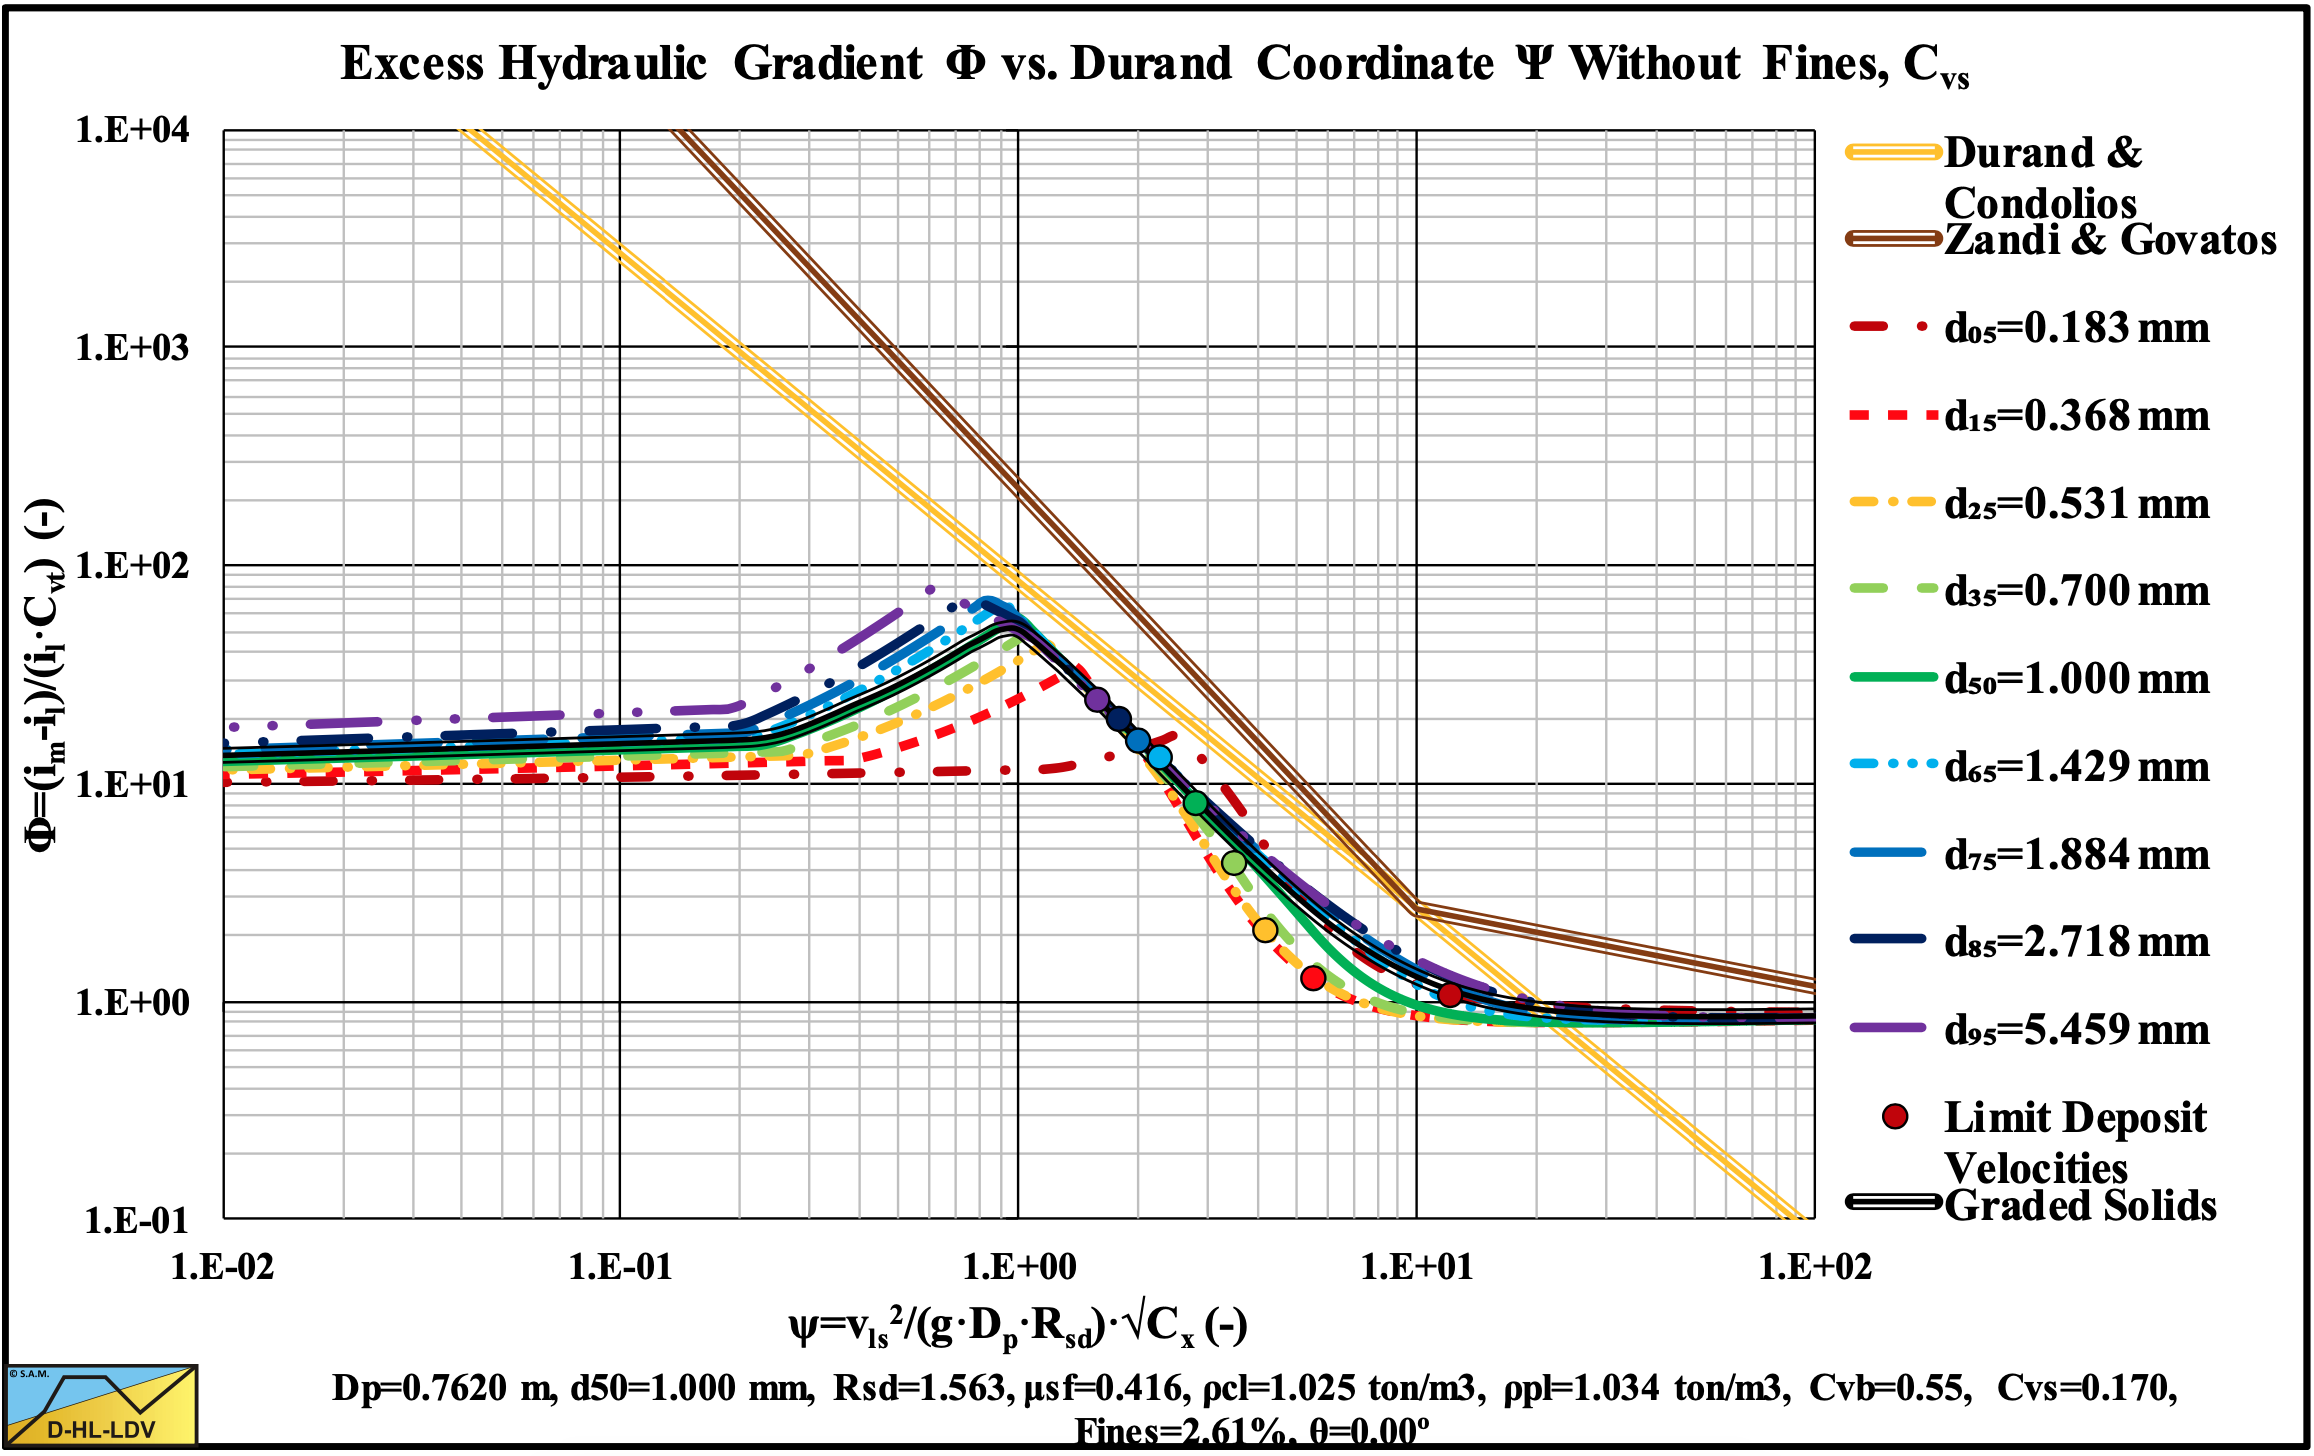
Figure 13.5-58: The hydraulic gradient on Durand coordinates for a graded sand, Cvs.
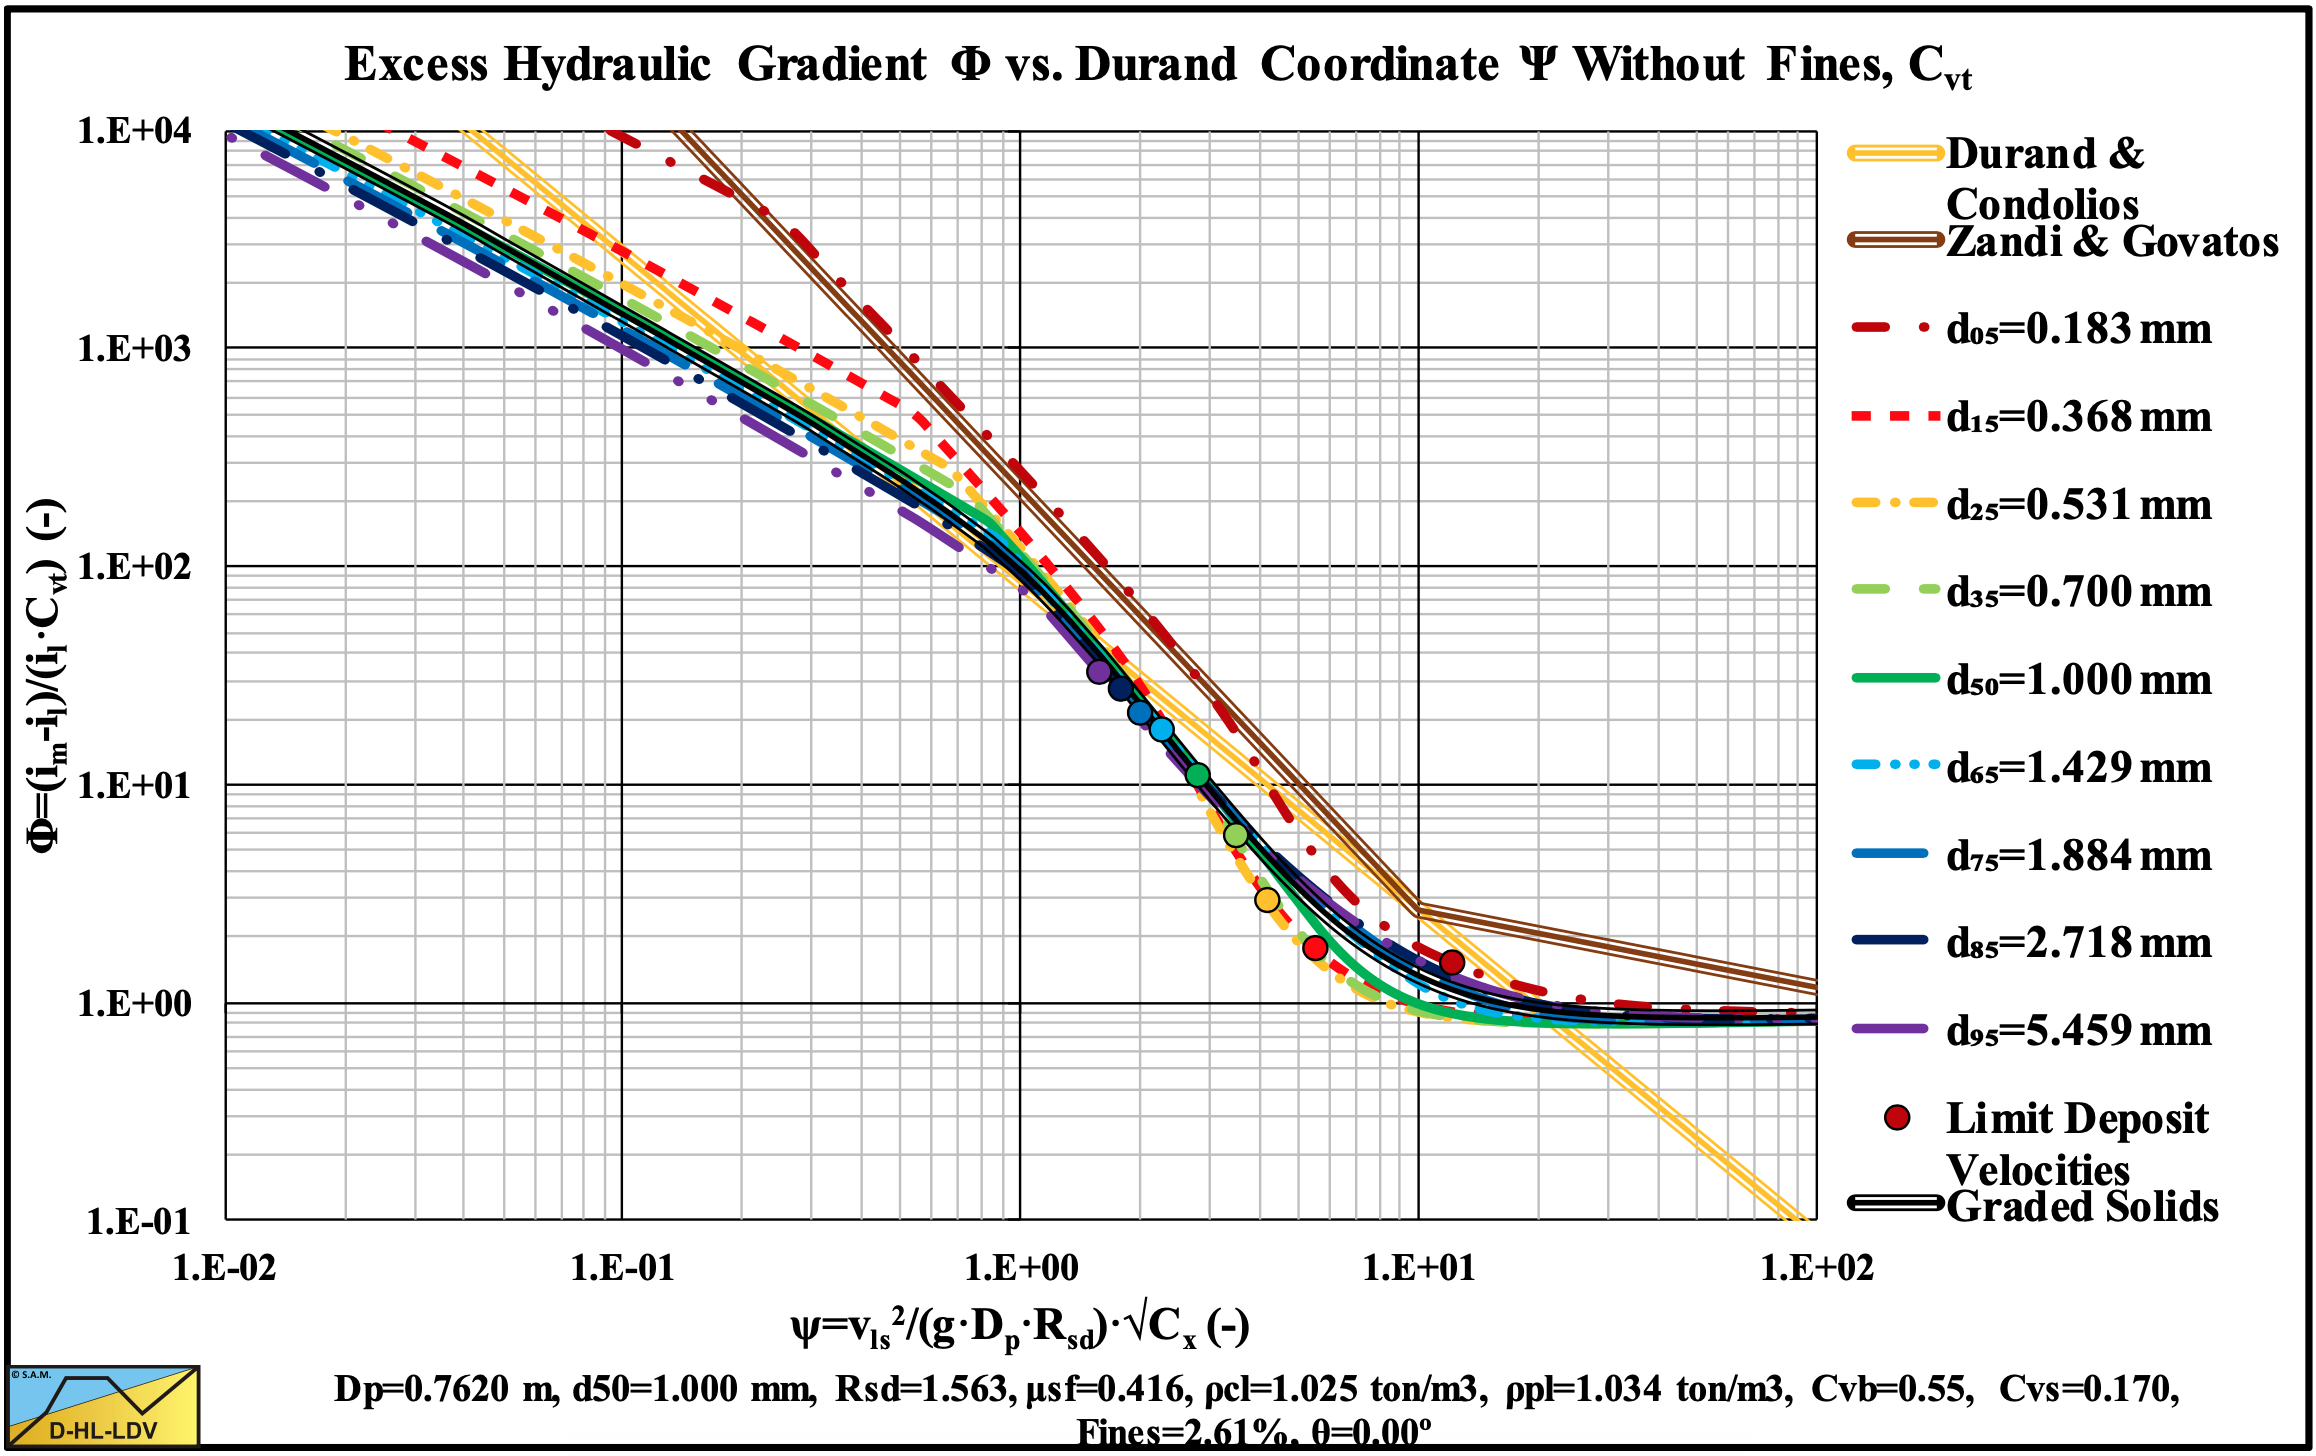
Figure 13.5-59: The hydraulic gradient on Durand coordinates for a graded sand, Cvt.
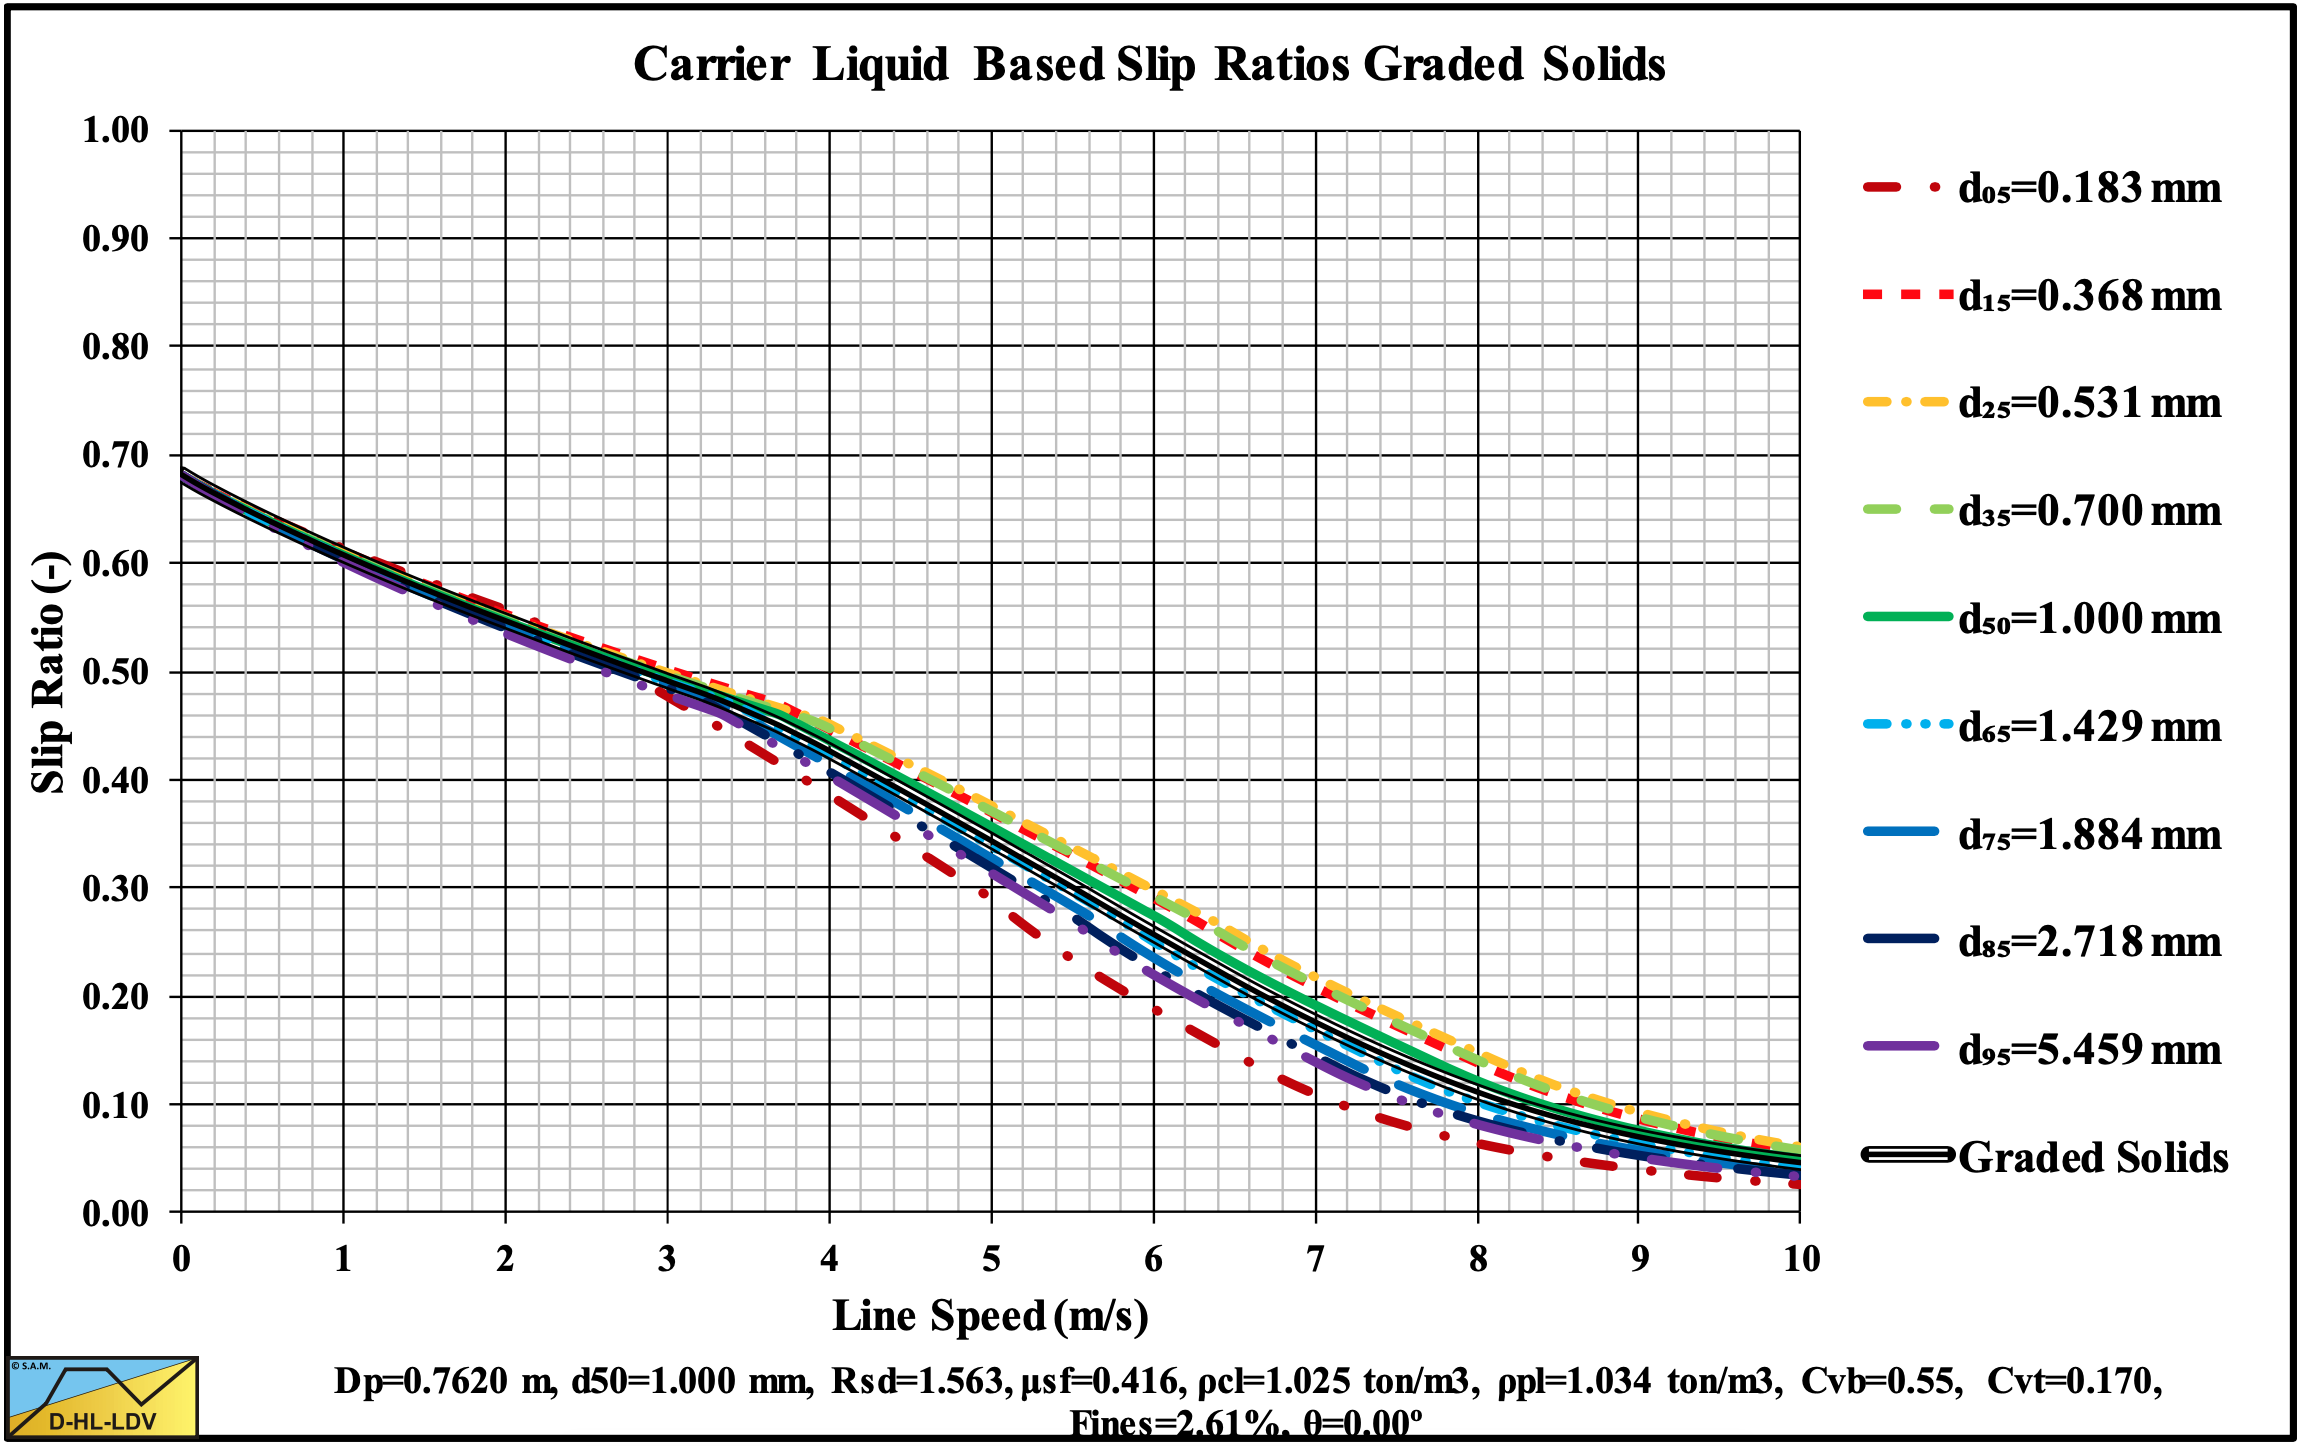
Figure 13.5-60: The slip ratio for a graded sand.
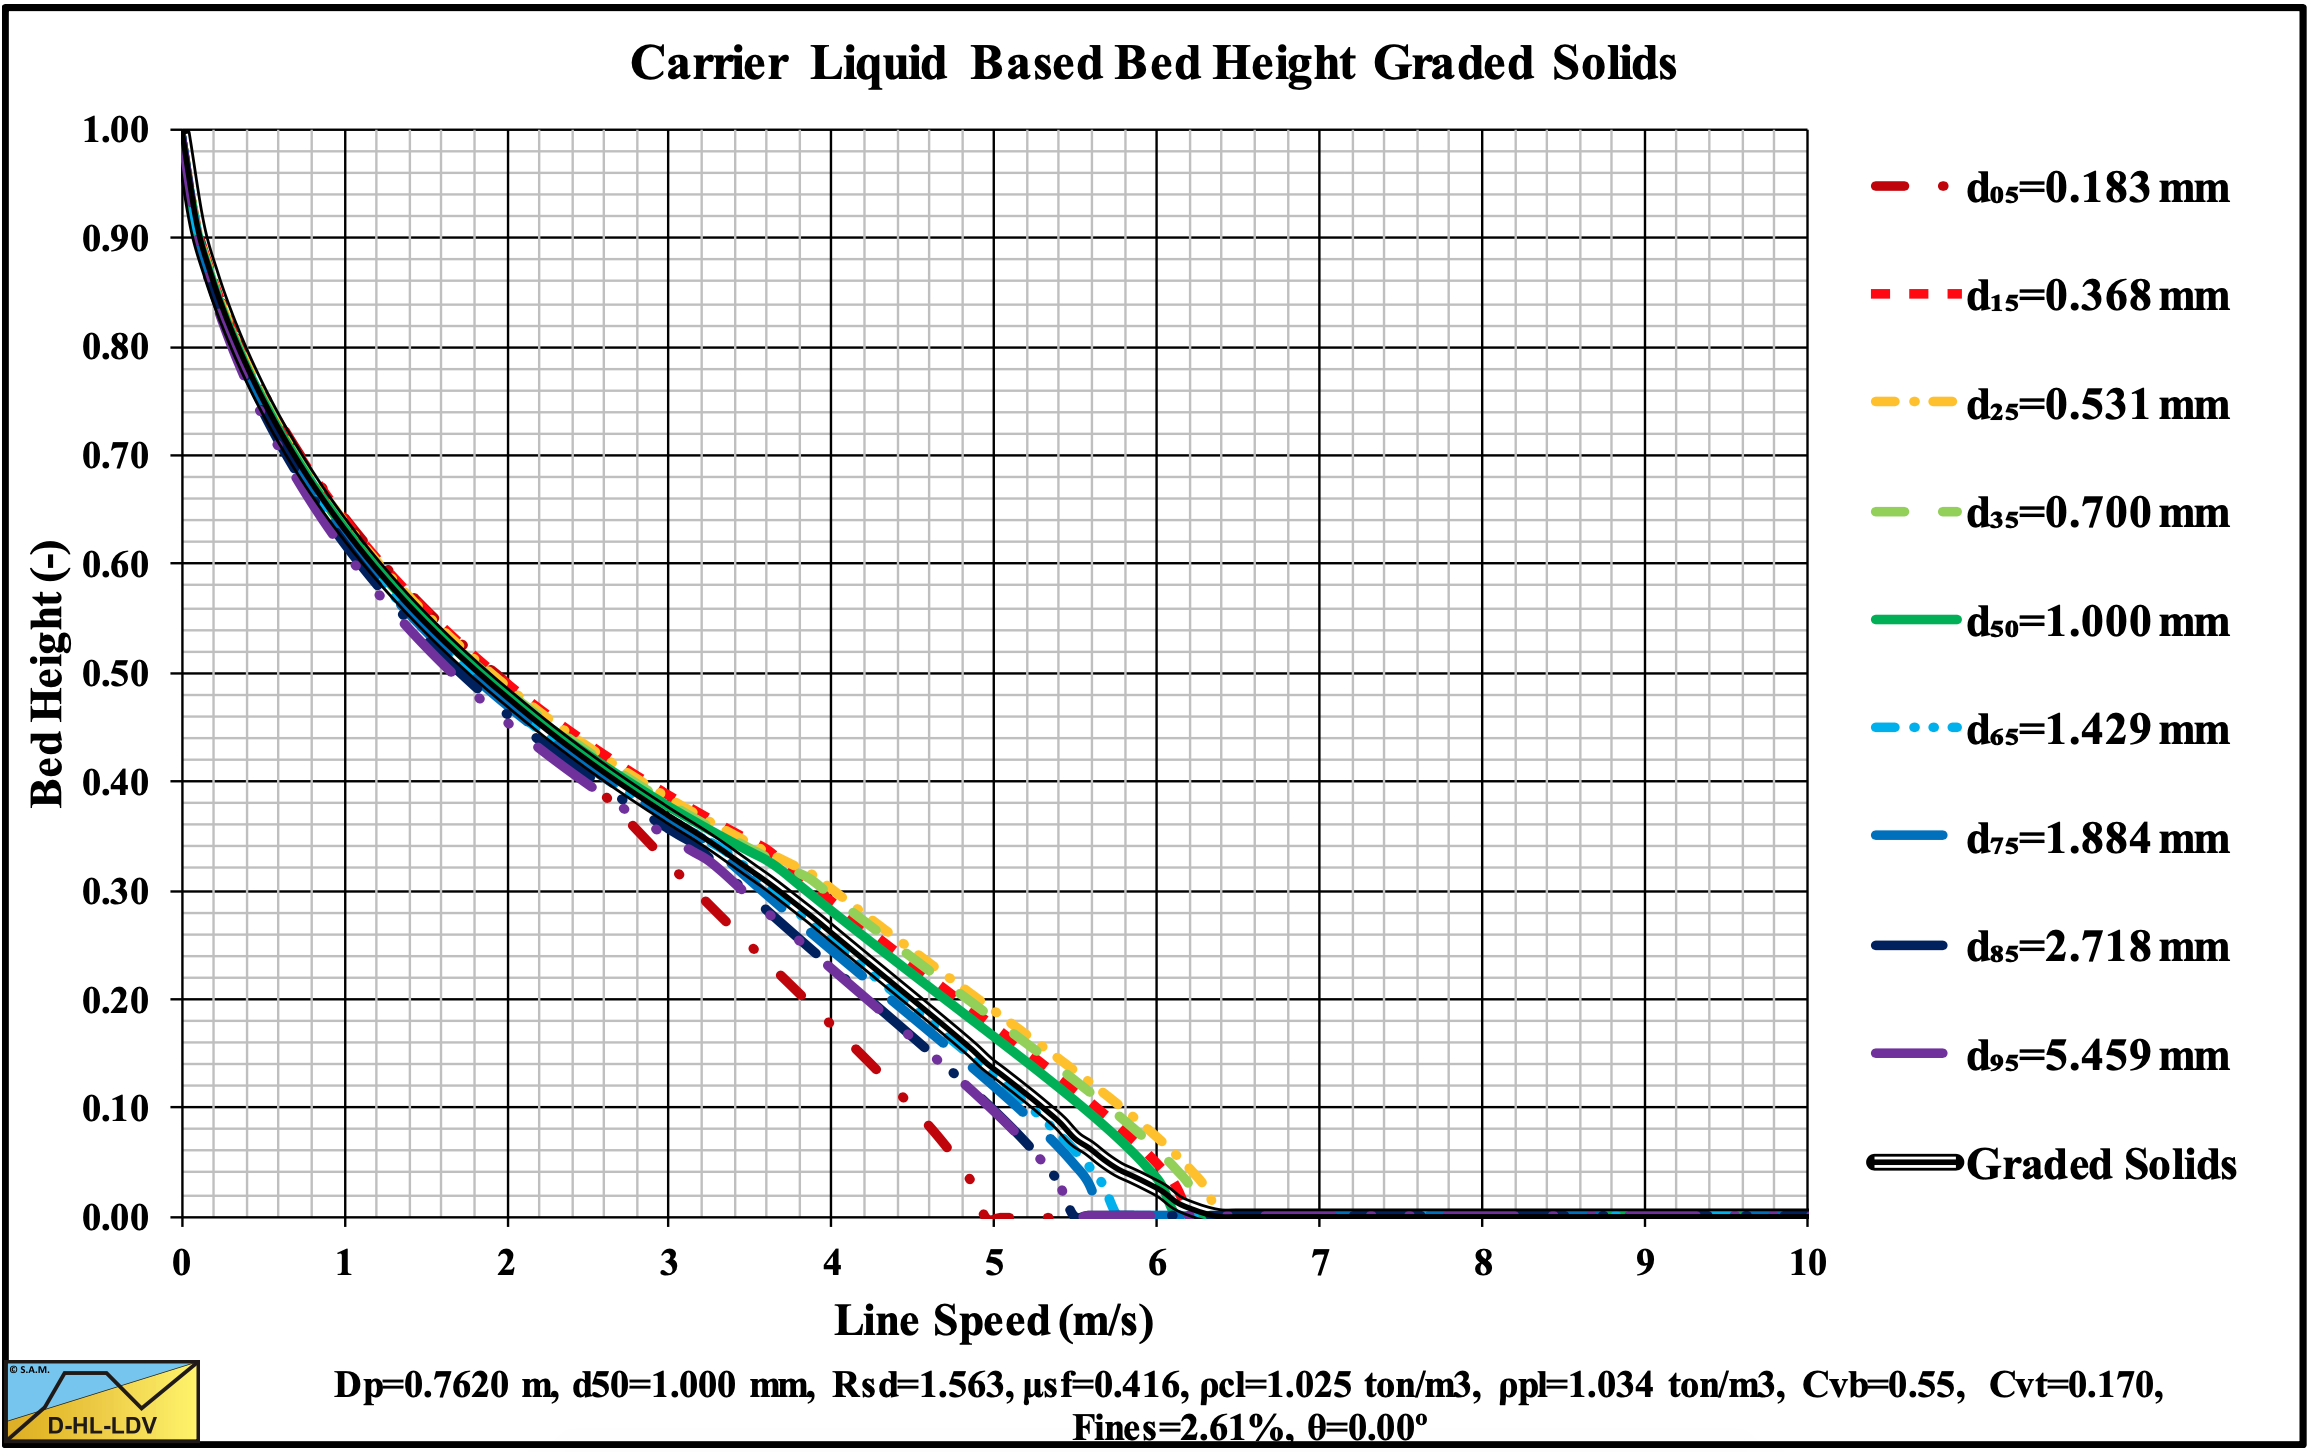
Figure 13.5-61: The bed height for a graded sand.
13.5.8 Flow Regime Transitions 9 Concentrations
Figure 13.5-62: The Limit Deposit Velocity at 9 volumetric concentrations.
Figure 13.5-63: The transition Fixed Bed-Sliding Bed (LSDV) at 9 volumetric concentrations.
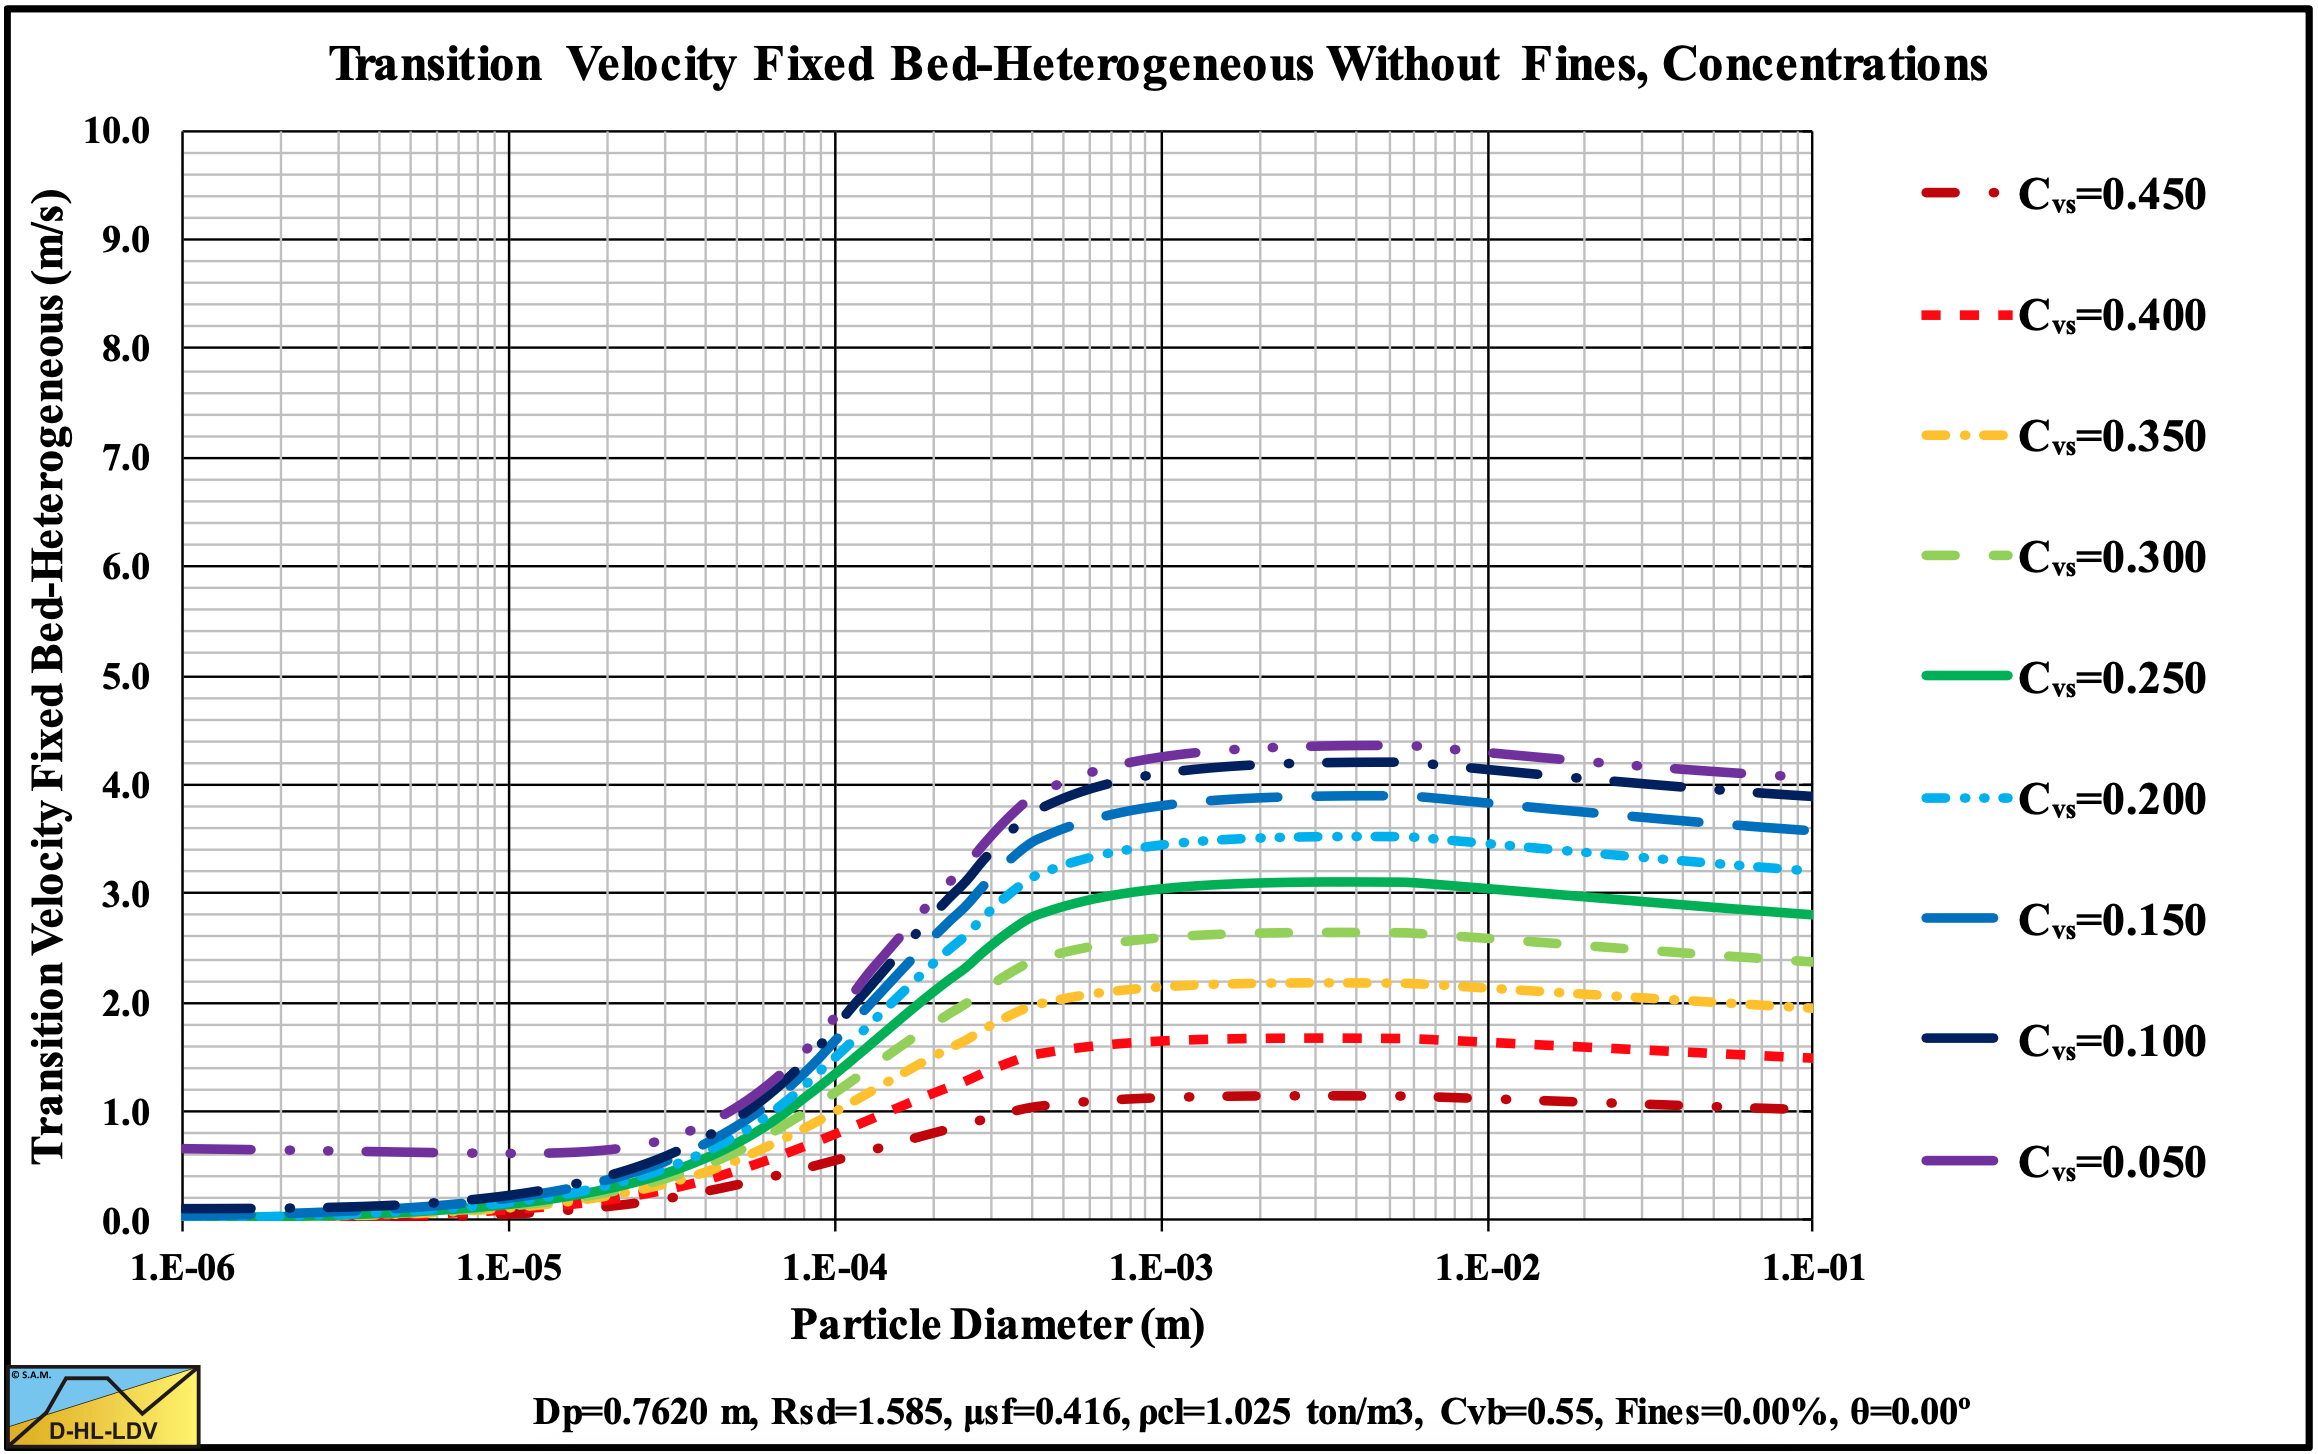
Figure 13.5-64: The transition Fixed Bed-Heterogeneous Regime at 9 volumetric concentrations.
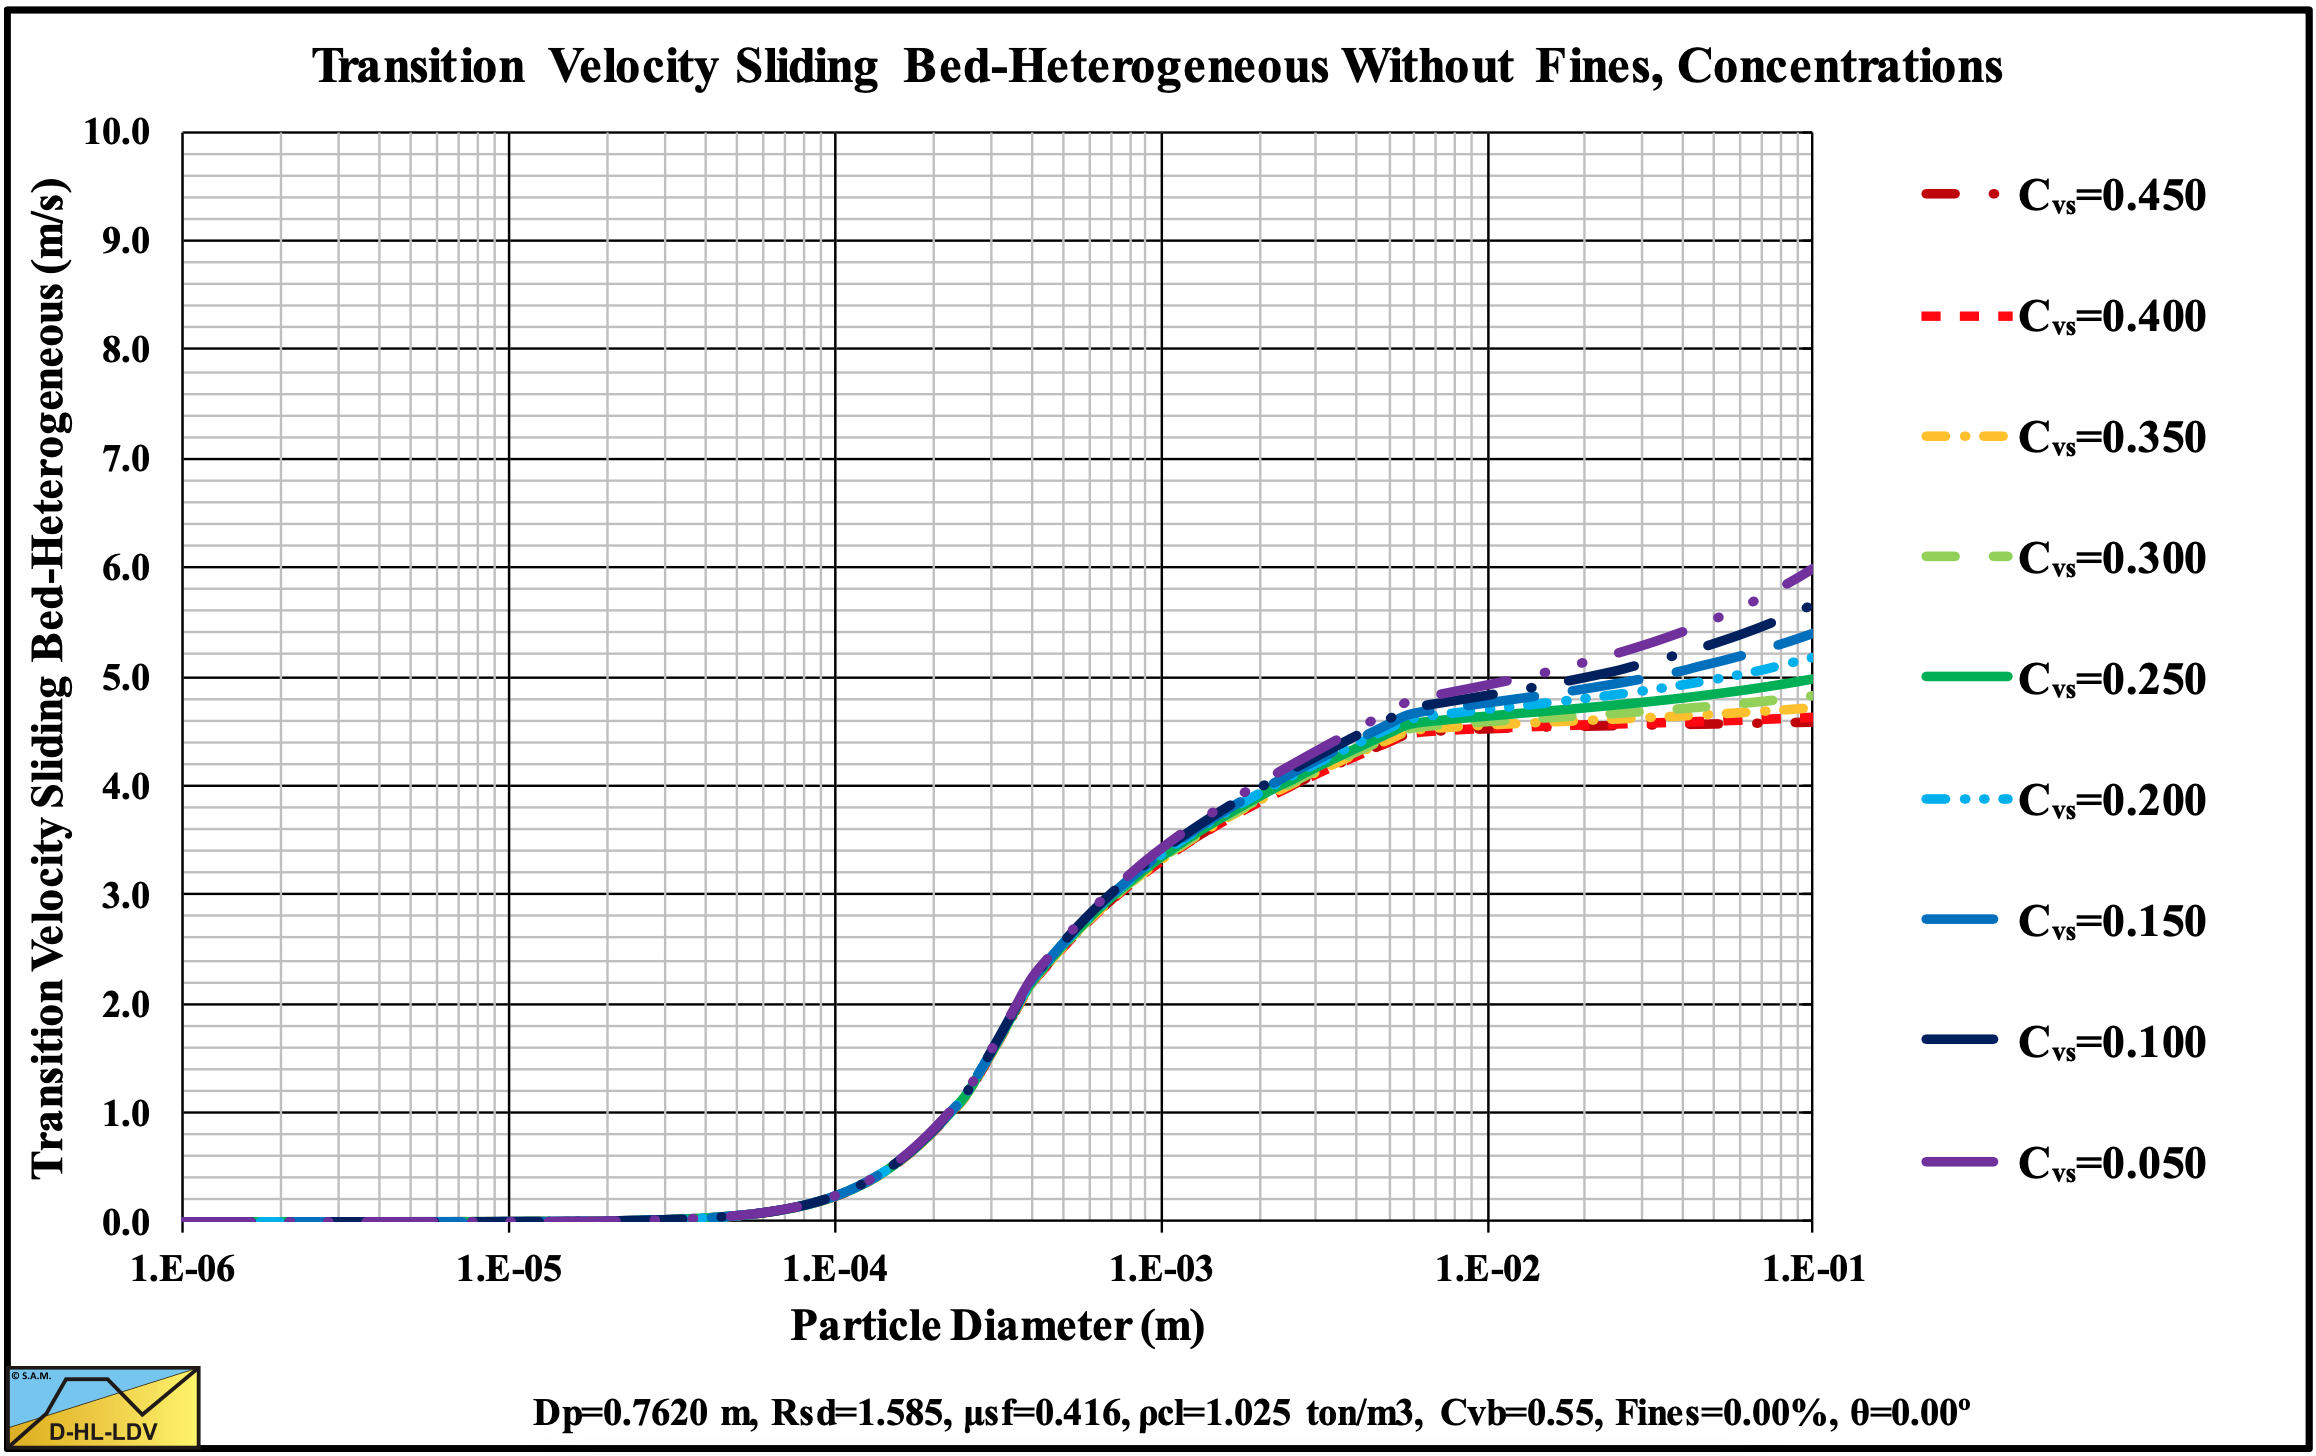
Figure 13.5-65: The transition Sliding Bed-Heterogeneous Regime at 9 volumetric concentrations.
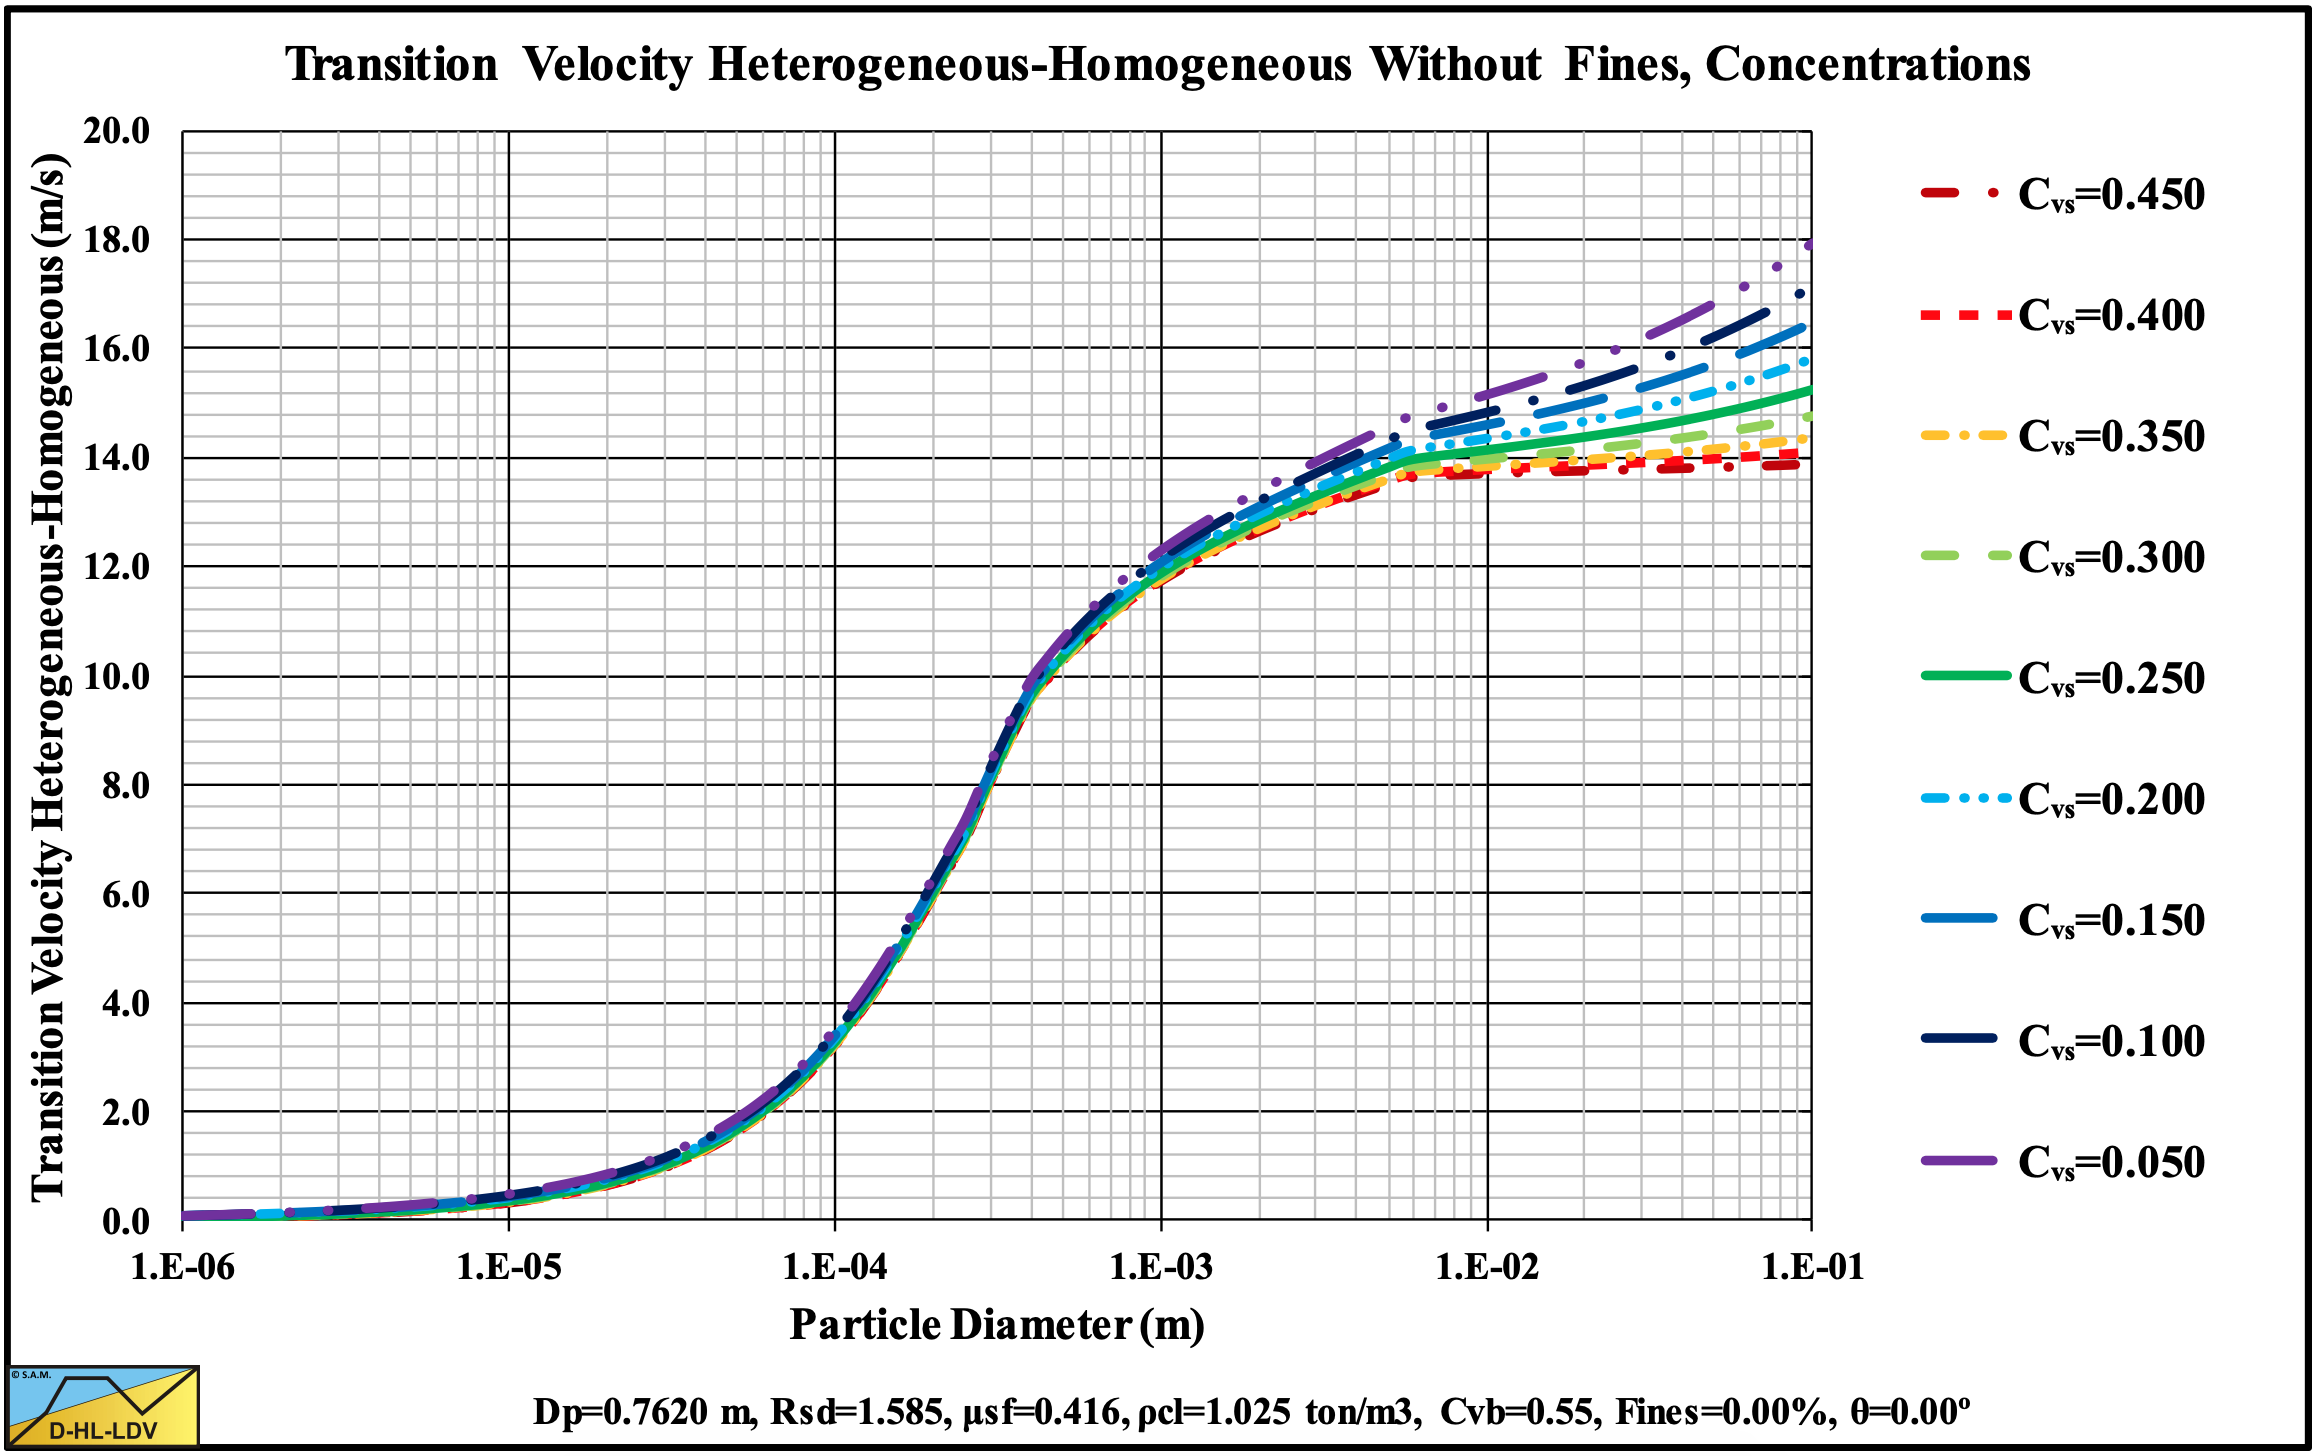
Figure 13.5-66: The transition Heterogeneous-Homogeneous at 9 volumetric concentrations.
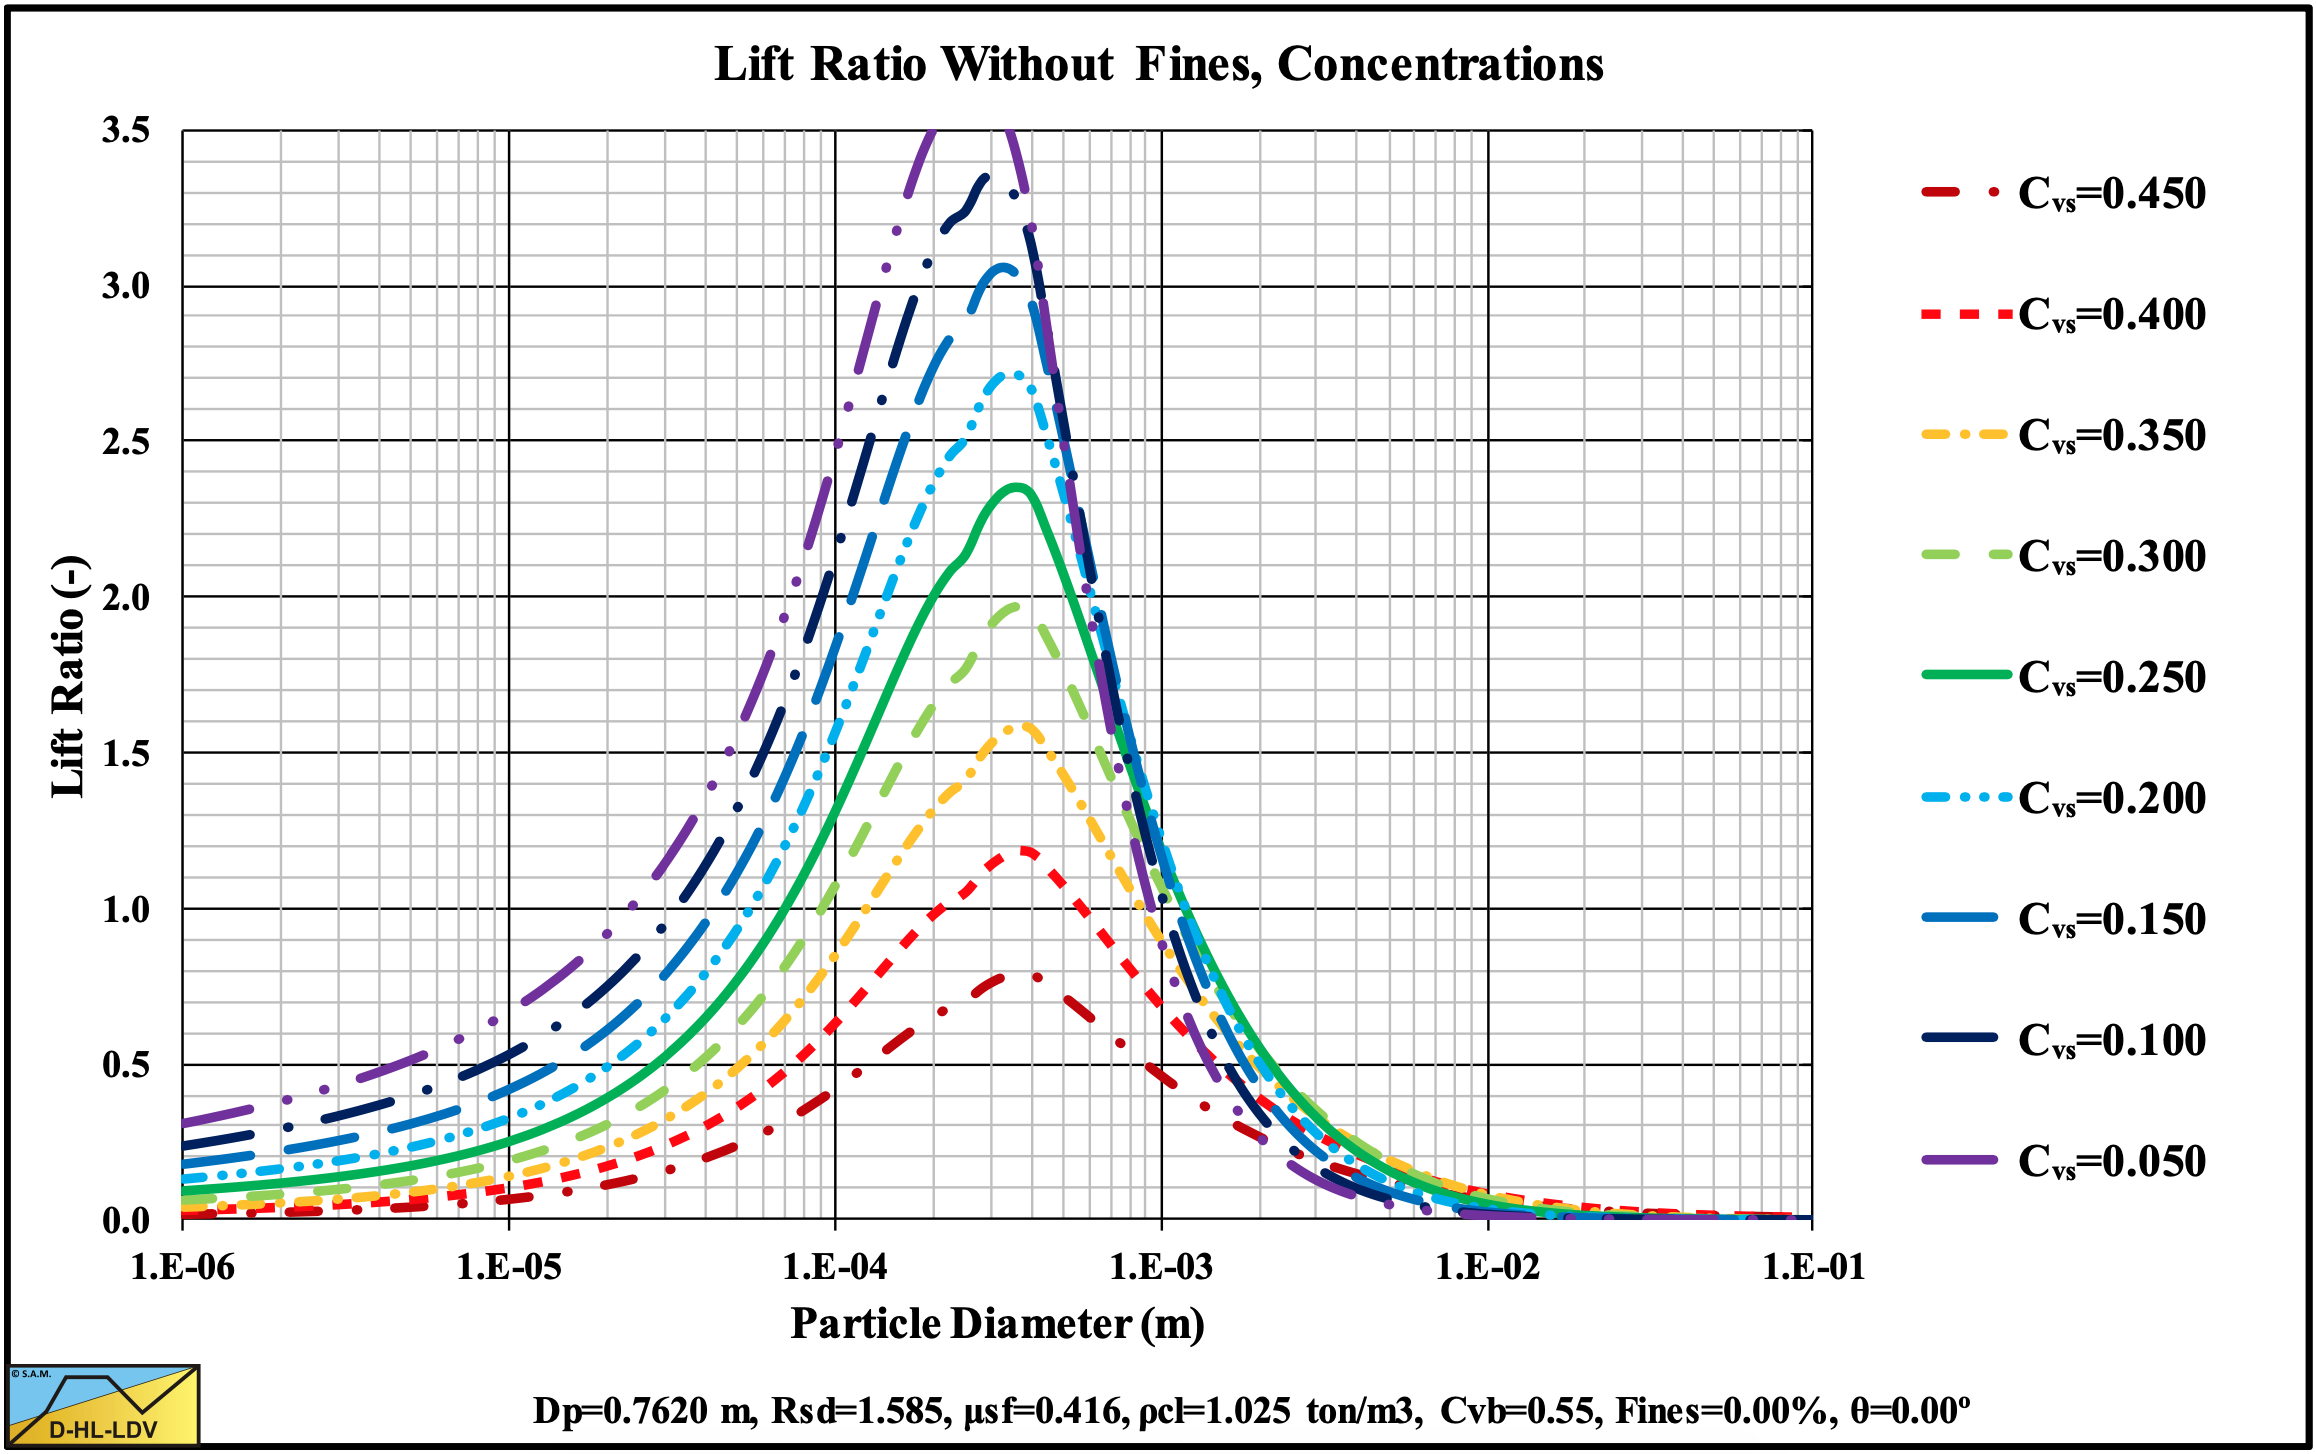
Figure 13.5-67: The lift ratio (near wall lift to gravity ratio) at 9 volumetric concentrations.
13.5.9 Flow Regime Transitions 9 Pipe Diameters
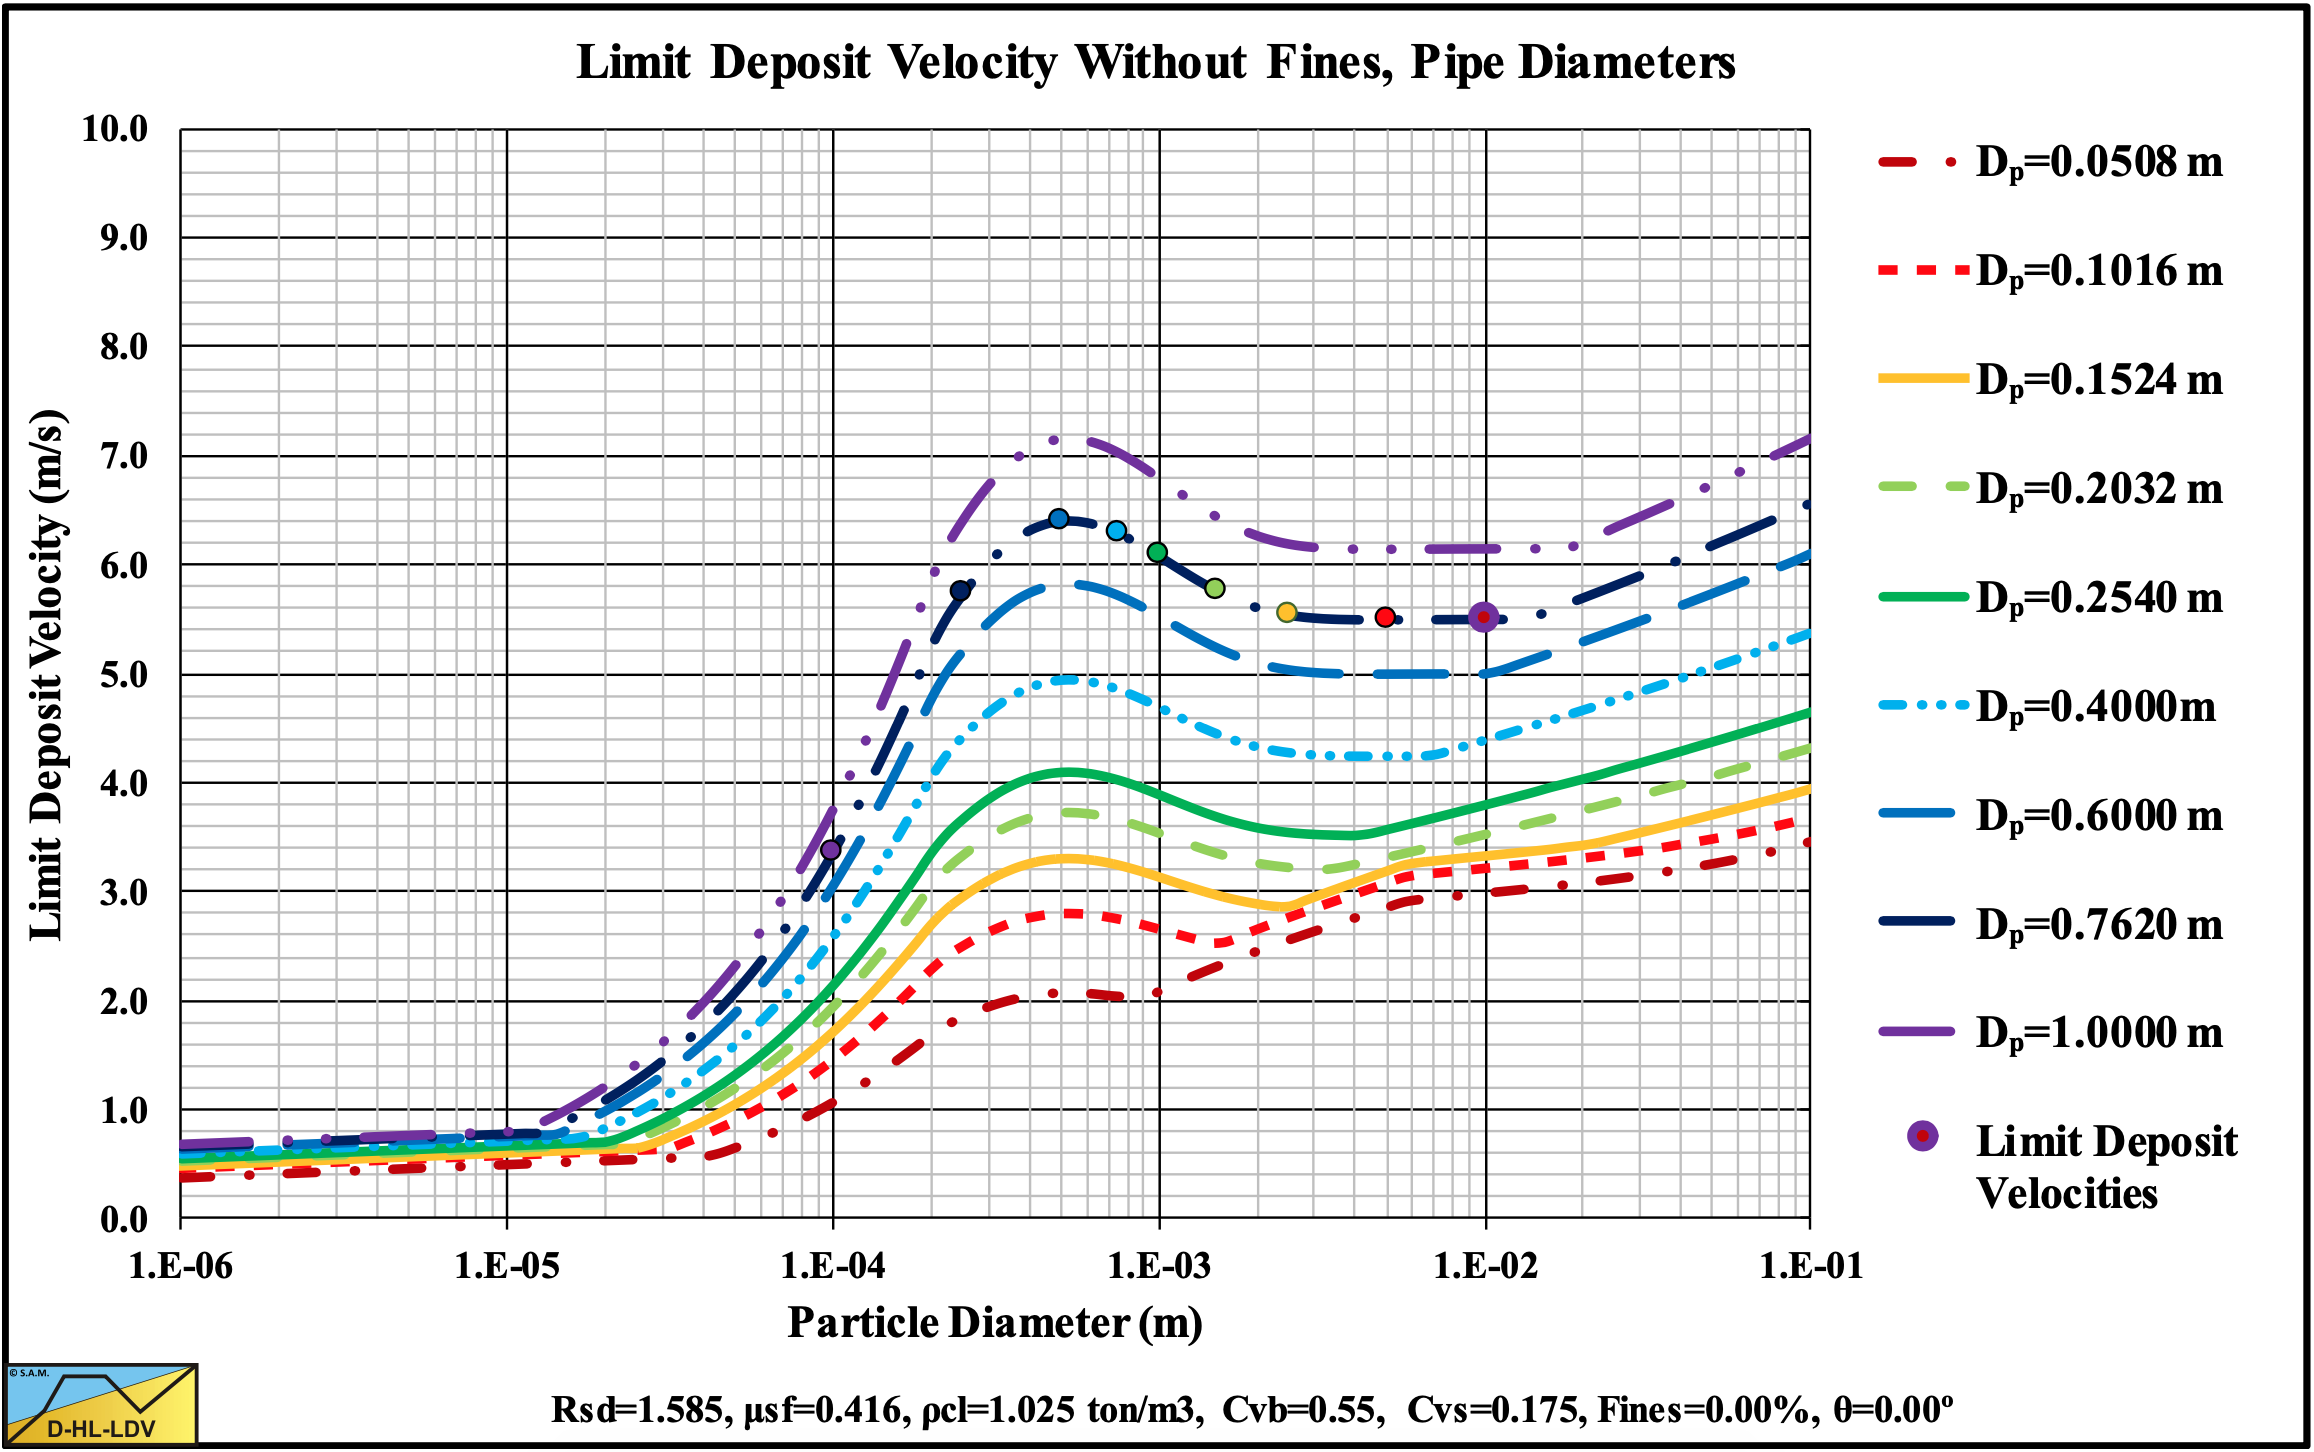
Figure 13.5-68: The Limit Deposit Velocity at 9 pipe diameters.
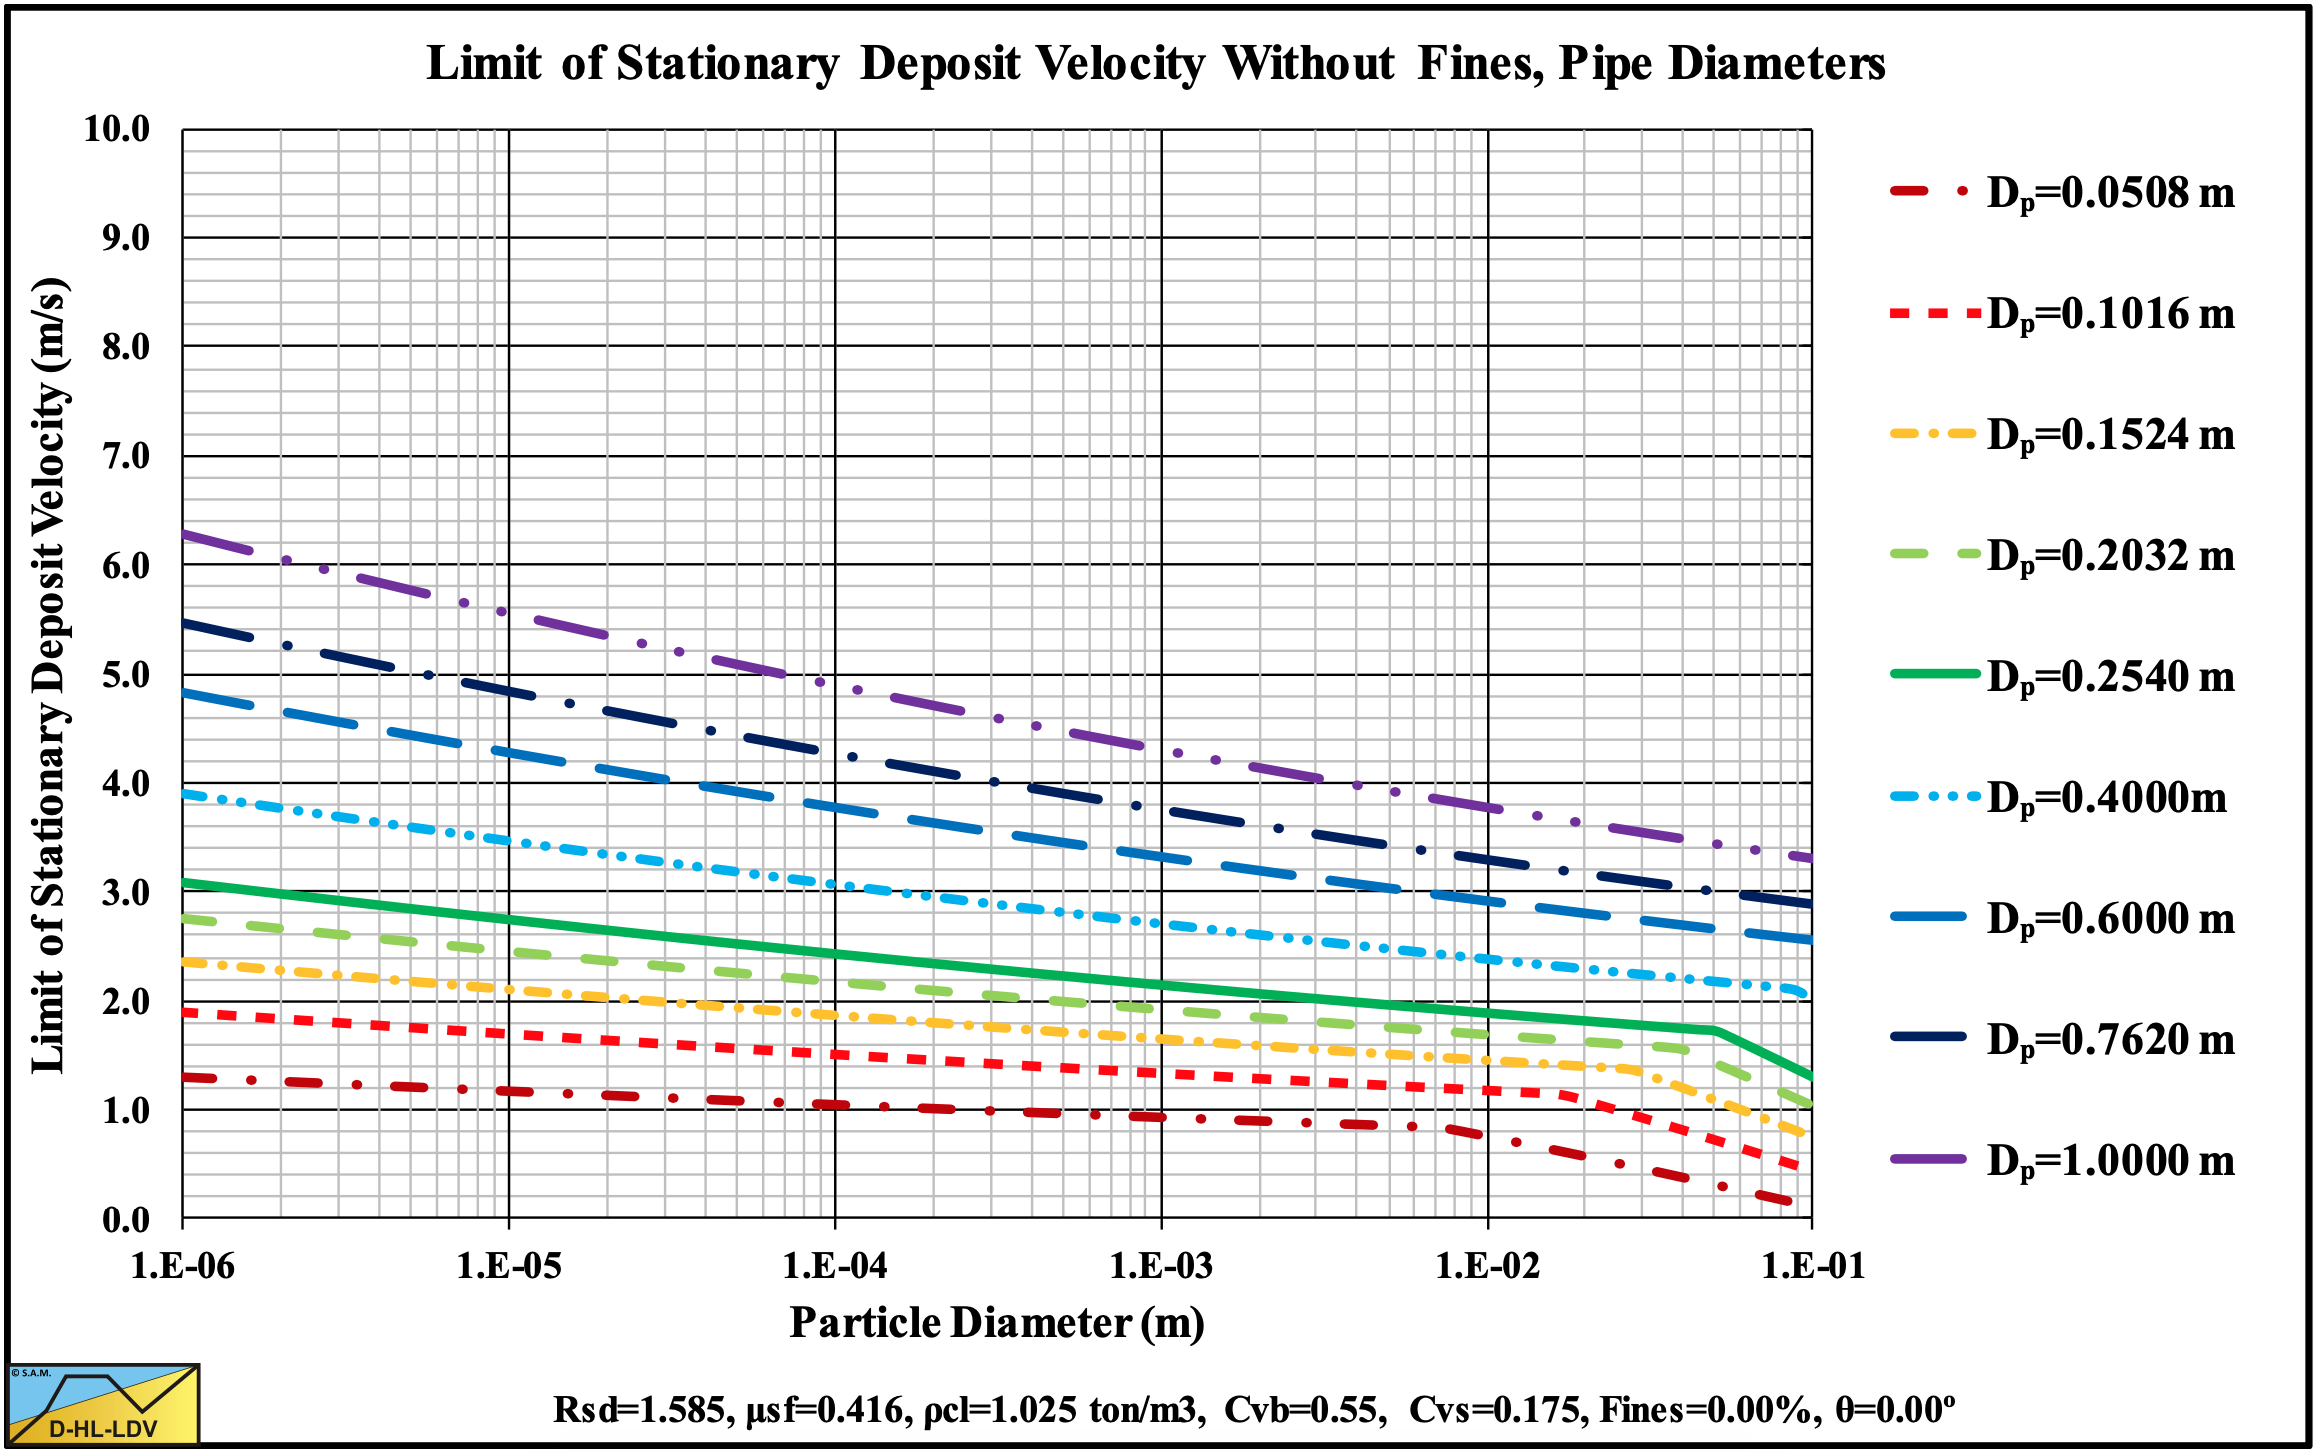
Figure 13.5-69: The transition Fixed Bed-Sliding Bed (LSDV) at 9 pipe diameters.
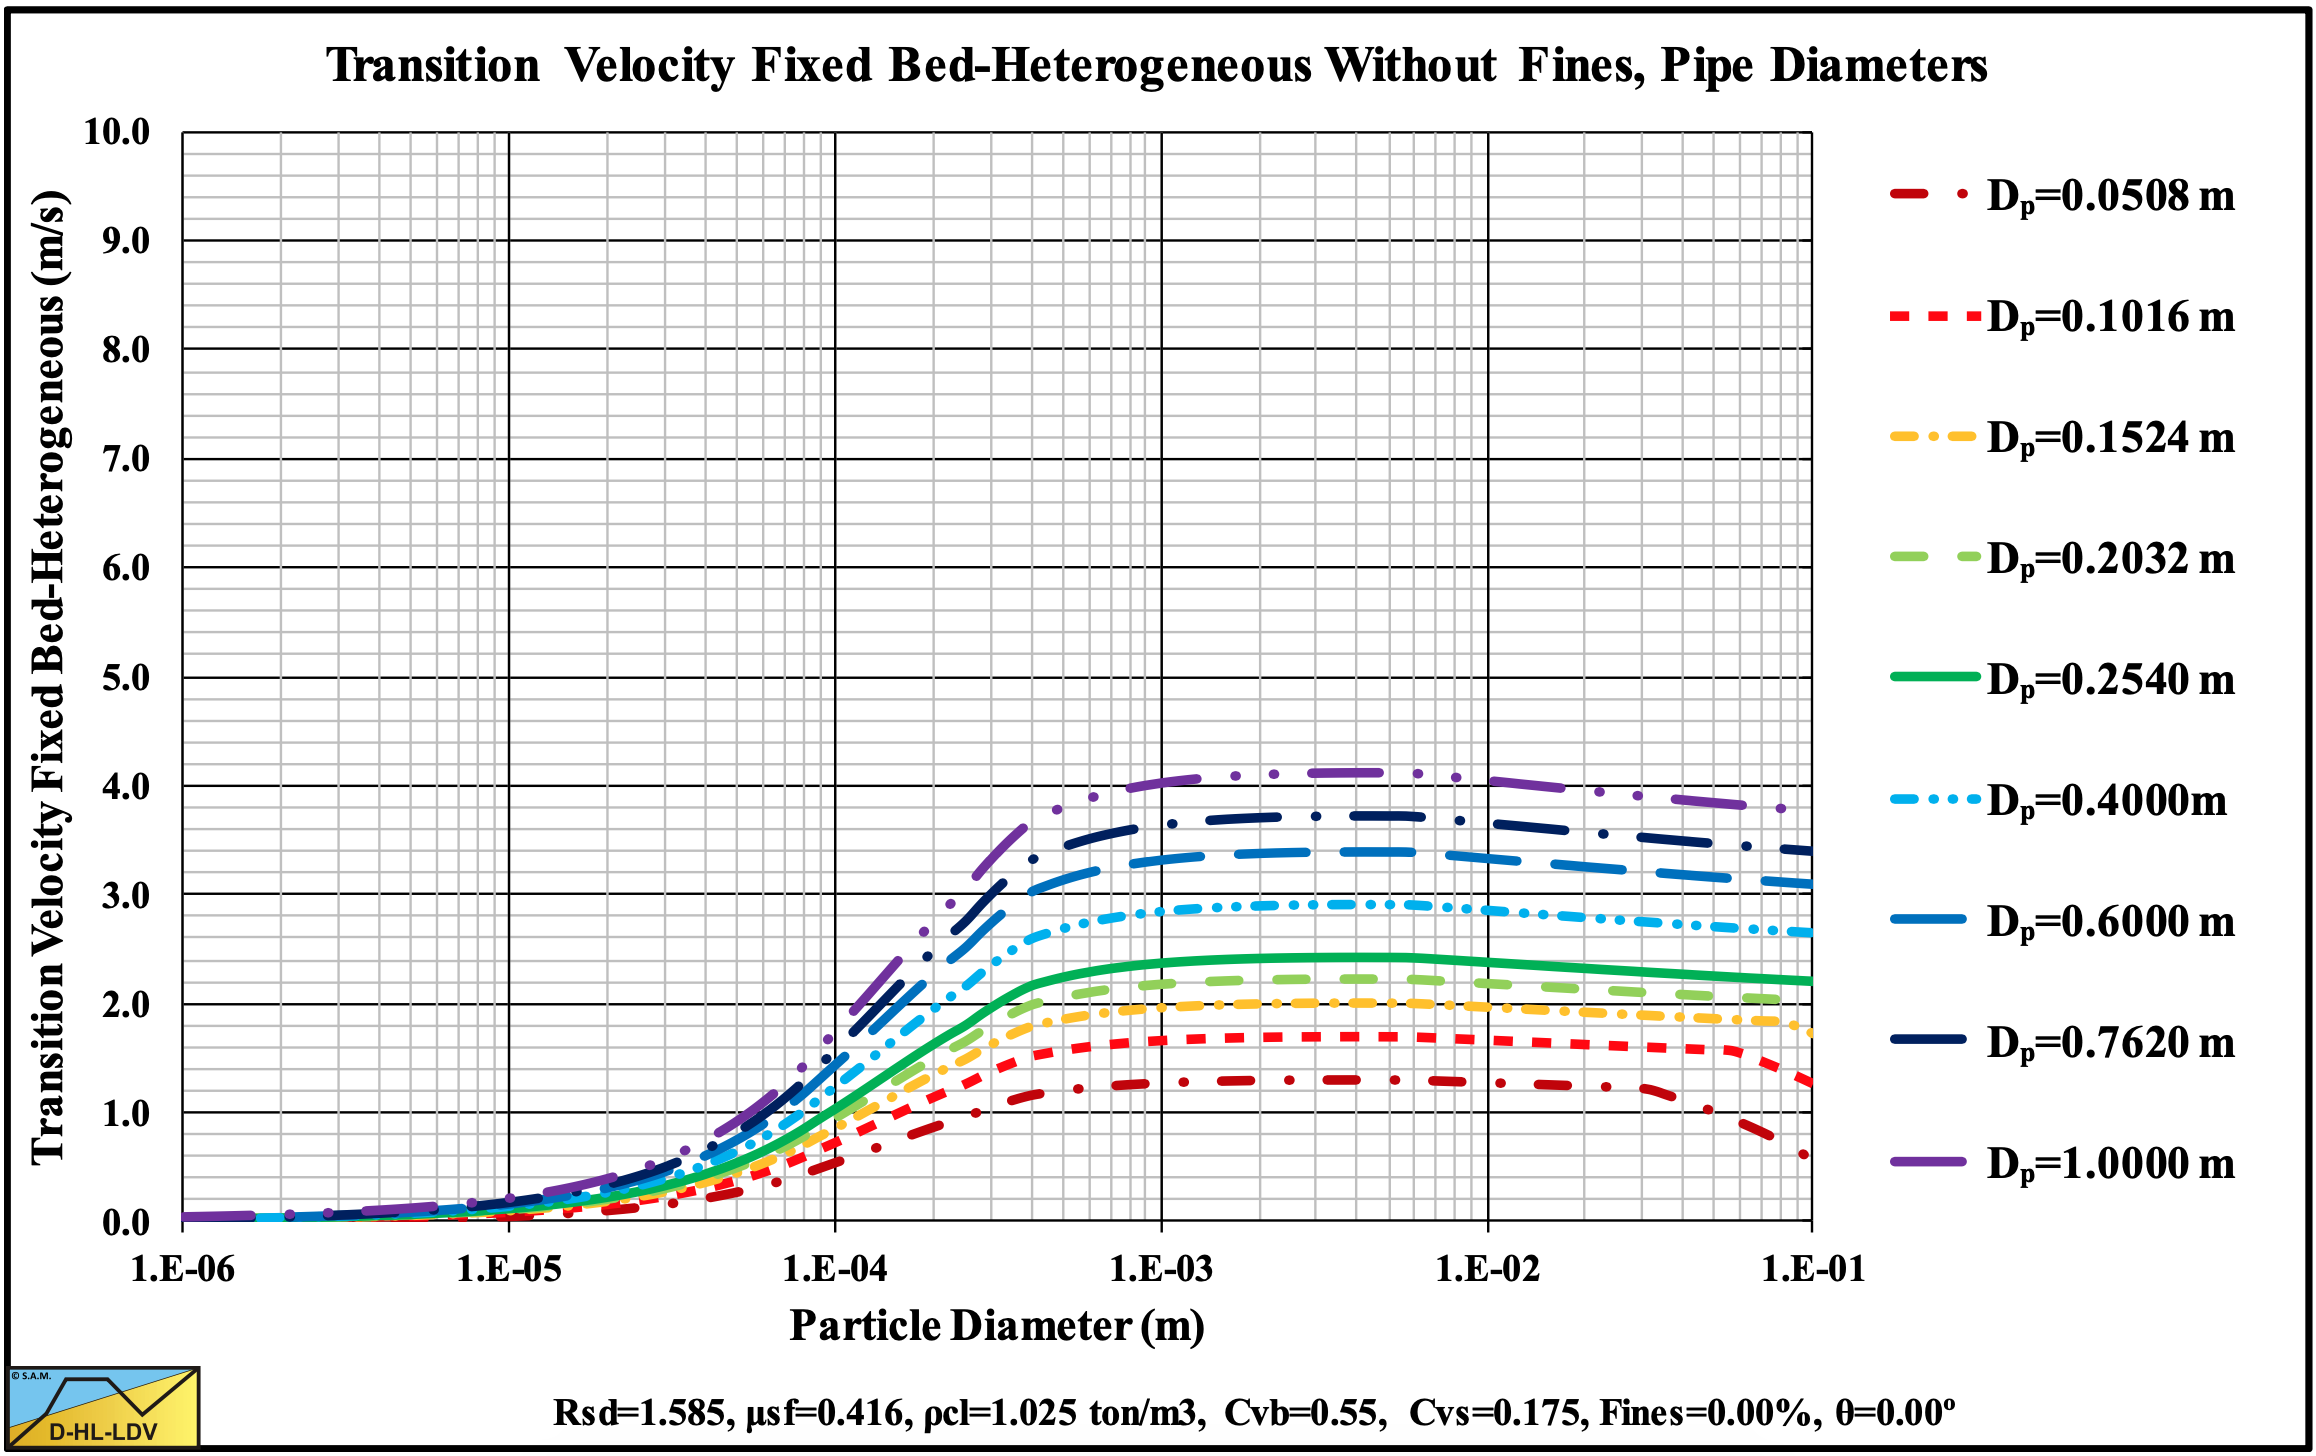
Figure 13.5-70: The transition Fixed Bed-Heterogeneous Regime at 9 pipe diameters.
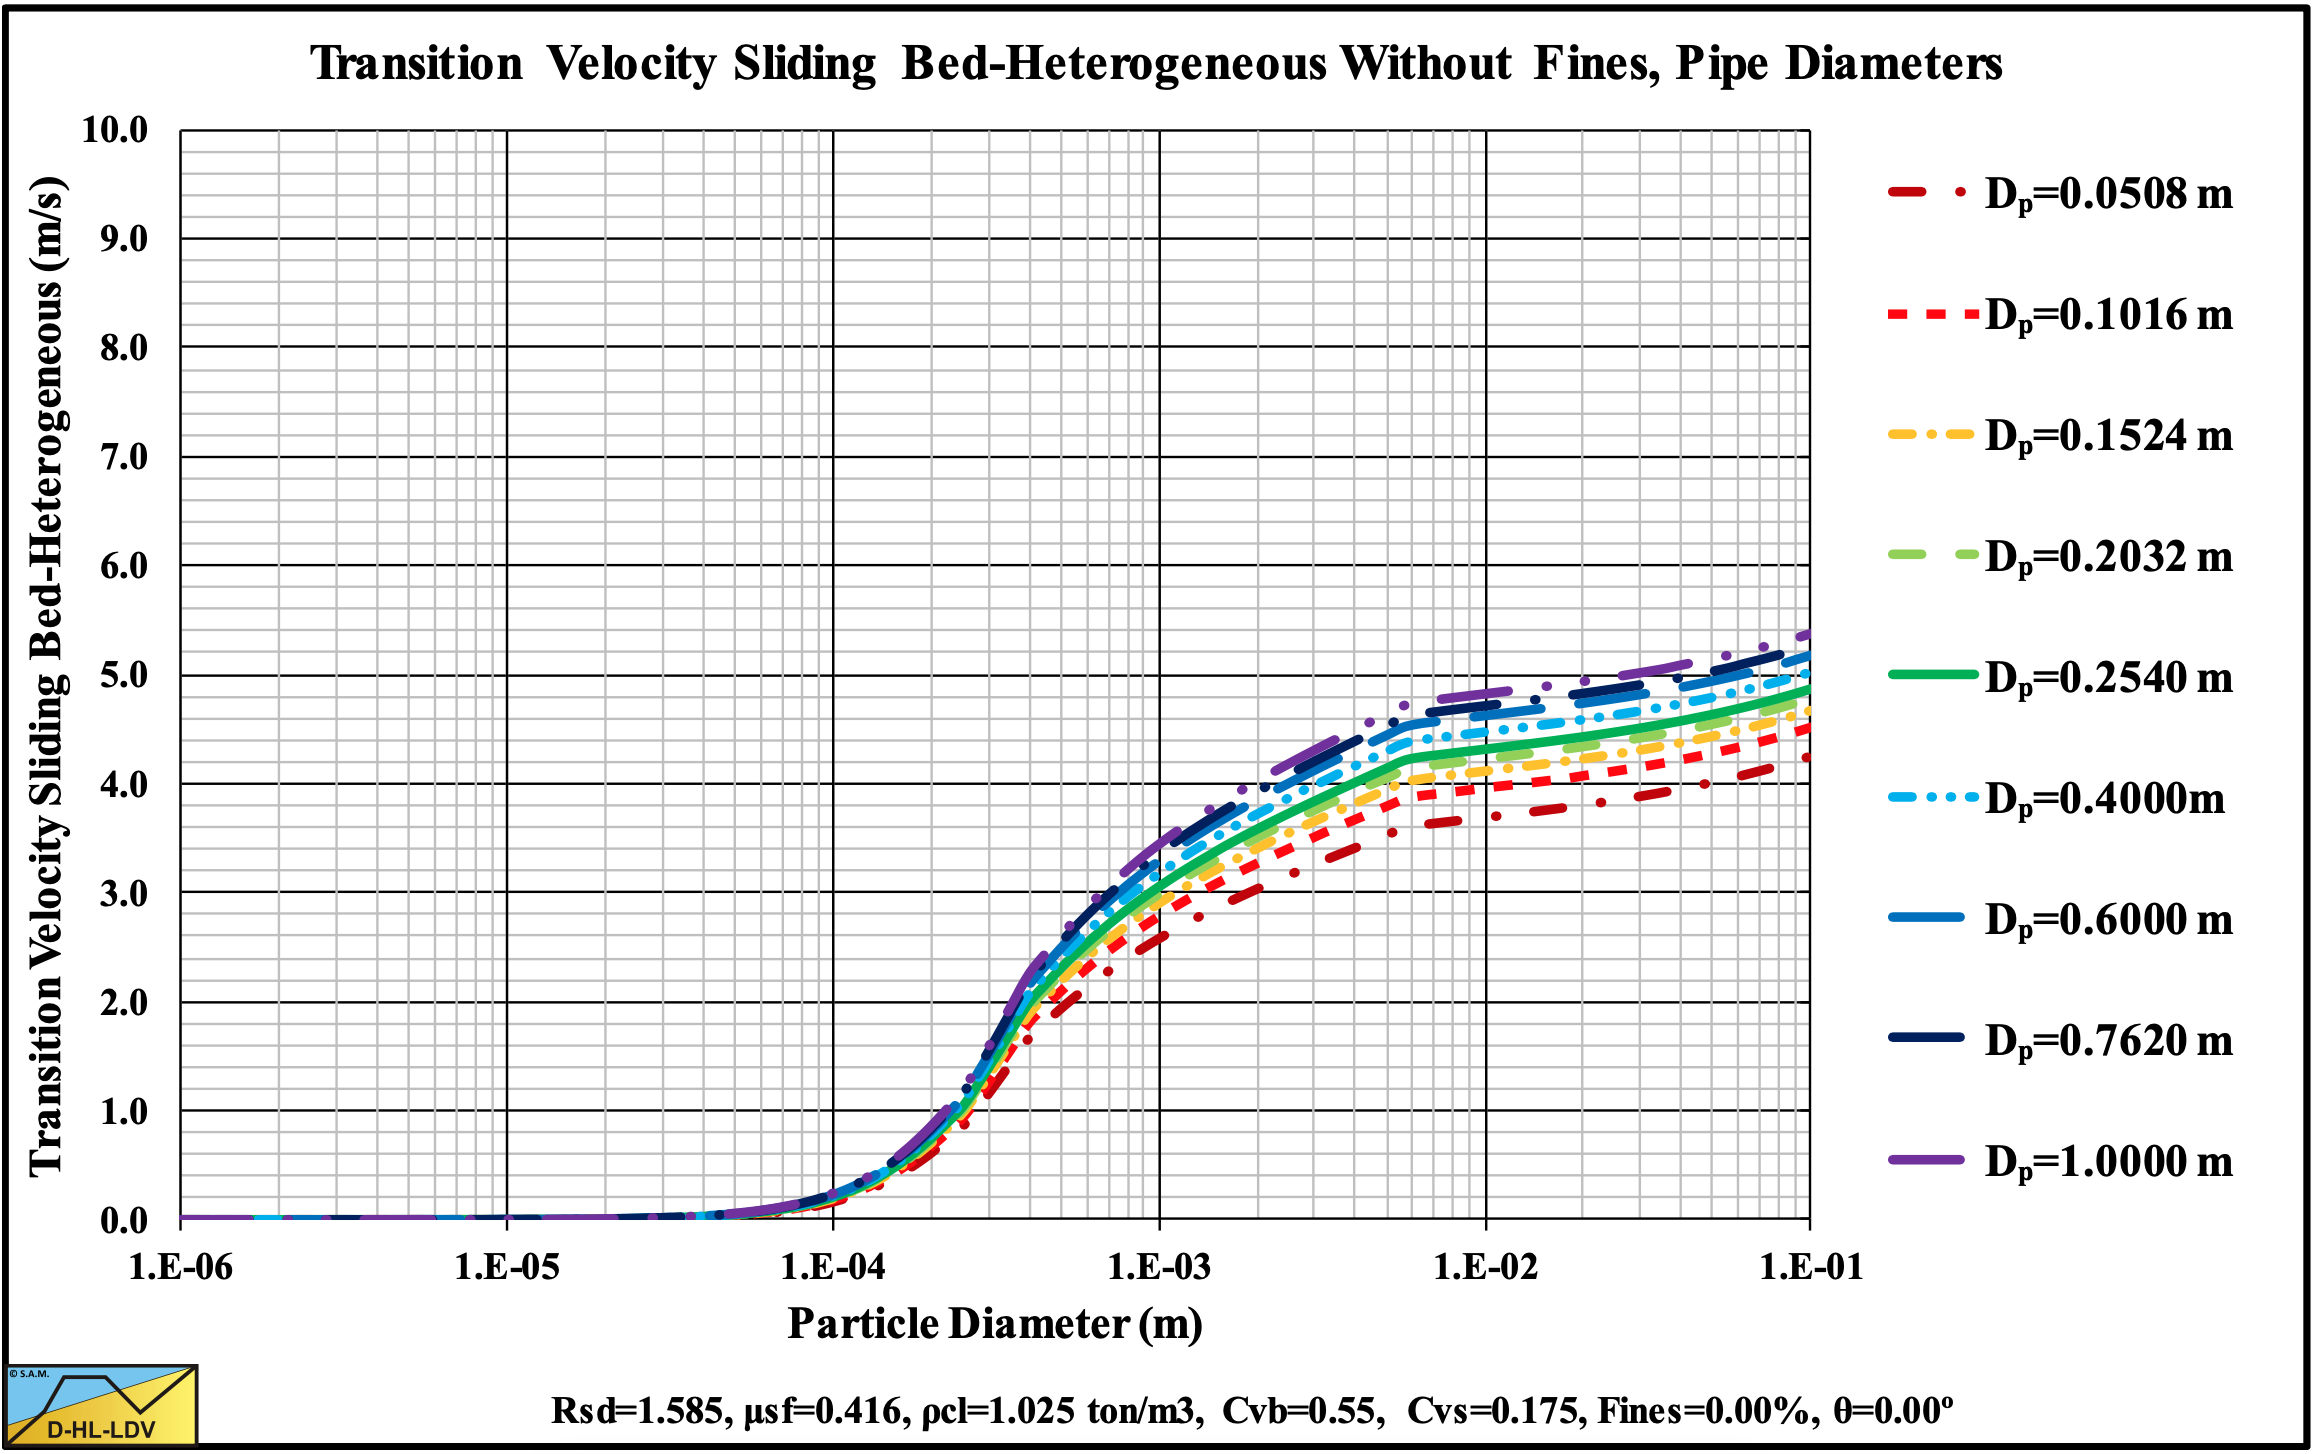
Figure 13.5-71: The transition Sliding Bed-Heterogeneous Regime at 9 pipe diameters.
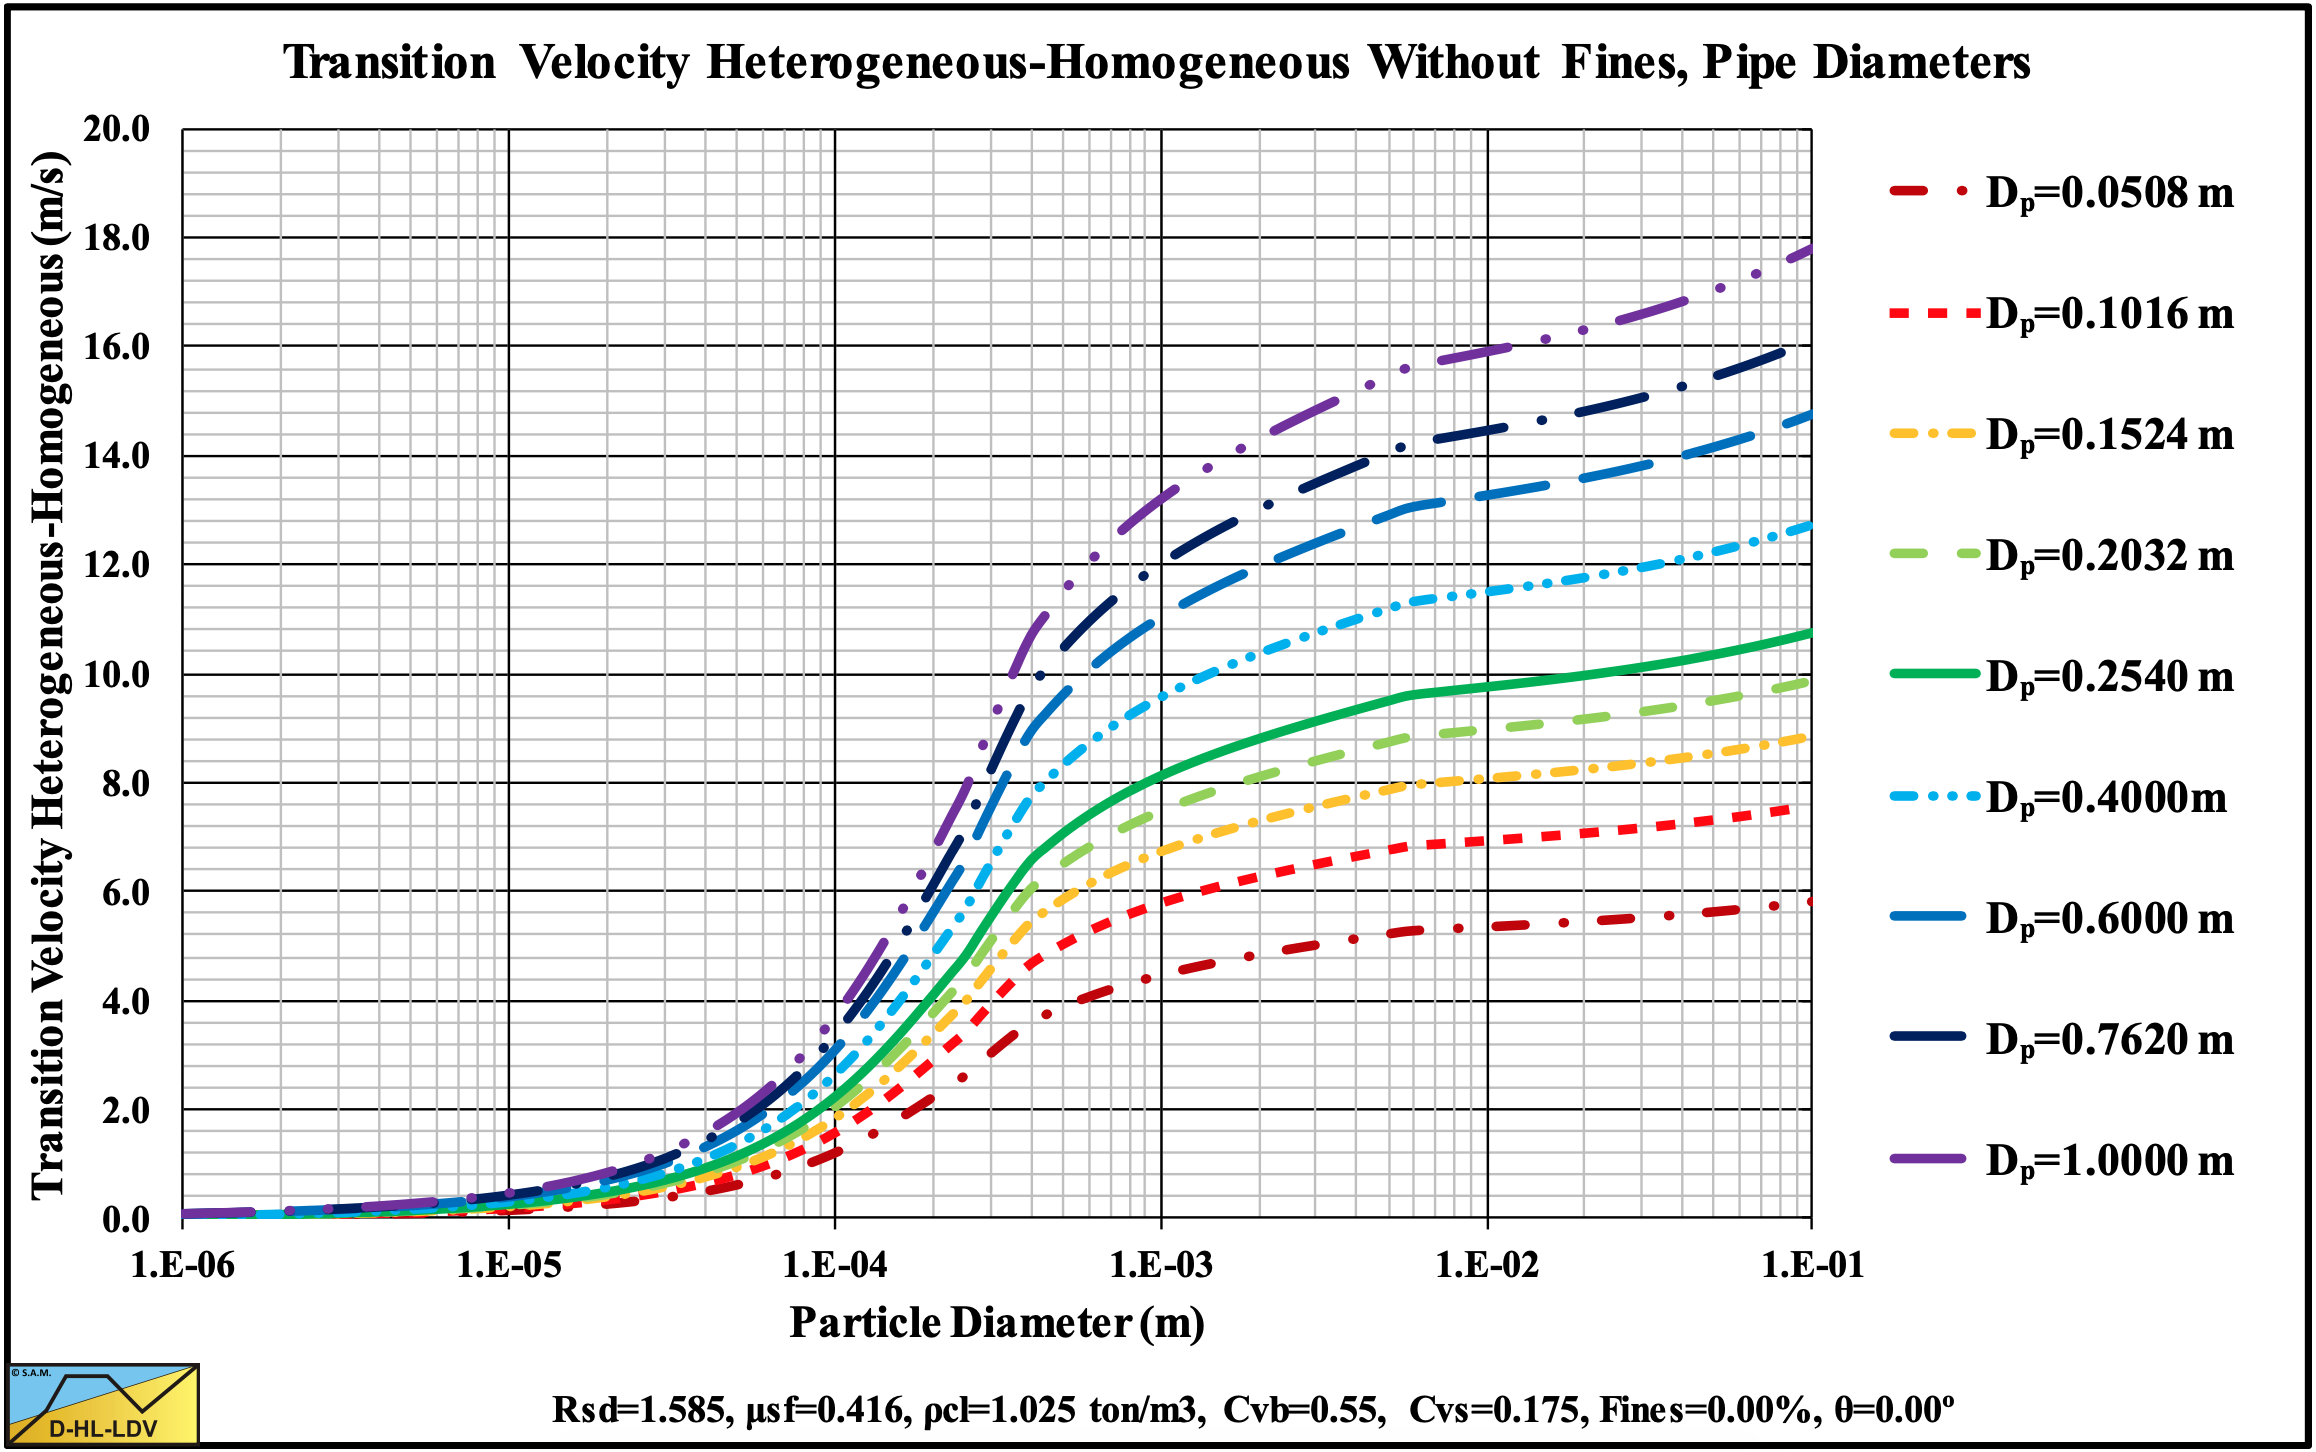
Figure 13.5-72: The transition Heterogeneous-Homogeneous at 9 pipe diameters.
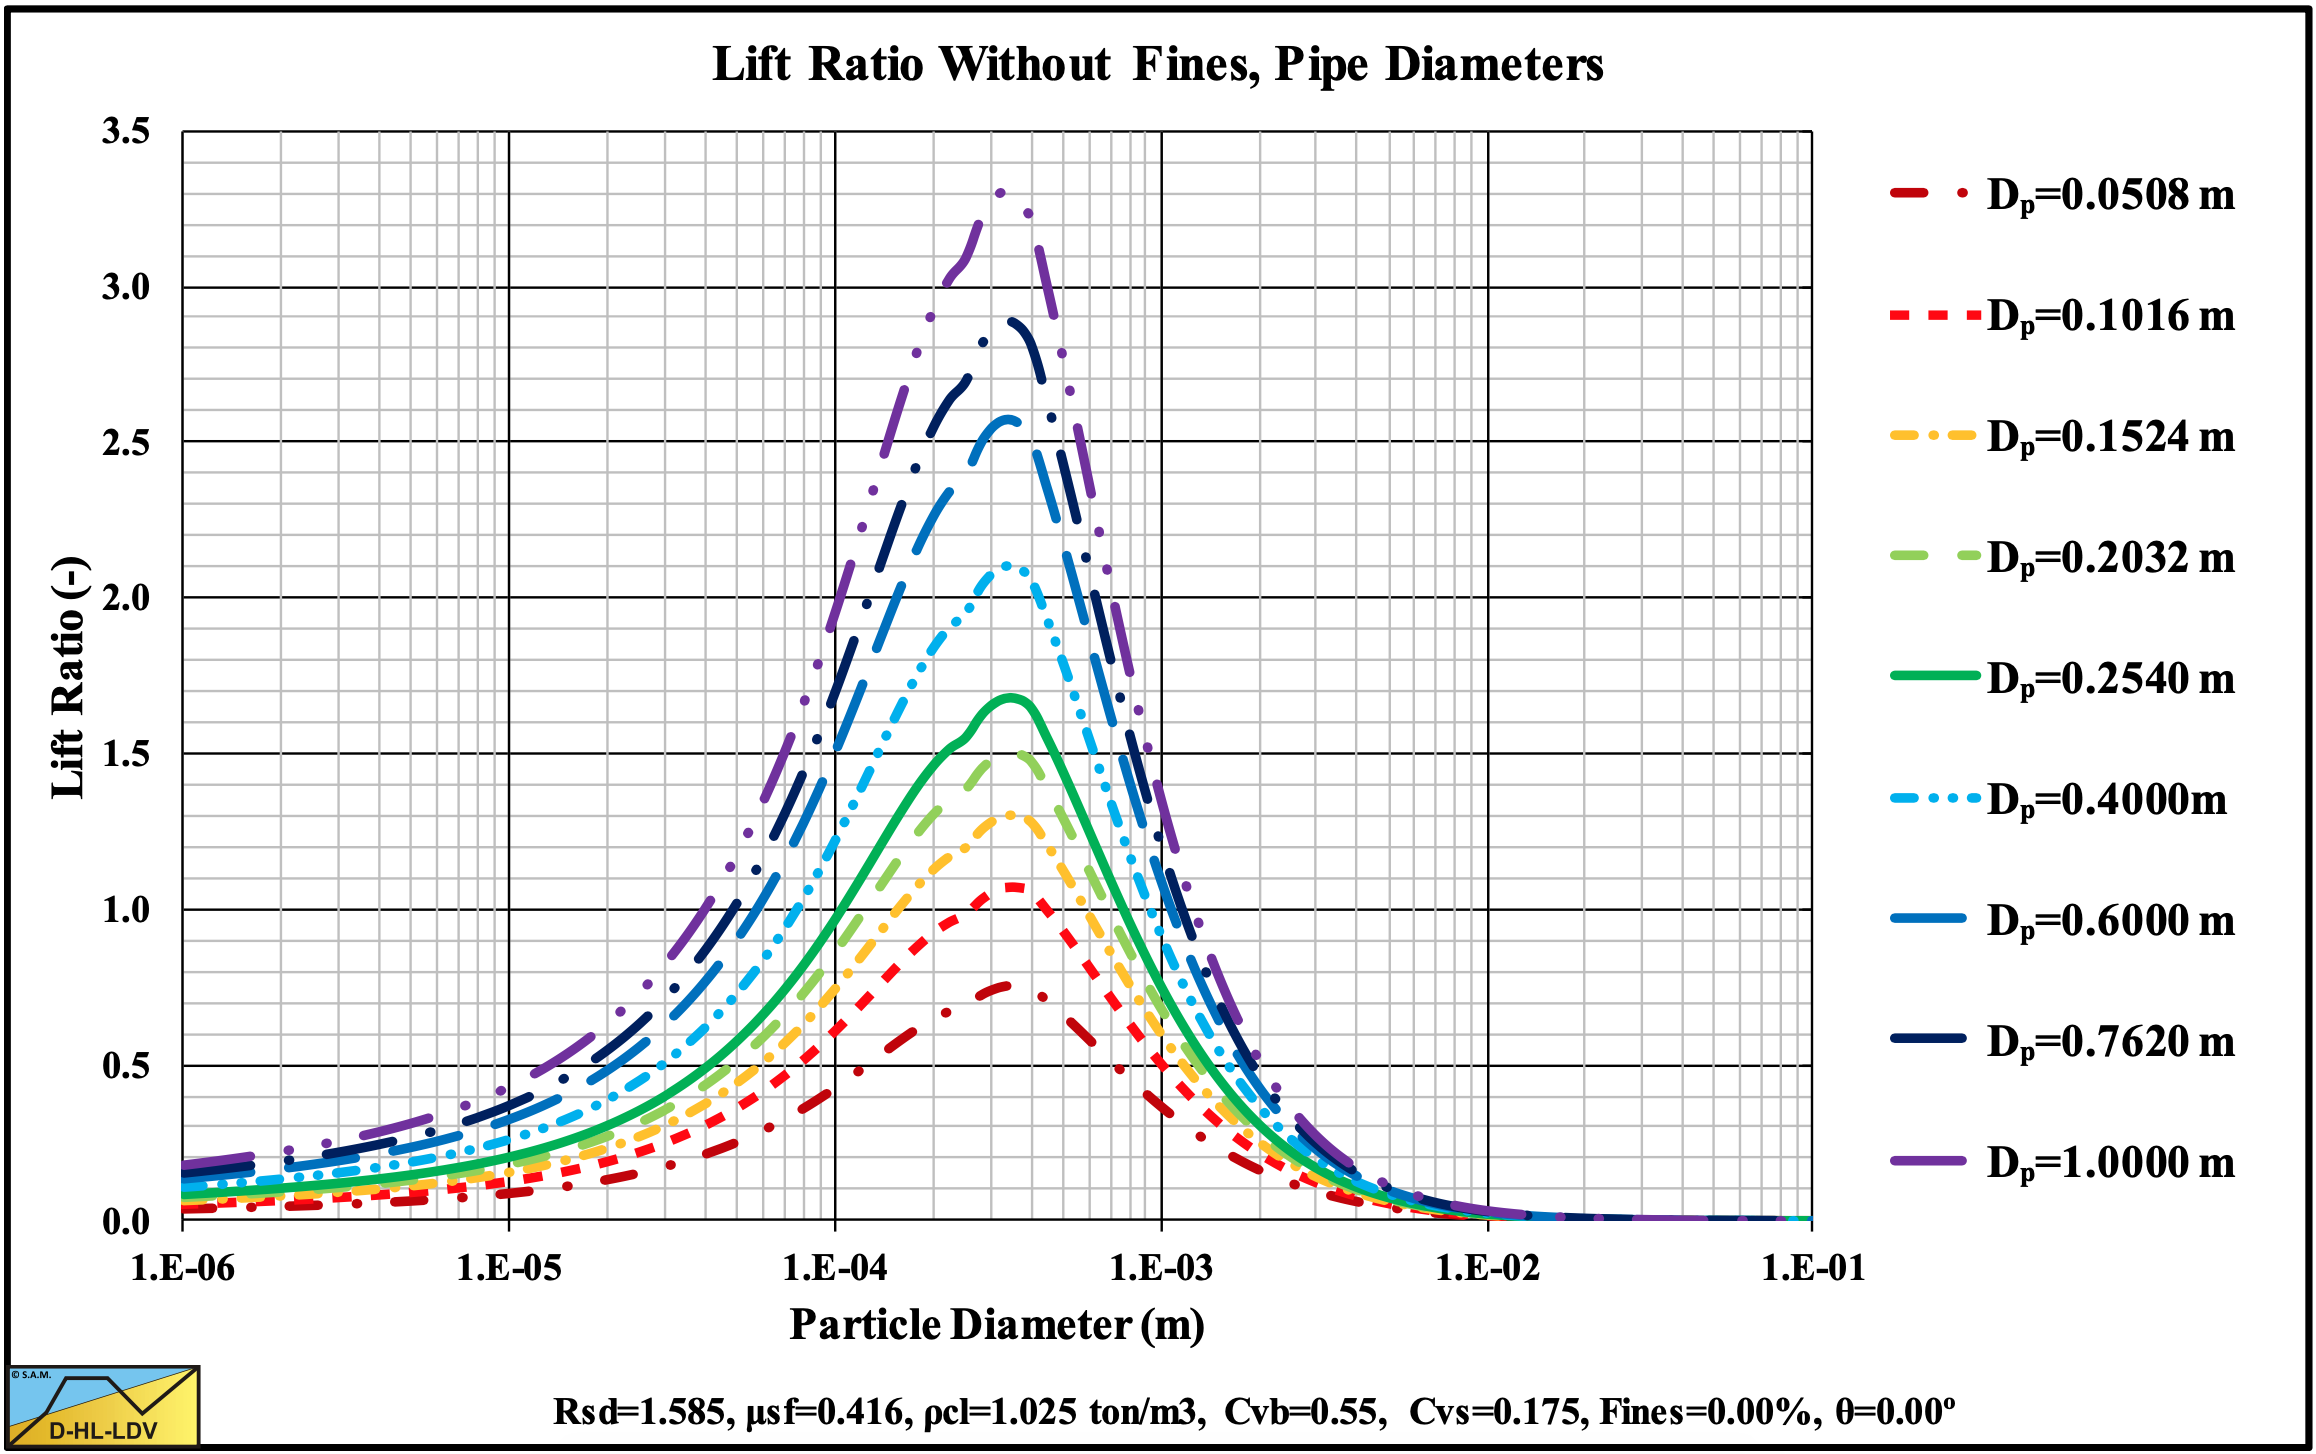
Figure 13.5-73: The lift ratio (near wall lift to gravity ratio) at 9 pipe diameters.