Opening the book…
What is Global Warming and Global Climate Change?
Global warming refers to the long-term increase in Earth's average surface temperature resulting primarily from human activities. Climate change is a broader term that includes global warming as well as changes in precipitation patterns, storms, droughts, sea level, and other aspects of Earth's climate system.
Climate has changed naturally throughout Earth's history. However, the rapid warming observed since the Industrial Revolution cannot be explained by natural causes alone. Scientists have concluded that human activities, particularly the combustion of fossil fuels and land-use changes such as deforestation, are the primary drivers of modern climate change.
Greenhouse Gases
The primary human-caused greenhouse gases are:
- Carbon dioxide (CO₂)
- Methane (CH₄)
- Nitrous oxide (N₂O)
These gases absorb infrared radiation emitted by Earth, strengthening the greenhouse effect and warming the atmosphere.
Carbon Dioxide
Carbon dioxide (CO₂) is the most important greenhouse gas driving modern climate change. Although it is naturally released through respiration, decomposition, volcanic eruptions, and ocean-atmosphere exchange, human activities, especially the burning of fossil fuels, have dramatically increased atmospheric CO₂ concentrations.
Atmospheric CO₂ concentrations have increased from approximately 280 ppm before the Industrial Revolution to more than 430 ppm today (figure \(\PageIndex{a}\). This increase closely corresponds with the large-scale combustion of fossil fuels that began during the Industrial Revolution. Ice core records show that current concentrations are higher than at any point during at least the last 800,000 years (figure \(\PageIndex{b-c}\).

Figure \(\PageIndex{a}\): The Keeling Curve: a daily record of global atmospheric carbon dioxide concentration started in 1958 and maintained by Scripps Institution of Oceanography at UCSD. Monthly mean carbon dioxide concentration in parts per million (ppm) measured at Mauna Loa Observatory, Hawaii. The carbon dioxide data on Mauna Loa constitute the longest record of direct measurements of CO2 in the atmosphere. The fluctuating black line represents the monthly mean values, centered on the middle of each month. Carbon dioxide concentrations dip every summer due to increased photosynthesis. . Image: Scripps Institution of Oceanography at UC San Diego (CC-BY-4.0); data from: C. D. Keeling, S. C. Piper, R. B. Bacastow, M. Wahlen, T. P. Whorf, M. Heimann, and H. A. Meijer, Exchanges of atmospheric CO2 and 13CO2 with the terrestrial biosphere and oceans from 1978 to 2000. I. Global aspects, SIO Reference Series, No. 01-06, Scripps Institution of Oceanography, San Diego, 88 pages, 2001. http://escholarship.org/uc/item/09v319r9

Figure \(\PageIndex{b}\): The EastGRIP ice core, which was drilled from the Greenland Ice Sheet. You can read more here. Image by Helle Astrid Kjær (CC-BY).

Figure \(\PageIndex{c}\): This graph, based on the comparison of atmospheric samples contained in ice cores and more recent direct measurements, provides evidence that atmospheric CO2 has increased since the Industrial Revolution. On the x-axis are the years before today (0 = 1950). It begins8400,000 years prior to 1950. On the y-axis is the carbon dioxide level in parts per million (ppm). Carbon dioxide levels have fluctuated over the years, but they never exceeded 300 parts per million until 1950. In 2026, carbon dioxide levels reached 431 ppm. Credit: Scripps Institution of Oceanography at UC San Diego (CC-BY-4.0) Ice core data: Lüthi, D., M. Le Floch, B. Bereiter, T. Blunier, J.-M. Barnola, U. Siegenthaler, D. Raynaud, J. Jouzel, H. Fischer, K. Kawamura, and T.F. Stocker. 2008. High-resolution carbon dioxide concentration record 650,000-800,000 years before present. Nature, Vol. 453, pp. 379-382, 15 May 2008.
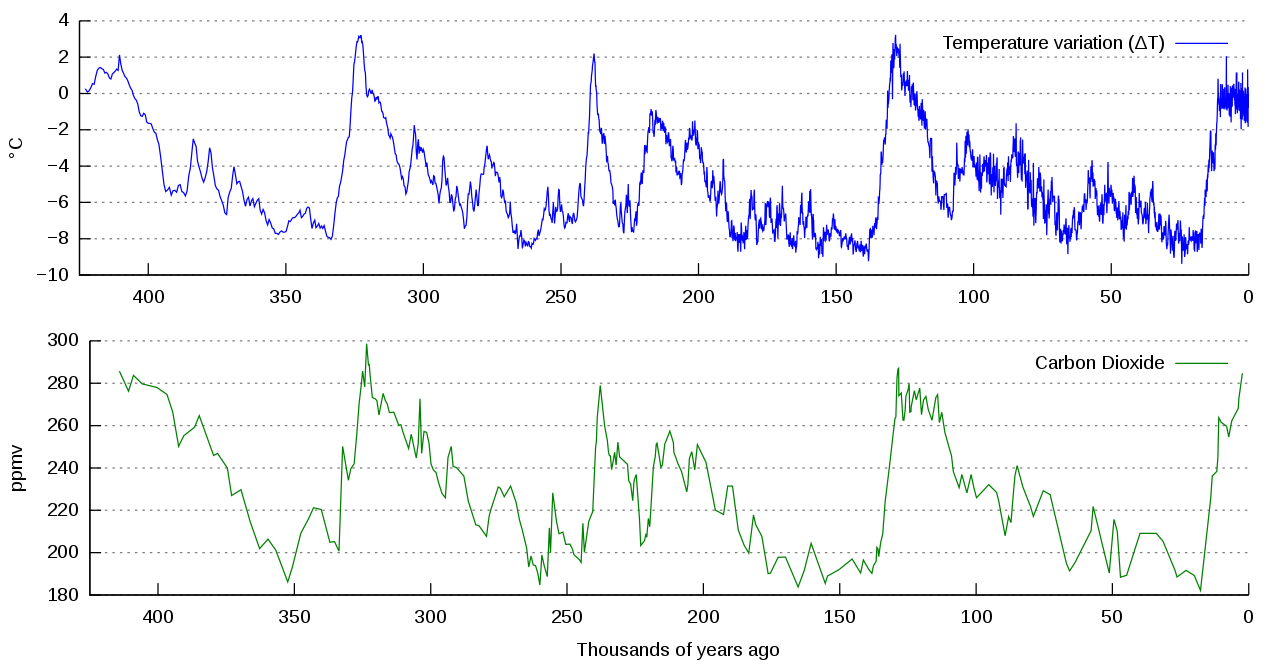
Figure \(\PageIndex{d}\): Graph of change in temperature in degrees Celsius (top, blue line) and carbon dioxide concentration in parts per million by volume (bottom, green line) measured from the Vostok, Antarctica ice core. These have been associated for over 400,000 years. As carbon dioxide concentration increased, so did temperature. As carbon dioxide concentration decreased, so did temperature. These data were collected in 1999. Since then, carbon dioxide concentrations have increased to 409.8 ppm (2019 average). Image and caption (modified) by NOAA/Autopilot (CC-BY-SA)
Methane
Although carbon dioxide is the most abundant human-produced greenhouse gas, methane (CH₄) is far more effective at trapping heat on a molecule-for-molecule basis. Over a 20-year period, a single methane molecule can trap more than 80 times as much heat as a carbon dioxide molecule, making methane a powerful contributor to short-term climate warming. While methane persists in the atmosphere for a shorter time than carbon dioxide, its strong warming effect means that even relatively small increases in methane concentrations can have significant impacts on Earth's climate.
Human activities are responsible for much of the increase in atmospheric methane since the Industrial Revolution. Major sources include the extraction, processing, and transport of fossil fuels; agricultural practices, particularly livestock production where cattle release methane during digestion; the decomposition of organic waste in landfills; and microbial processes associated with wastewater treatment. As these activities have expanded over time, atmospheric methane concentrations have risen dramatically and are now more than twice their pre-industrial levels. This increase strengthens the greenhouse effect and contributes to the warming observed across the globe.
Nitrous Oxide
Nitrous oxide (N₂O) is released from agricultural soils, fertilizer use, fossil fuel combustion, and industrial processes. Molecule-for-molecule, N₂O traps approximately 265 times more heat than CO₂ over a 100-year period.
Evidence for Human-Caused Climate Change
Scientists study both direct measurements and proxy records to understand how Earth's climate has changed over time. Direct measurements, such as atmospheric carbon dioxide concentrations, temperature records, and satellite observations, provide detailed information about recent climate conditions. Because these records only extend back a relatively short period, scientists also rely on proxy data, which are indirect indicators of past climate. Proxies such as ice cores, tree rings, ocean sediments, and glacier records preserve evidence of environmental conditions that existed hundreds to hundreds of thousands of years ago. By comparing patterns from multiple independent sources of direct and proxy evidence, scientists can reconstruct past climates, evaluate natural climate variability, and place modern climate change in a long-term context.
Several lines of evidence from both direct observations and proxy records support the conclusion that recent climate change is primarily driven by human activities.
Atmospheric Carbon Dioxide Is Increasing
The Keeling Curve shows that atmospheric CO₂ concentrations have risen continuously since measurements began in 1958 (figure \(\PageIndex{a}\).
This increase closely corresponds with the large-scale combustion of fossil fuels that began during the Industrial Revolution.
Modern CO₂ Levels Are Unprecedented
Ice core records demonstrate that present-day CO₂ concentrations exceed levels observed during the last 800,000 years (figure \(\PageIndex{c}\).
Temperature and Carbon Dioxide Are Closely Linked
Ice core records from Antarctica reveal a strong relationship between atmospheric CO₂ concentrations and global temperature over hundreds of thousands of years (figure \(\PageIndex{d}\))
Natural Factors Alone Cannot Explain Recent Warming
Climate models that include only natural influences such as volcanic activity and solar variability fail to reproduce the warming observed since the mid-twentieth century. Models that include both natural and human influences closely match observed temperatures.
Natural Influences on Climate
Natural processes continue to affect Earth's climate, including:
- Variations in solar activity
- Volcanic eruptions
- Long-term orbital cycles (Milankovitch cycles)
These factors explain many past climate changes. However, they cannot explain the rapid warming observed during recent decades.
Albedo and Climate Feedback
Earth reflects approximately 30% of incoming sunlight back into space. This reflectivity is called albedo. Bright surfaces such as clouds, snow, and ice have high albedo and reflect more solar energy. Dark surfaces such as forests and oceans absorb more sunlight.
Some climate processes amplify warming through reinforcing feedback loops. One example involves the loss of Arctic sea ice. As warming causes sea ice to melt, Earth's albedo decreases because darker ocean water absorbs more sunlight than reflective ice. The additional absorption of solar energy causes further warming, which leads to even more ice melt. This is an example of a reinforcing (positive) feedback loop, in which an initial change amplifies itself (figure \(\PageIndex{e}\).
 Figure \(\PageIndex{e}\): An example of a reinforcing (positive) feedback in the ice-albedo system. Image created by Erin Rempala using Microsoft Copilot.
Scientific Consensus on Climate Change
The Intergovernmental Panel on Climate Change (IPCC) is an international scientific body established by the United Nations to assess climate change research and provide policymakers with evidence-based information. Drawing on thousands of peer-reviewed studies, the IPCC concluded in its Sixth Assessment Report (2023) that:
- Human influence has unequivocally warmed the atmosphere, ocean, and land. In this context, unequivocally means that the evidence is so strong and consistent that there is no reasonable scientific doubt that human activities are the primary cause of recent global warming.
- Earth's average surface temperature is approximately 1.1°C warmer than it was before the Industrial Revolution.
- Climate change is already affecting the atmosphere, oceans, ice sheets, ecosystems, and human societies.
- Extreme weather events such as heat waves, heavy precipitation, droughts, and some storms are becoming more frequent or intense in many regions.
- Limiting future warming requires rapid and substantial reductions in greenhouse gas emissions.
The scientific consensus on anthropogenic climate change is supported by multiple independent lines of evidence, including atmospheric measurements, ice cores, temperature records, satellite observations, and climate models.
Why Warming Will Continue
Many greenhouse gases remain in the atmosphere for decades to centuries. Even if emissions were dramatically reduced today, some future warming would still occur because the oceans absorb and store large amounts of heat and release it slowly over time. As a result, warming and many of its impacts will continue for decades even after greenhouse gas concentrations stabilize.
Key Takeaways
Multiple independent lines of evidence show that Earth's climate is warming and that human activities are the primary cause. Atmospheric concentrations of carbon dioxide, methane, and other greenhouse gases have increased dramatically since the Industrial Revolution, strengthening the greenhouse effect. Ice core records, direct atmospheric measurements, temperature records, and climate models all support the conclusion that modern climate change is primarily driven by human activities.
Attributions
This page was heavily revised and rewritten by Erin Rempala and contains adapted content from content originally authored by Melissa Ha and Rachel Schleiger and is licensed CC BY-NC-SA 4.0.
Other sources:
- Intergovernmental Panel on Climate Change. (n.d.). Sixth Assessment Report (AR6) cycle. IPCC 6th assessment report(opens in new window) [www.ipcc.ch] Retrieved 6 May 2026.
- Scripps Institution of Oceanography. (n.d.). Keeling Curve. University of California San Diego. Keeling Curve (opens in new window) [keelingcurve.ucsd.edu]
- National Aeronautics and Space Administration. (n.d.). Climate change: Vital signs of the planet. NASA(opens in new window) [science.nasa.gov]
- Stanford University. (n.d.). Methane and climate change. Stanford Doerr School of Sustainability. Stanford(opens in new window) [sustainability.stanford.edu]
- U.S. Environmental Protection Agency. (n.d.). EPA.gov [www.epa.gov]
Modified by Melissa Ha from the following sources:
- Climate and the Effects of Global Climate Change from General Biology by OpenStax (licensed under CC-BY(opens in new window))
- Climate Change from Environmental Biology by Matthew R. Fisher (licensed under CC-BY(opens in new window))
- Carbon Cycle from Biology by John W. Kimball (licensed under CC-BY(opens in new window))
This page titled 9.4: Evidence and Causes of Climate Change was last modified on Sat, 12 Sep 2026 19:57:17 GMT and is shared under a CC BY-NC-SA 4.0 license and was authored, remixed, and/or curated by Melissa Ha and Rachel Schleiger (ASCCC Open Educational Resources Initiative) .
The book could not be loaded just now.